Organization Finance Overview
Last updated: 2025-08-06 15:08:53
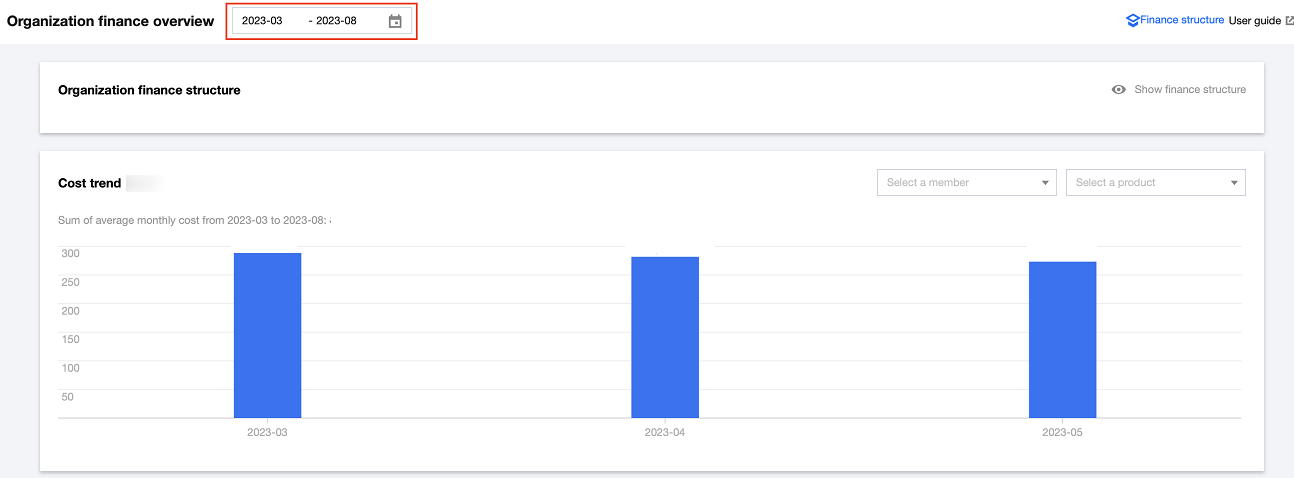
The group financial overview allows admin accounts to view and manage the corporate consumption by dimensions such as members and products. Corporate admin accounts can uniformly view and manage the consumption of all accounts within the company, thus enhancing the efficiency of financial management.
Note:
1. The group financial overview is currently only available to distributor sub-customers and only displays cost trends and bill details for pay-on-behalf.
2. The group financial overview regularly synchronizes the current month's bill data every morning. If a member joins the group after the 1st of the month, the financial data for that month is not be visible for the member (except for the admin account).
3. The group bill overview does not display cost trends and bill details prior to the creation of the group organization.
4. The organization account only allows admin accounts to view the financial overview within the organization. For a complete view of bill details, please go to billing.
The steps are as follows:
Viewing cost trends and bill details
1. Log in to the Tencent Cloud Organization console, then select Group Finance Overview from the left-hand navigation.
2. On the Group Financial Overview page, select the appropriate time at the top. Select a member and a product in the Cost trend module. The corresponding cost trends and bill details will be displayed.
Note:
Once you enter the Group Financial Overview page, it will display the financial overview details for the recent half year of all the members and products by default.
The maximum time interval for cost information is six months. Details with the time interval exceeding this value are not supported for display.

3. In the Cost trend module, you can view the cost trend chart and the specific consumption amounts each month and the average total monthly cost for the selected product of the selected member within the selected time.
4. In the Bill details module, you can view the cost details of the selected member for the selected product within the selected time. In the top right corner, you can choose to display By member or By product according to your needs.

(1)If By member is selected:
A pie chart displaying the Top 5 member accounts by total consumption amount is shown above, with the specific member account names, corresponding amounts, and proportions displayed on the right.
A financial list of the selected members is displayed below, including Member account ID, Member account name, Month, Total cost, Consumption percentage, and Operation. Clicking Operation will display the product consumption distribution diagram for a member during the selected period.
(2)If By product is selected:
A pie chart displaying the Top 5 products by total consumption amount is shown above, with the specific product names, corresponding amounts, and proportions displayed on the right.
A financial list of the selected products is displayed below, including Product name, Month, Total cost, Consumption percentage, and Operation. Clicking Operation will display the member consumption distribution diagram for a product during the selected period.
Was this page helpful?
You can also Contact Sales or Submit a Ticket for help.
Yes
No
Feedback

