Viewing Database Proxy Monitoring Data
最終更新日:2025-06-10 15:09:03
Viewing Database Proxy Monitoring Data
最終更新日: 2025-06-10 15:09:03
This document introduces how to view database proxy node monitoring data in the TDSQL-C for MySQL console.
Prerequisite
Database Proxy Node Monitoring Metrics
Note:
When you obtain monitoring data through API calls, the monitoring metric names used in the call parameter items should follow the Callable Metric Name column in the table below.
Monitoring Metric Name | Callable Metric Name | Unit |
Current number of connections | ProxyCurrentConnections | Individual |
Number of requests | ProxyQueries | Times/second |
Number of read requests | ProxyRouteSlave | Times/second |
Number of write requests | ProxyRouteMaster | Times/second |
CPU utilization | ProxyCpuUseRate | % |
Memory utilization | ProxyMemoryUseRate | % |
Memory usage | ProxyMemoryUsage | MB |
Client traffic sent per second by the database proxy | ProxyBytesSent | MB/s |
Client traffic received per second by the database proxy | ProxyBytesReceived | MB/s |
Directions
1. Log in to the TDSQL-C for MySQL console, select the cluster with the proxy enabled in the cluster list, and click the cluster ID to enter the cluster management page.
2. In the topology diagram under Cluster Management > Cluster Details, hover the mouse pointer over the database proxy section and click Details to enter the database proxy management page. Alternatively, you can directly select the Database Proxy tab on the cluster management page to enter the database proxy management page.
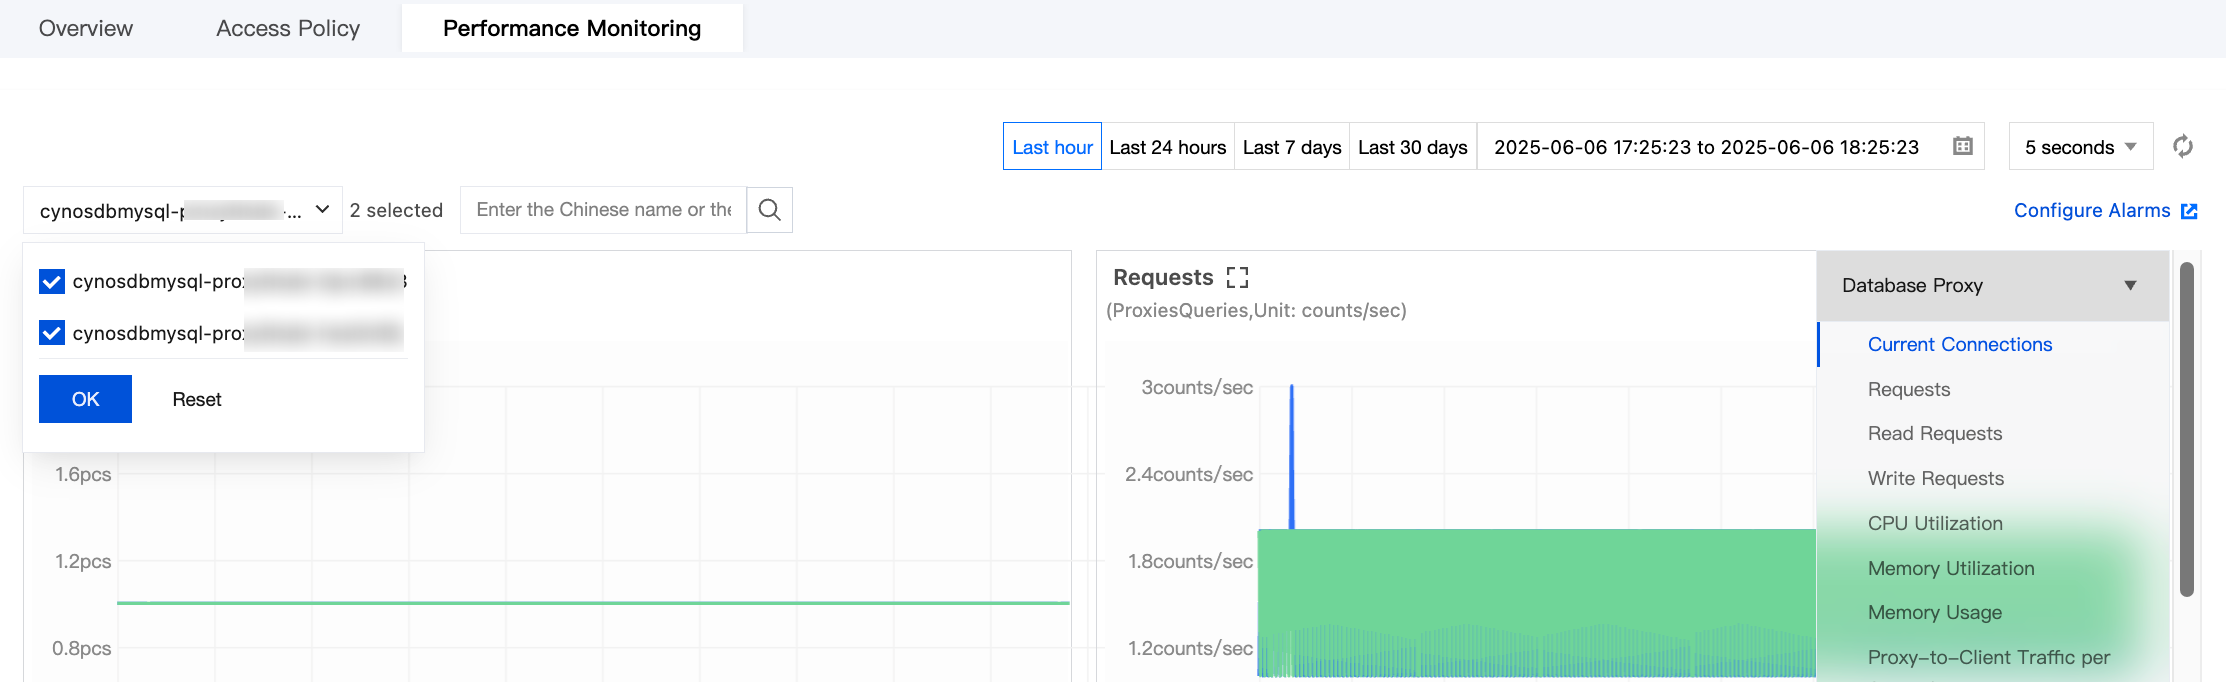
3. On the Database Proxy page, select Performance Monitoring, and click the node name to view the monitoring of each proxy node.
フィードバック