tencent cloud

Connecting to Prometheus
Last updated: 2024-06-26 15:56:25
Connecting to Prometheus
Last updated: 2024-06-26 15:56:25

Overview

TDMQ for RabbitMQ clusters currently provide Prometheus to scrape the metric information of nodes, including basic monitoring metrics such as queue, channel, and connection, as well as the metrics exposed by the broker's JMX.

Directions

1. Log in to the RabbitMQ console.
2. Select Cluster > Cluster on the left sidebar, select a region, and click the ID of the target cluster to enter the Basic Info page of the cluster.
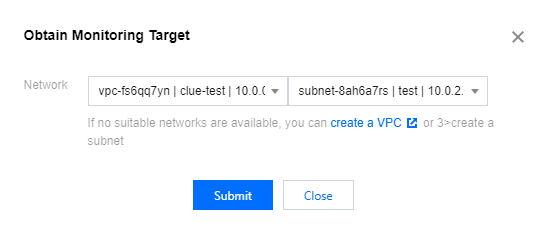
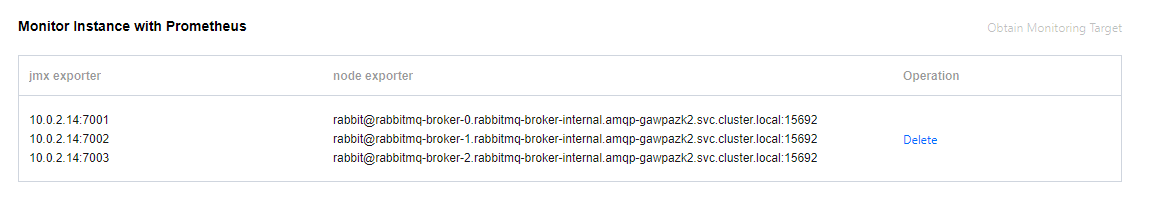
3. Click Obtain Monitoring Target in the top-right corner of the Other Information > Monitor Instance with Prometheus module and select the VPC and subnet.


4. Click Submit to get the set of monitoring targets.


5. Download Prometheus and configure the monitoring scrape address.
5.1 Enter the directory of the Prometheus package and run the following command to decompress it.
tar -vxf prometheus-2.30.3.linux-amd64.tar.gz
5.2 Modify the prometheus.yml configuration file by adding the jmx_exporter and node_exporter scrape tasks.
scrape_configs:
# The job name is added as a label `job=<job_name>` to any timeseries scraped from this config.
- job_name: "prometheus"
# metrics_path defaults to '/metrics'
# scheme defaults to 'http'.
static_configs:
- targets: ["localhost:9090"]

- job_name: "broker-jmx-exporter"
scrape_interval: 5s
metrics_path: '/metrics'
static_configs:
- targets: ['10.x.x.0:60001','10.x.x.0:60003','10.x.x.0:60005']
labels:
application: 'broker-jmx'
- job_name: "broker-node-exporter"
scrape_interval: 10s
metrics_path: '/metrics'
static_configs:
- targets: ['10.x.x.0:60002','10.x.x.0:60004','10.x.x.0:60006']
labels:
application: 'broker-node'
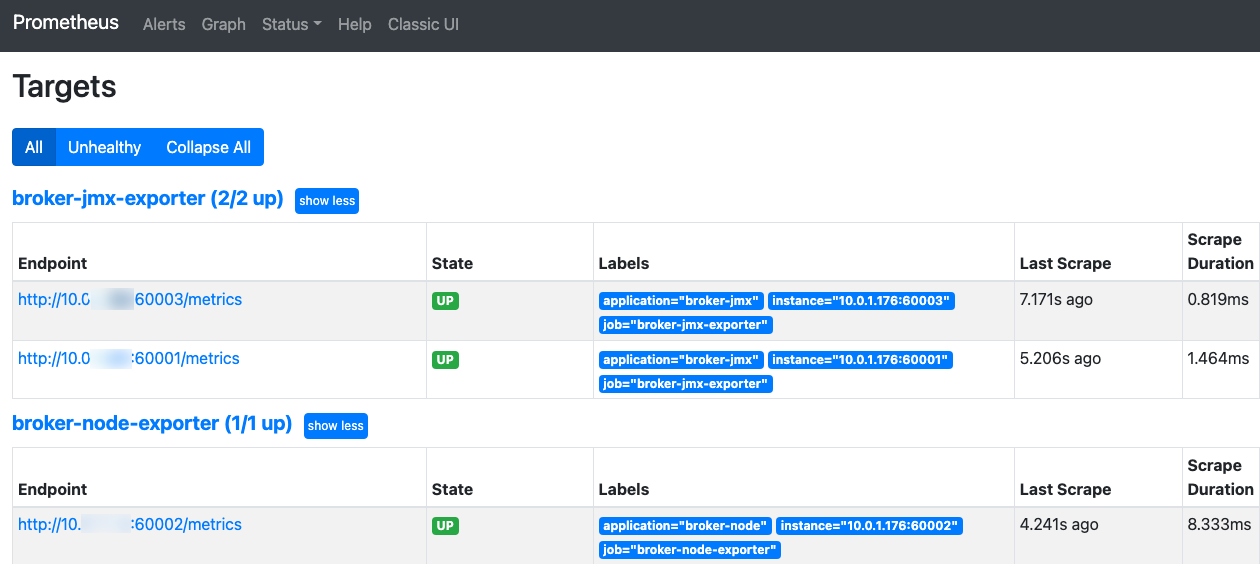
Here, broker-jmx-exporter is the tag configured for the jmx metric of the broker scraped by Prometheus, Targets contains the information of the mapped port, broker-node-exporter is the tag configured for the basic metrics of the node of the scraped broker, and scrape_interval is the frequency of scraping metric data.
5.3 Start Prometheus.
./prometheus --config.file=prometheus.yml --web.enable-lifecycle
5.4 Open the UI provided by Prometheus to check whether the connected targets are normal by entering http://localhost:9090 in the browser for example.


5.5 Confirm that all targets are in UP status.


If the targets are in DOWN status, check whether the network is accessible or check the Error option at the end of the status bar for the cause.
5.6 Query the monitoring metric data.
Click Graph, enter a metric name such as node_memory_MemAvailable_bytes, and click Execute to view the monitoring data.


Was this page helpful?
You can also Contact Sales or Submit a Ticket for help.
Yes
No

Feedback