
JVM 接入

最后更新时间:2024-01-29 15:55:14
操作场景
在使用 Java 作为开发语言的时候,需要监控 JVM 的性能。 Prometheus 监控服务通过采集应用暴露出来的 JVM 监控数据,并提供了开箱即用的 Grafana 监控大盘。
本文以如何在容器服务上部署普通 Java 应用为例,介绍如何通过 Prometheus 监控服务监控其状态。
说明:
若已使用 Spring Boot 作为开发框架,请参见 Spring Boot 接入。
前提条件
创建腾讯云容器服务 托管版集群。
操作步骤
说明:
修改应用的依赖及配置
步骤1:修改 pom 依赖
在
pom.xml 文件中添加相关的 Maven 依赖项,试情况调整相应的版本,示例如下:<dependency><groupId>io.prometheus</groupId><artifactId>simpleclient</artifactId><version>0.9.0</version></dependency><dependency><groupId>io.micrometer</groupId><artifactId>micrometer-registry-prometheus</artifactId><version>1.1.7</version></dependency>
步骤2:修改代码
在项目启动时,添加相应的监控配置,同时 micrometer 也提供了部分常用的监控数据采集,具体在
io.micrometer.core.instrument.binder 包下,可以按实际情况添加。示例如下:public class Application {// 作为全局变量,可以在自定义监控中使用public static final PrometheusMeterRegistry registry = new PrometheusMeterRegistry(PrometheusConfig.DEFAULT);static {// 添加 Prometheus 全局 Label,建议加一上对应的应用名registry.config().commonTags("application", "java-demo");}public static void main(String[] args) throws Exception {// 添加 JVM 监控new ClassLoaderMetrics().bindTo(registry);new JvmMemoryMetrics().bindTo(registry);new JvmGcMetrics().bindTo(registry);new ProcessorMetrics().bindTo(registry);new JvmThreadMetrics().bindTo(registry);new UptimeMetrics().bindTo(registry);new FileDescriptorMetrics().bindTo(registry);System.gc(); // Test GCtry {// 暴露 Prometheus HTTP 服务,如果已经有,可以使用已有的 HTTP ServerHttpServer server = HttpServer.create(new InetSocketAddress(8080), 0);server.createContext("/metrics", httpExchange -> {String response = registry.scrape();httpExchange.sendResponseHeaders(200, response.getBytes().length);try (OutputStream os = httpExchange.getResponseBody()) {os.write(response.getBytes());}});new Thread(server::start).start();} catch (IOException e) {throw new RuntimeException(e);}}}
说明:
由于 JVM GC Pause 监控是通过 GarbageCollector Notification 机制实现,因此只有发生 GC 之后才有监控数据。上述示例为了测试更直观,主动调用了
System.gc()。步骤3:本地验证
本地启动之后,可以通过
http://localhost:8080/metrics 访问到 Prometheus 协议的指标数据。将应用发布到腾讯云容器服务上
步骤1:本地配置 Docker 镜像环境
步骤2:打包及上传镜像
1. 在项目根目录下添加
Dockerfile,请根据实际项目进行修改。示例如下:FROM openjdk:8-jdkWORKDIR /java-demoADD target/java-demo-*.jar /java-demo/java-demo.jarCMD ["java","-jar","java-demo.jar"]
2. 打包镜像,在项目根目录下运行如下命令,需要替换对应的
namespace/ImageName/镜像版本号。mvn clean packagedocker build . -t ccr.ccs.tencentyun.com/[namespace]/[ImageName]:[镜像版本号]docker push ccr.ccs.tencentyun.com/[namespace]/[ImageName]:[镜像版本号]
示例如下:
mvn clean packagedocker build . -t ccr.ccs.tencentyun.com/prom_spring_demo/java-demo:latestdocker push ccr.ccs.tencentyun.com/prom_spring_demo/-demo:latest
步骤3:应用部署
1. 登录 容器服务控制台,选择需要部署的容器集群。
2. 通过工作负载 > Deployment进入
Deployment 管理页面,选择对应的 命名空间 来进行部署服务,通过 YAML 来创建对应的 Deployment,YAML 配置如下。说明:
如需通过控制台创建,请参见Spring Boot 接入。
apiVersion: apps/v1kind: Deploymentmetadata:labels:k8s-app: java-demoname: java-demonamespace: spring-demospec:replicas: 1selector:matchLabels:k8s-app: java-demotemplate:metadata:labels:k8s-app: java-demospec:containers:- image: ccr.ccs.tencentyun.com/prom_spring_demo/java-demoimagePullPolicy: Alwaysname: java-demoports:- containerPort: 8080name: metric-portterminationMessagePath: /dev/termination-logterminationMessagePolicy: FilednsPolicy: ClusterFirstimagePullSecrets:- name: qcloudregistrykeyrestartPolicy: AlwaysschedulerName: default-schedulerterminationGracePeriodSeconds: 30
步骤4:添加采取任务
1. 登录 Prometheus 控制台,选择对应 Prometheus 实例进入管理页面。
2. 通过集成容器服务列表单击集群 ID 进入到容器服务集成管理页面。
3. 通过服务发现添加
Pod Monitor 来定义 Prometheus 抓取任务,YAML 配置示例如下:apiVersion: monitoring.coreos.com/v1kind: PodMonitormetadata:name: java-demonamespace: cm-prometheusspec:namespaceSelector:matchNames:- java-demopodMetricsEndpoints:- interval: 30spath: /metricsport: metric-portselector:matchLabels:k8s-app: java-demo
步骤5:查看监控
1. 在对应 Prometheus 实例 >集成中心中找到
JVM 监控,安装对应的 Grafana Dashboard 即可开启 JVM 监控大盘。2. 打开 Prometheus 实例对应的 Grafana 地址,在
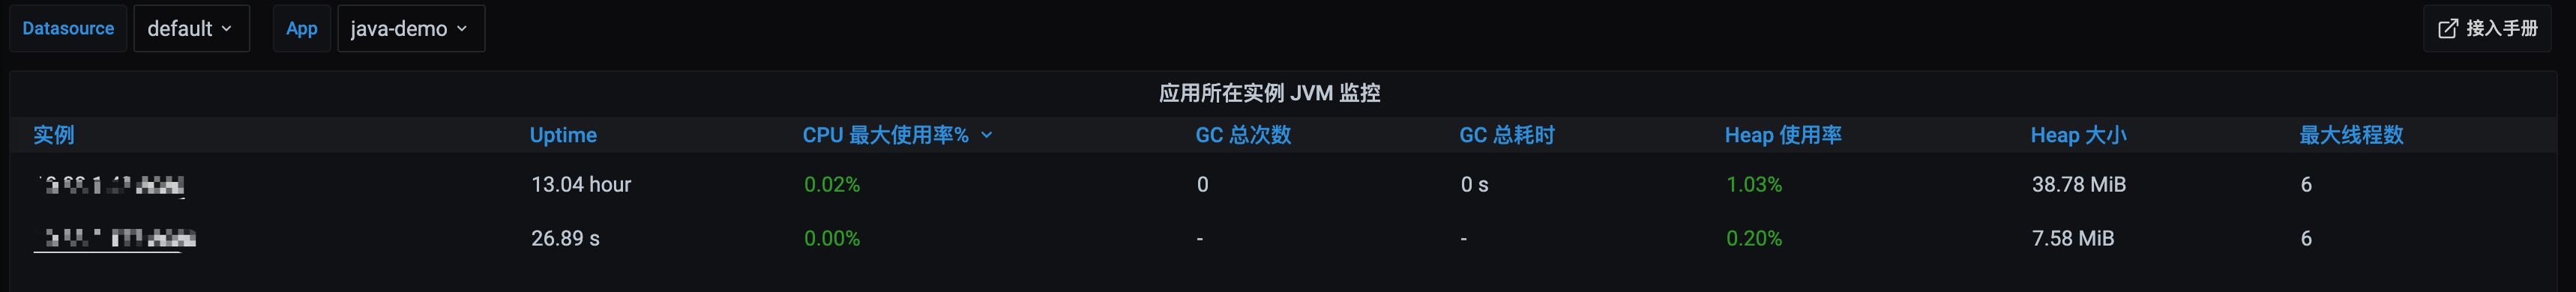
Dashboards/Manage/Application 下查看应用相关的监控大屏。应用 JVM:从应用角度出发,查看该应用下所有实例是否有问题,当发现某个实例有问题时可以下钻到对应的实例监控。
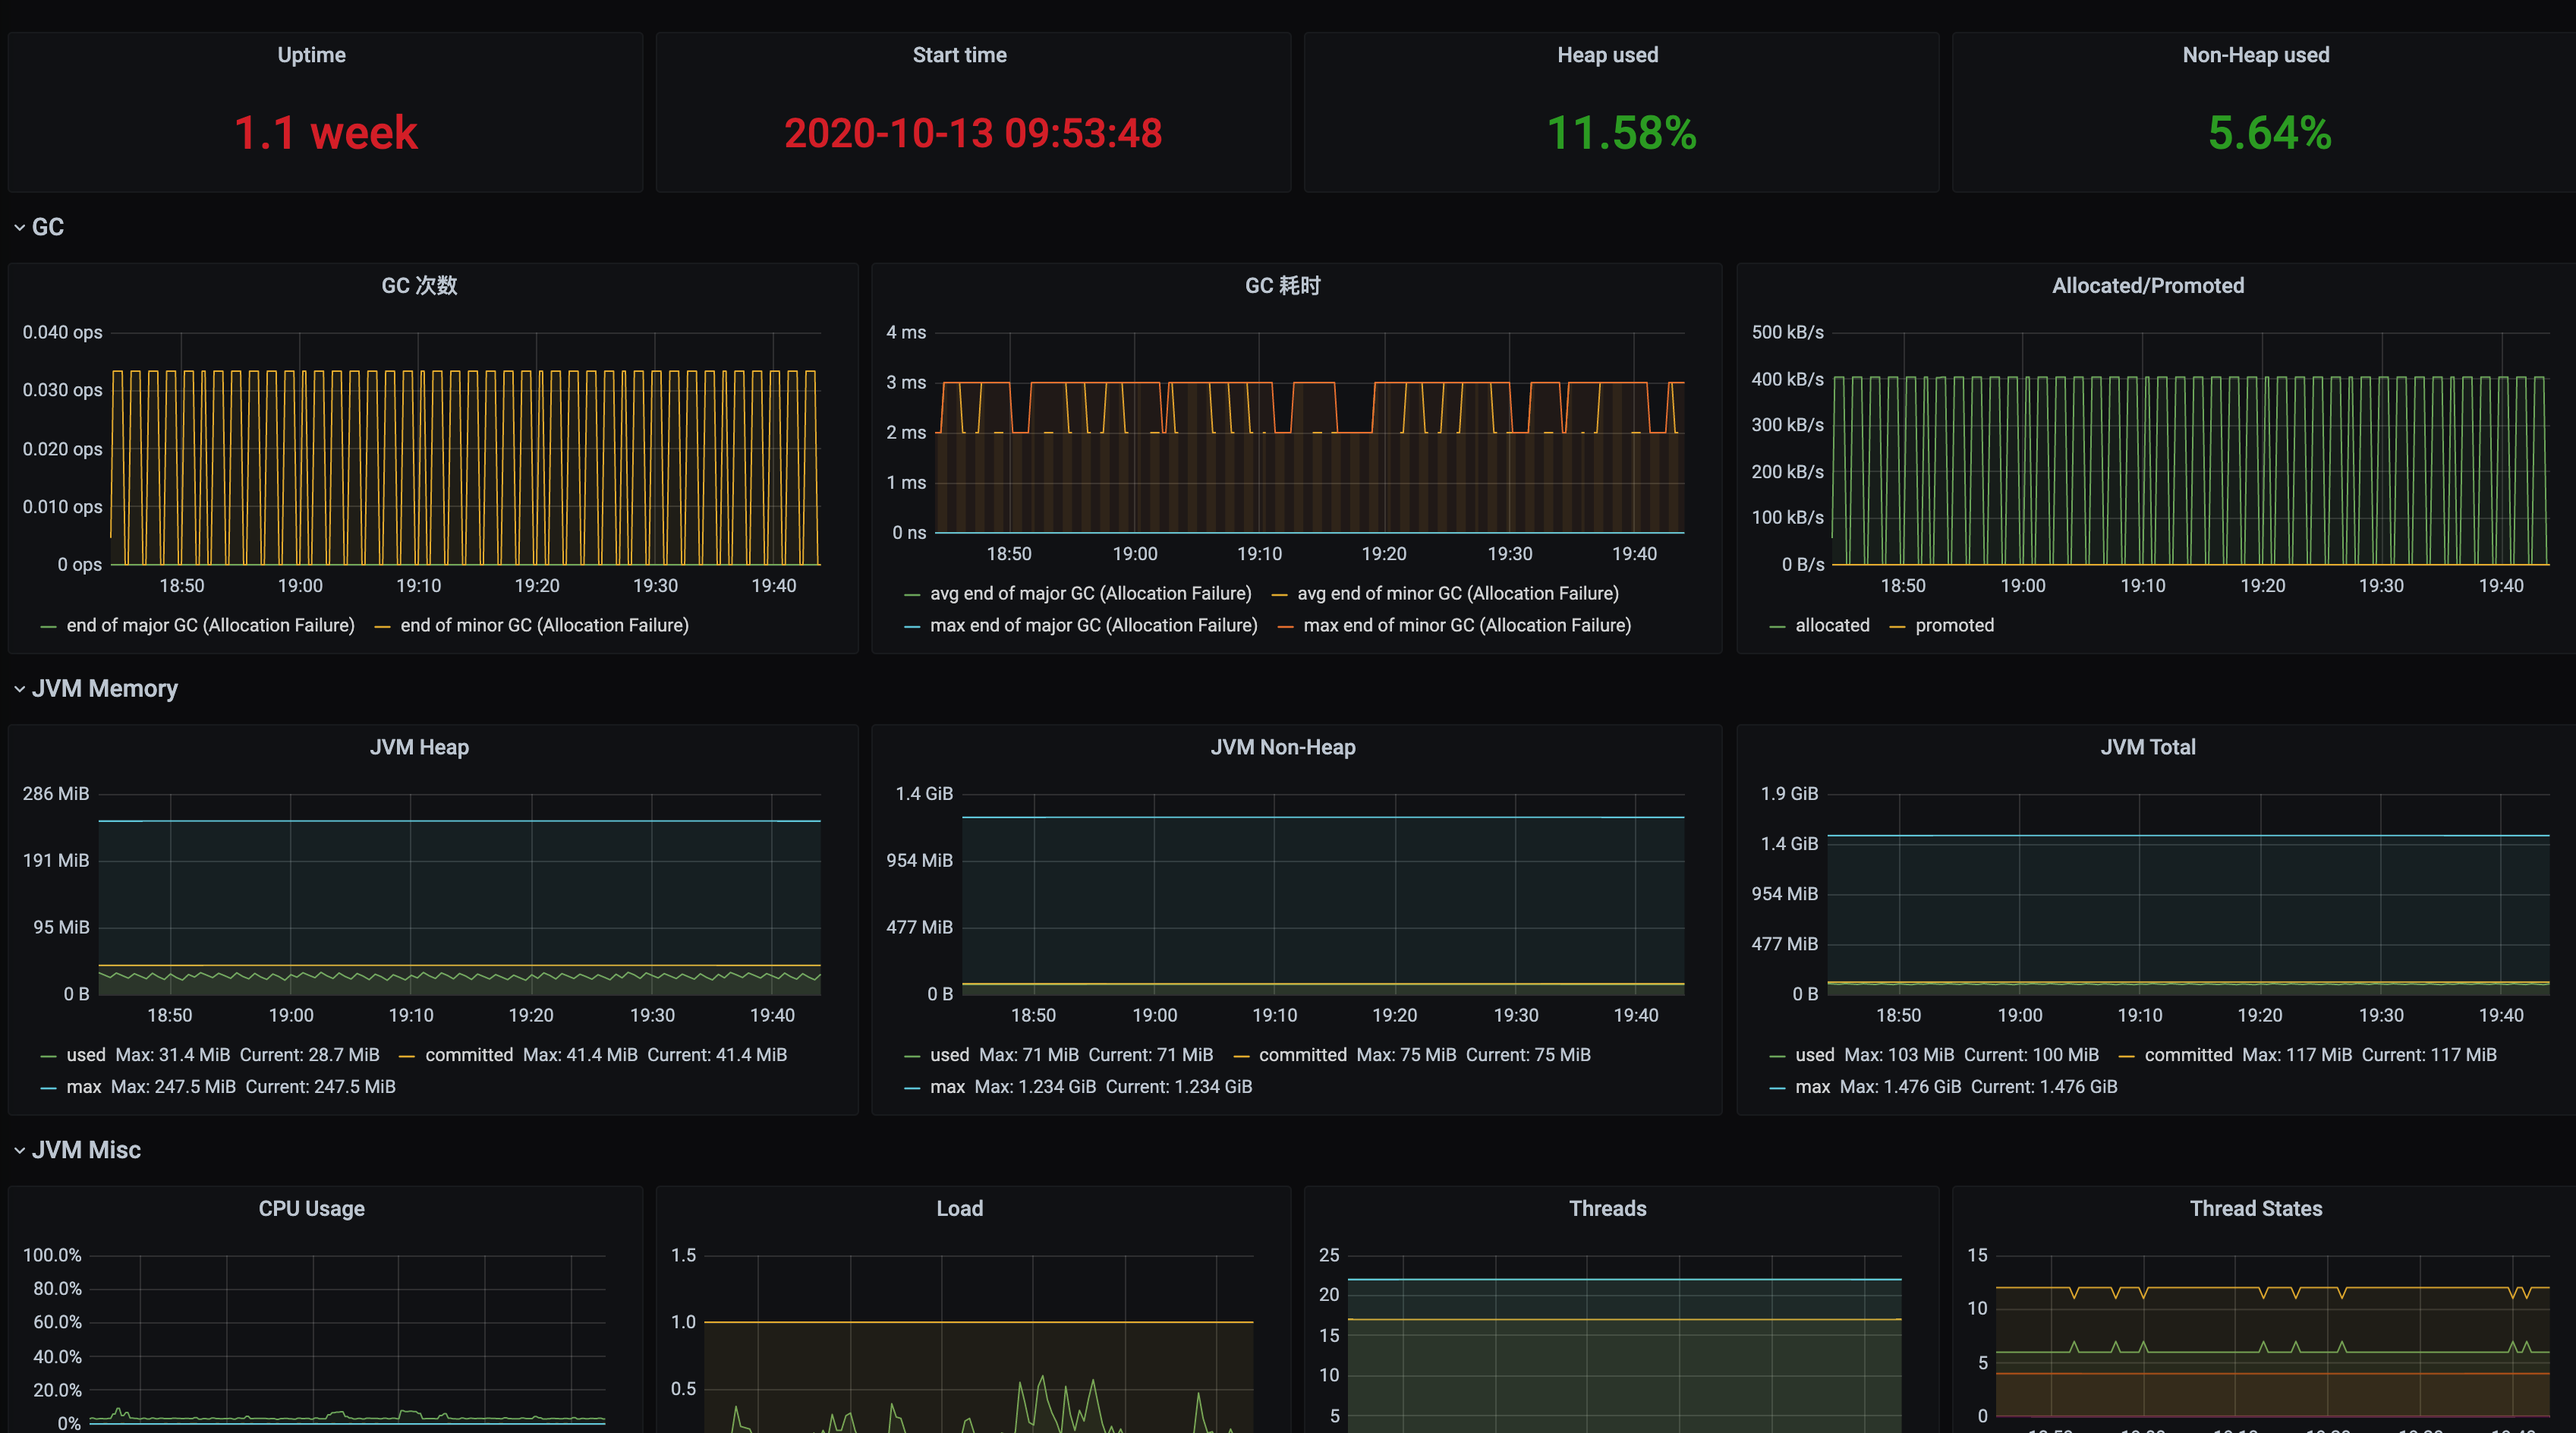
实例 JVM:单实例 JVM 详细的监控数据。
文档反馈