When using Memcached, you need to monitor its running status to know whether it runs normally and troubleshoot its faults. TMP provides an exporter to monitor Memcached and offers an out-of-the-box Grafana monitoring dashboard for it. This document describes how to use TMP to monitor Memcached.
2. In the instance list, select the corresponding TMP instance.
3. Enter the instance details page and click Integration Center.
4. Select Memcached in the Integration Center and click Install for integration.
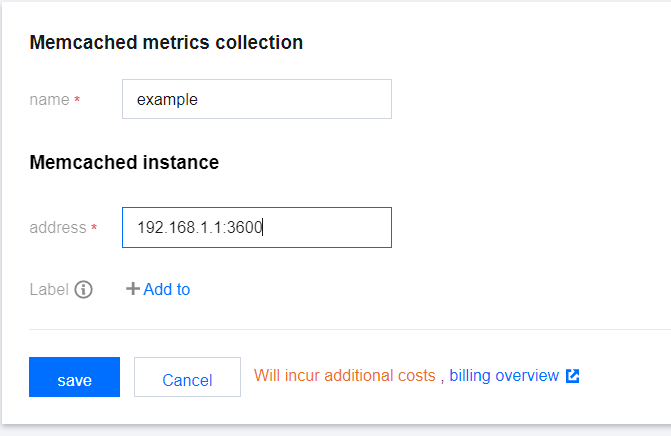
Configuration description
Item
Description
Name
Unique integration name
Address
Address and port of the Memcached instance to be collected
Label
Label with business meaning, which will be automatically added to Prometheus labels
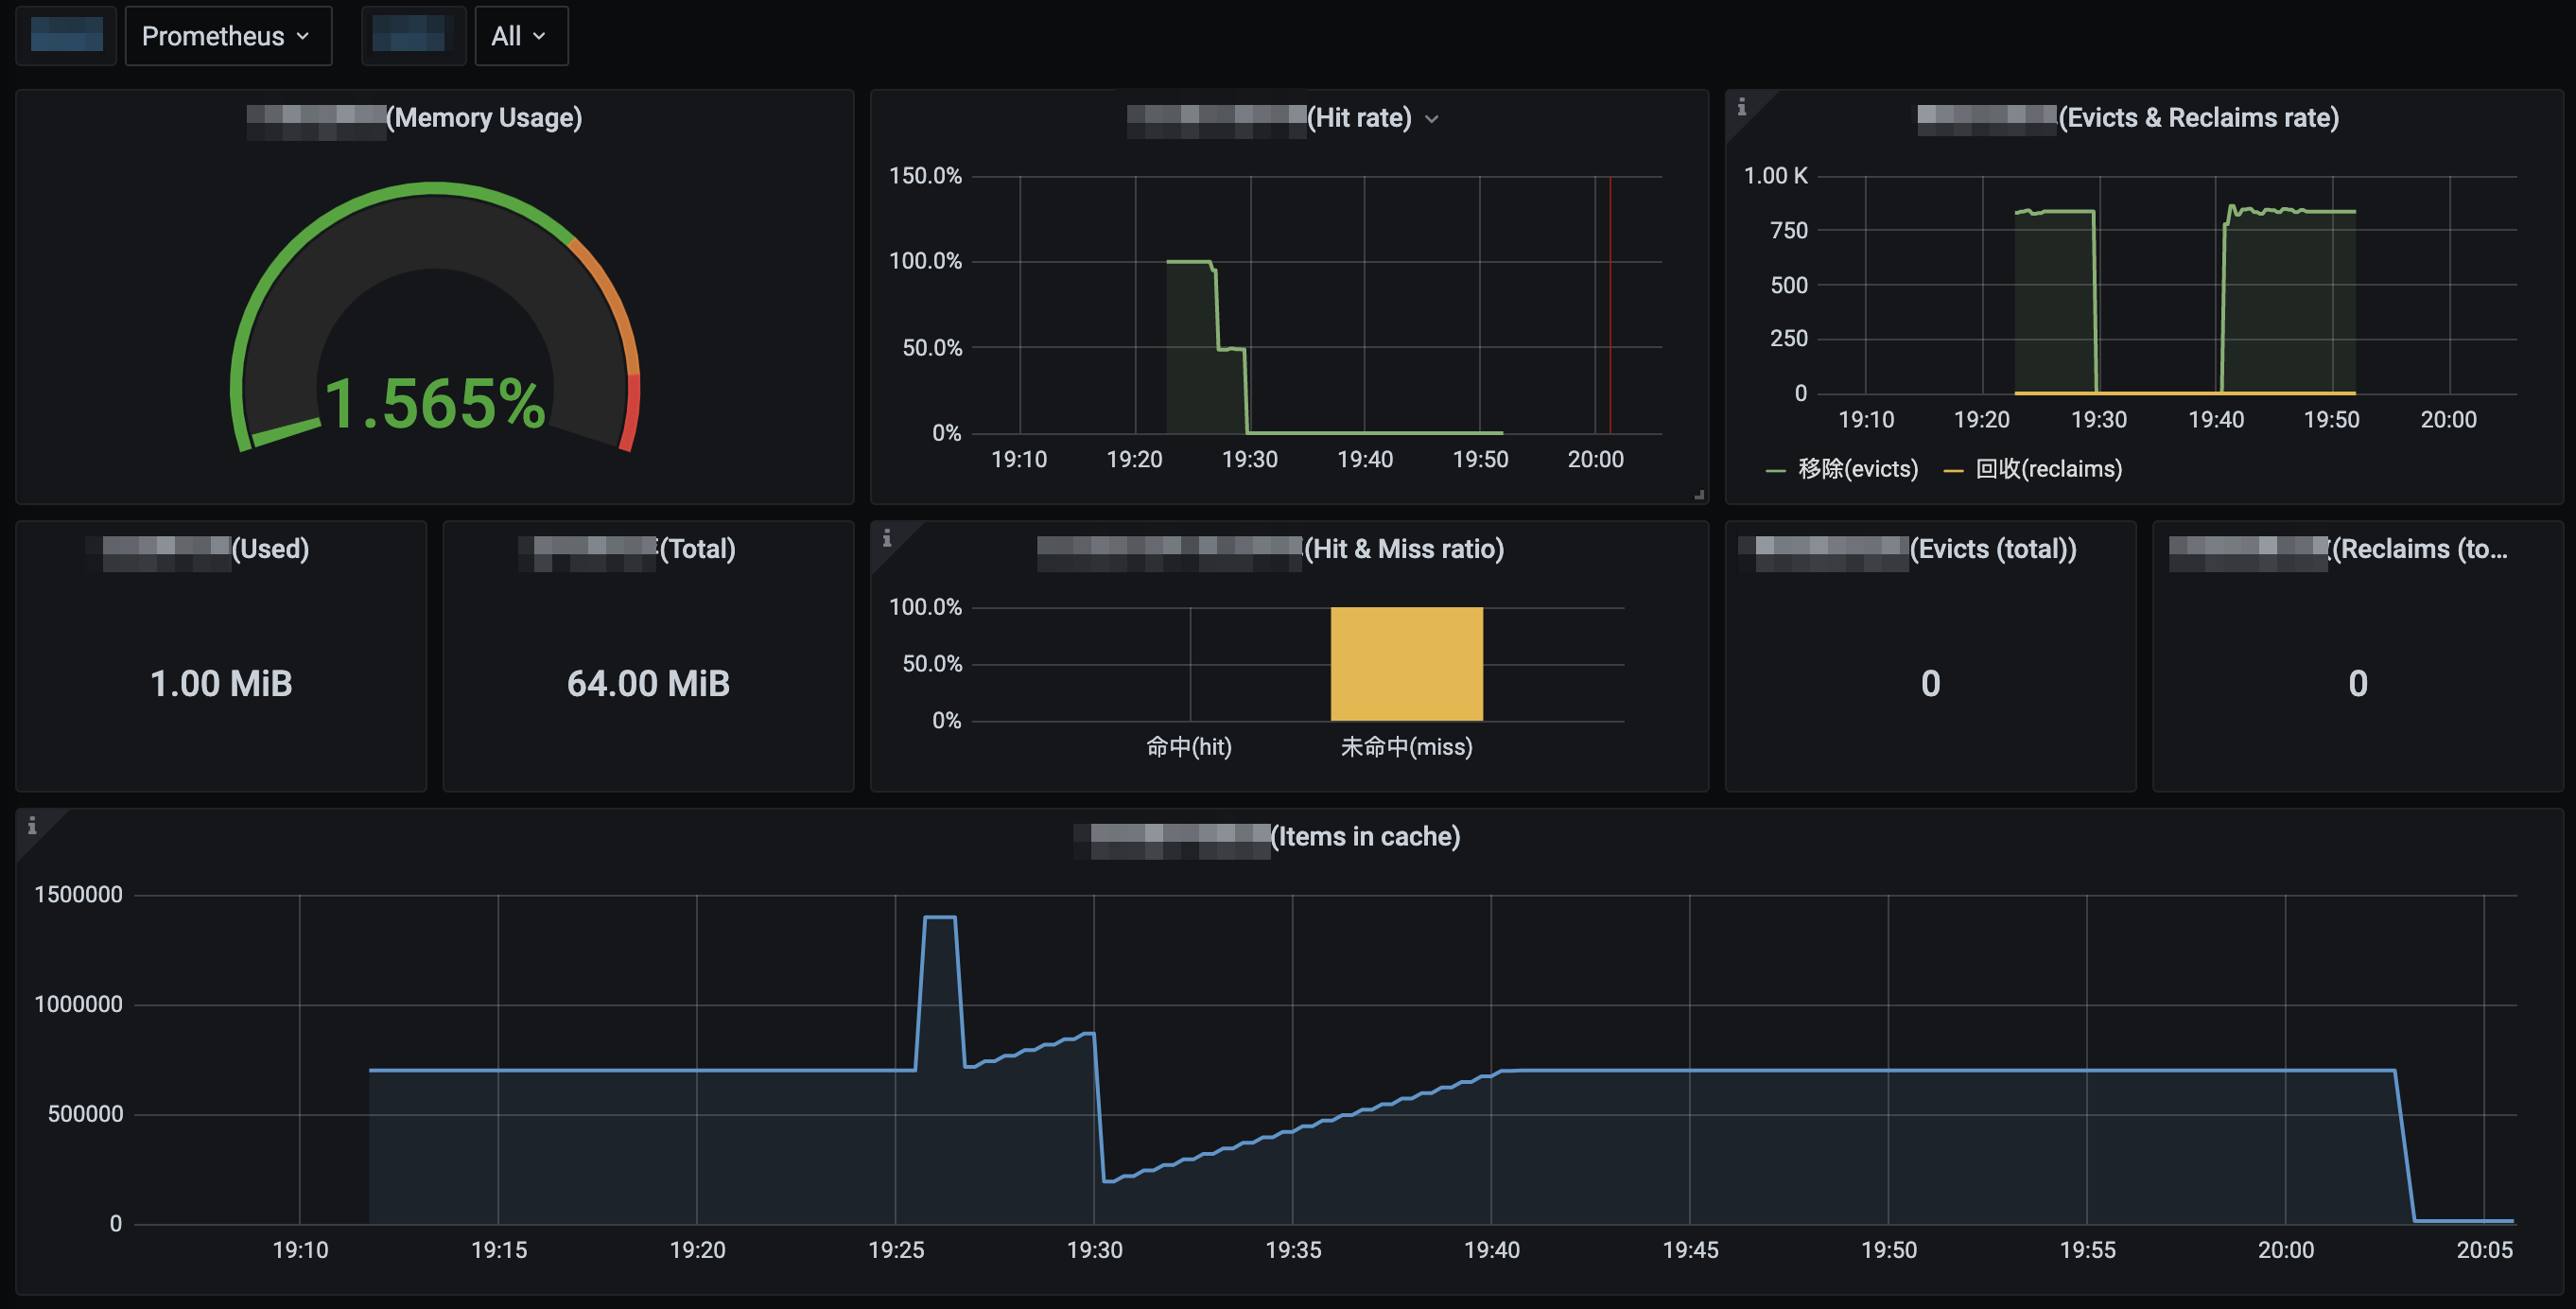
Viewing monitoring information
You can clearly view the following monitoring metrics on the monitoring dashboard:
1. Memory utilization. The used memory and total memory are also displayed.
2. Current hit rate of Get commands. The hit and miss rates of Get commands during the service operation are also displayed.
3. Old data eviction rate and expired data reclaim rate of Memcached. The total numbers of evictions and reclaims during the service operation are also displayed.
4. Total amount of data stored in Memcached.
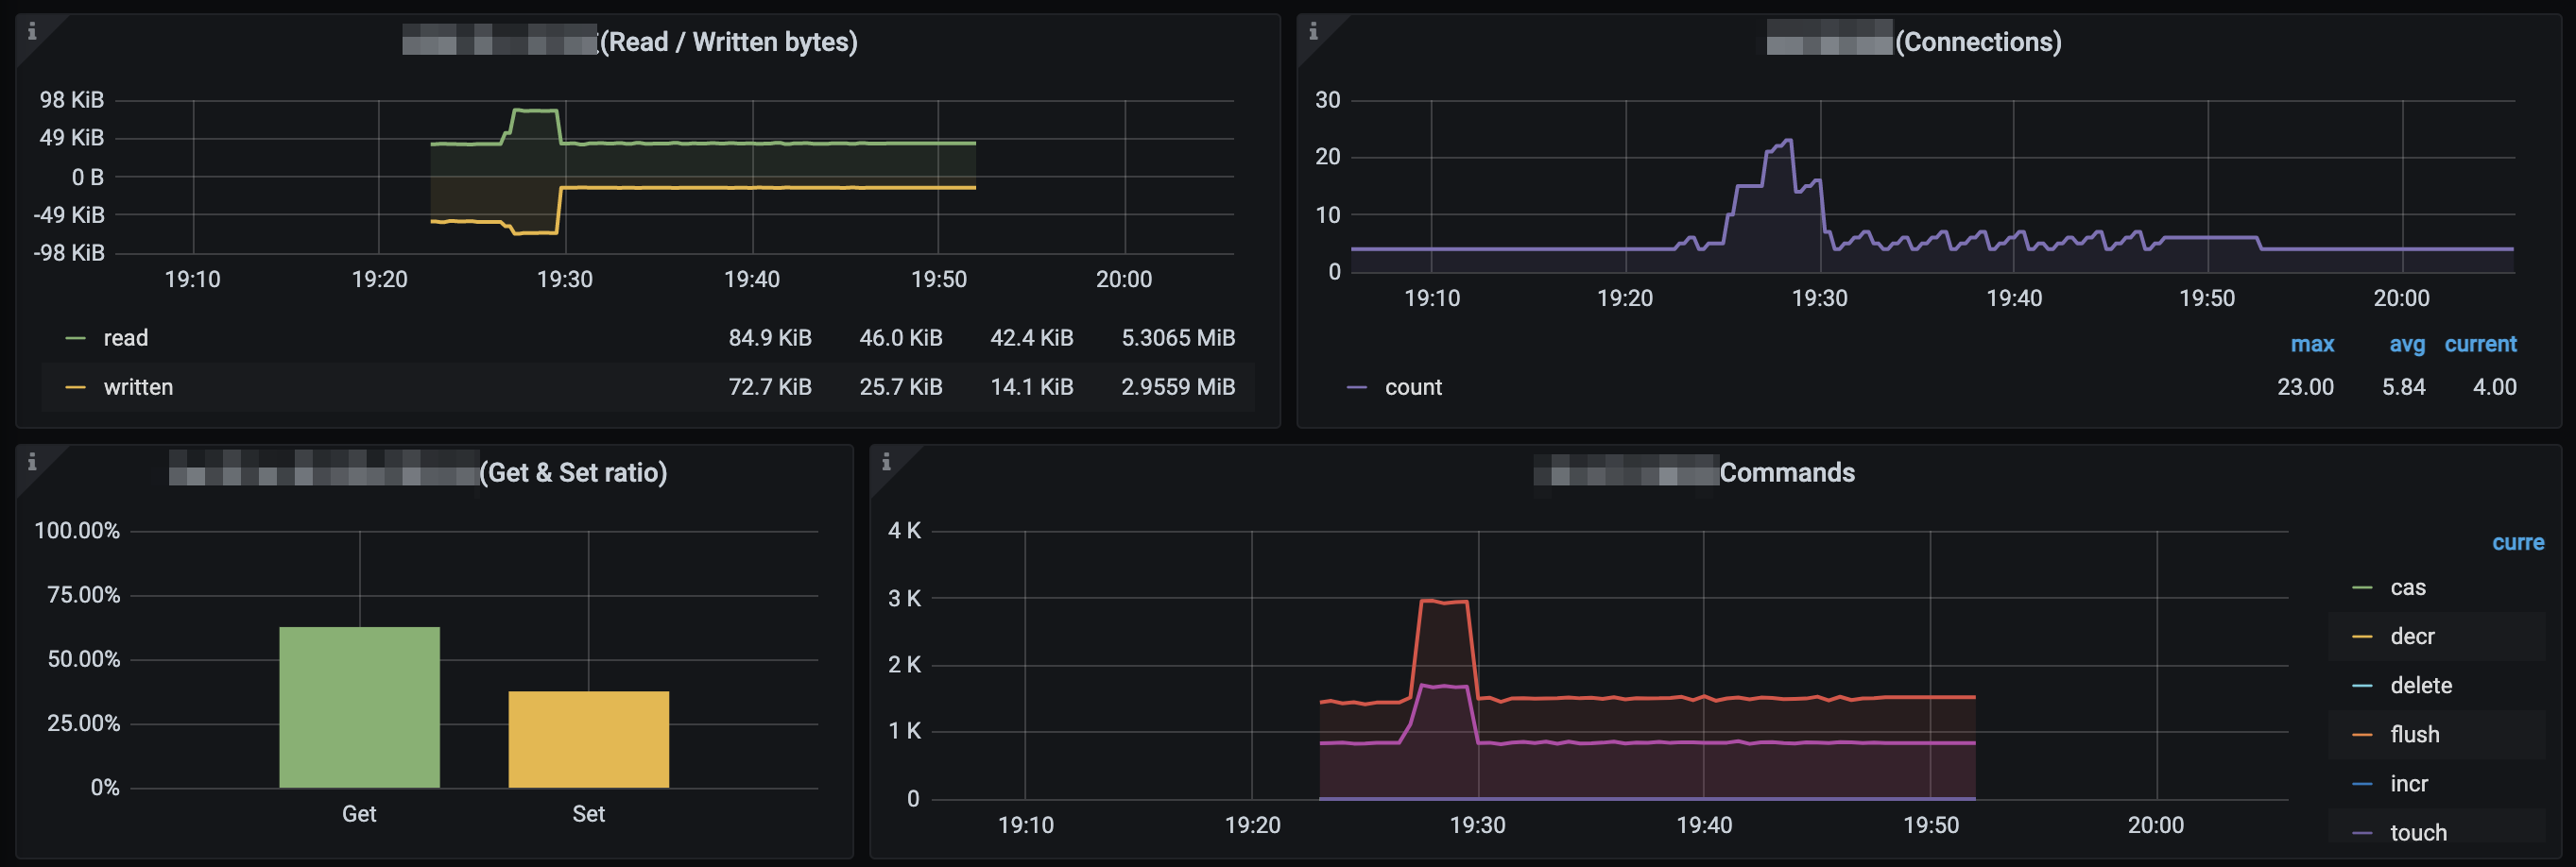
5. Number of bytes read from and written by the network.
6. Current number of open connections.
7. Ratio of Get and Set commands during the service operation.