Web Security Analysis
Last updated: 2025-08-25 17:44:18
Overview
Web security analysis provides fine-grained analysis tools for security events, offering reference for you to formulate or adjust security policies. You can not only view the statistical analysis and distribution trends of recent security events in dozens of dimensions, but also further understand the specific content and detailed information of an event by viewing sample logs. Web security analysis offers multiple analytical dimensions for request data under EdgeOne web protection, helping you develop efficient security policies.
Supported capabilities
Note:
1. In a security event, a single request may hit multiple security rules. When filtering or selecting statistical dimensions, please distinguish between the rule's disposal method and the request's disposal result. For example: A request hits multiple rules with the disposal method set to observe, and also hits a rule with the disposal method set to intercept, resulting in the final disposal result of the request being intercepted.
2. To optimize user experience, Sampling Statistics technology has been introduced in EdgeOne data analysis to ensure that the accuracy and timeliness of queries can be maintained even when large amounts of data are processed.

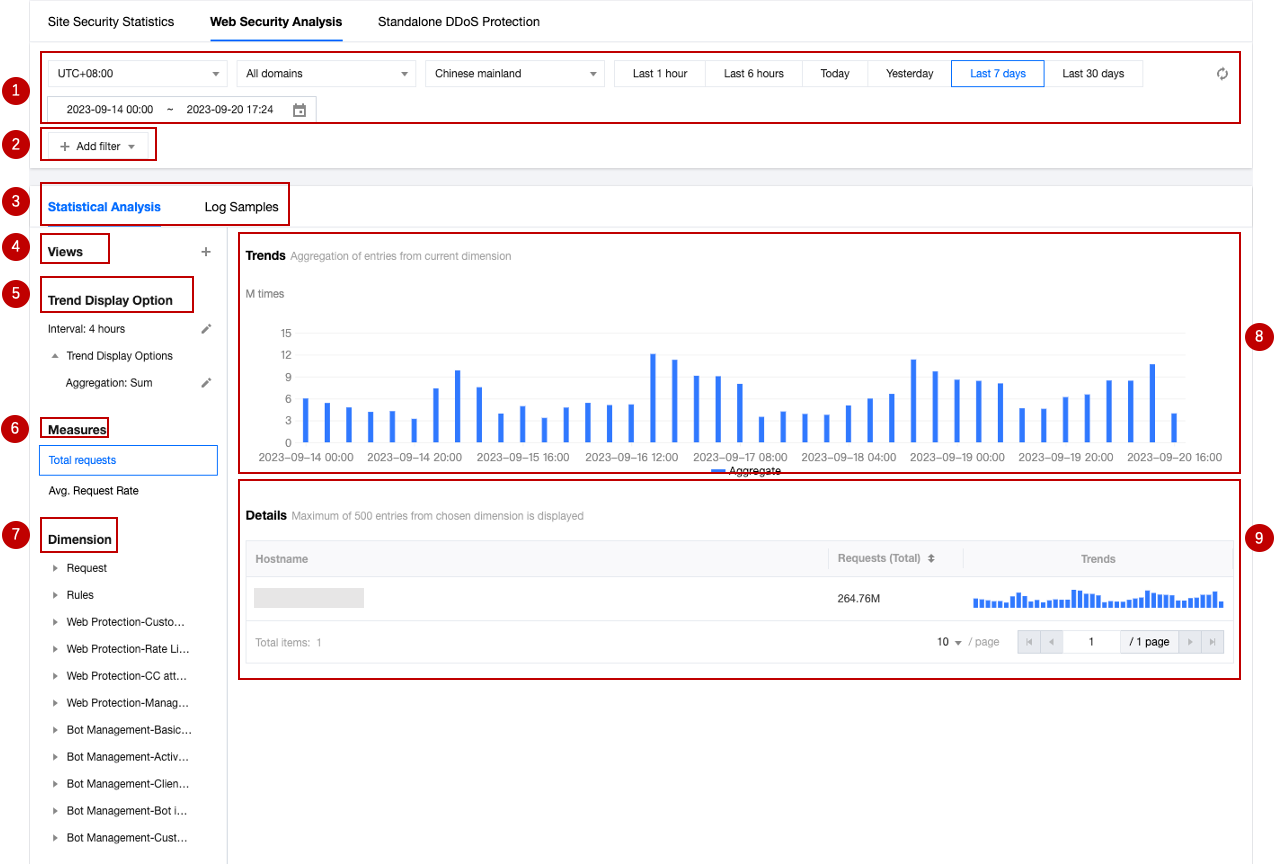
1. Data time range
Note:
For the query time range supported by different version plans, please refer to the Comparison of EdgeOne Plans.
2. Add filter
Supports filtering Web security data by request features, rule ID, and other dimensions. For the filter items supported by Web security analysis, please refer to How to use filter conditions.
Note:
1. A single request may hit multiple rules, so when using rule ID filtering, the statistical details and trend distribution of other rules hit simultaneously will be displayed.
2. You can click on the feature value you want to filter in the statistical details to quickly add it to the filter.
3. Analysis dimensions
Statistical analysis: Helps you display the ranking of indicators by the selected dimension, discover abnormal access volume and abnormal access trends. For example: When you choose to display by User-Agent header dimension, you can view the distribution of accessed devices and access indicator trends, thus identifying devices with abnormal access volume and suspicious access behavior with uniform speed cycle.
Log samples: Help you further view the details of security events and determine whether the security policy hit by the request meets expectations. For example: You can view the managed rules hit by the request and the field content matched by the managed rules through sample logs, which will help you determine whether it is a false intercept and adjust the security policy accordingly.
4. Common views
You can save the current view options as a common view for quick access later according to your needs. You can name the view, which will save the current trend display options, statistical indicators, and statistical dimension information.
5. Trend display statistical method
Note:
When adjusting the data filter time range, the data granularity will be adjusted accordingly to ensure an appropriate trend chart display.
You can adjust the trend chart display options as needed:
Data granularity: The data statistics duration corresponding to each column in the trend chart.
Aggregation method: The calculation method of the data corresponding to each column in the trend chart.
Sum: Displays the sum of all indicators of the statistical items in the selected dimension filtered data within that time period. For example: In the statistical period corresponding to a column in the trend chart, there are 6000 requests, and the column displays data as 6000.
Average value: Displays the average value of all indicators of the statistical items in the selected dimension filtered data within that time period. For example: When displaying statistical data by Host dimension, the data contains 5 Host data, and in the statistical period corresponding to a column in the trend chart, there are 6000 requests, then the column displays data as 6000 / 5 = 1200.
Maximum value: Displays the maximum data item within the time period after the data is split by the selected dimension.
99th percentile value: Displays the minimum value of the data items greater than 99% in the selected dimension split data within that time period, i.e., this value is greater than 99% of the other statistical item indicator values.
99.9th percentile value: Displays the minimum value of the data items greater than 99.9% in the selected dimension split data within that time period, i.e., this value is greater than 99.9% of the other statistical item indicator values.
6. Measures
You can choose to display the number of requests or the average request rate indicator to display the required statistical features (such as rate features or request number features).
Number of requests: Displays the total number of requests by the current statistical dimension, used to distinguish the characteristics of visitors with a large number of requests. For example: Analyzing by request Host dimension can distinguish the concentrated business domain names.
Average request rate: Calculates the average request rate by the current statistical dimension, used to distinguish the characteristics of visitors with high access frequency. For example: Analyzing by User-Agent header dimension can distinguish the device types with abnormal access frequency.
7. Statistical dimensions
Web security analysis provides the following analysis dimension categories, and you can adjust the statistical objects and grouping methods according to the selected dimensions:
Statistical dimensions classified by request attributes include:
Client IP: Counts the number of requests from different client IPs.
Client IP (XFF header priority): Counts the number of requests from different client IPs. If the client accesses through a Web proxy, the IP of the most recent hop in the XFF header will be counted.
User-Agent: Counts requests from different device types (distinguished by HTTP User-Agent header).
Request URL: Counts requests accessing different URLs (including access paths and query parameters).
Hostname: Counts requests accessing different domains (distinguished by HTTP header Hostname).
Request Referer: Counts requests accessing resources using different referencing methods (distinguished by HTTP Referer header).
Statistical dimensions classified by rule attributes include:
Category: Counts requests hitting different security modules (such as custom rules, managed rules, etc.).
Rule ID: Counts requests hitting different rules.
Note:
1. You can use the rule ID option in the rule classification to merge and display requests hitting all security protection rules.
2. You can also use the rule ID option in the specific security feature classification to view only the situation of hitting rules in that module. For example: Count requests by the rule ID of the Web Protection custom rules hit.
3. Different version plans support different statistical dimensions, please refer to the Comparison of EdgeOne Plans for details.
You can also choose other analysis options provided by the protection features, such as the hit field of managed rules, the bot label of bot intelligent analysis, etc., to perform statistical analysis.
8. Statistical trend chart
The statistical trend chart will display the corresponding aggregated data bar chart according to your trend display options and filter conditions.
9. Statistical details
Displays the request feature values of different dimensions and their corresponding indicators according to your statistical dimension and statistical indicator options. For example: When the number of
requests indicator and User-Agent analysis dimension are selected, the statistical details section will display the number of requests for different client device types (User-Agent header values), displayed in descending order of the number of requests, and the request trends of each device type.Analysis example
Scenario 1: Analyze the request trend of CC attack defense in the past 1 day
Scenario example
Suppose your site
example.com finds a suspicious surge in access volume, hitting the CC attack defense rule. To analyze whether all requests hitting CC attack defense in the past 1 day are normal requests, you can follow the steps below for analysis.Directions
1. Log in to the EdgeOne console, In the left menu bar, click Web Security Analysis.
2. Filter and view the domain name, time range, and aggregation conditions of the site to be analyzed. In this scenario, you can select the time range within the past 1 day.
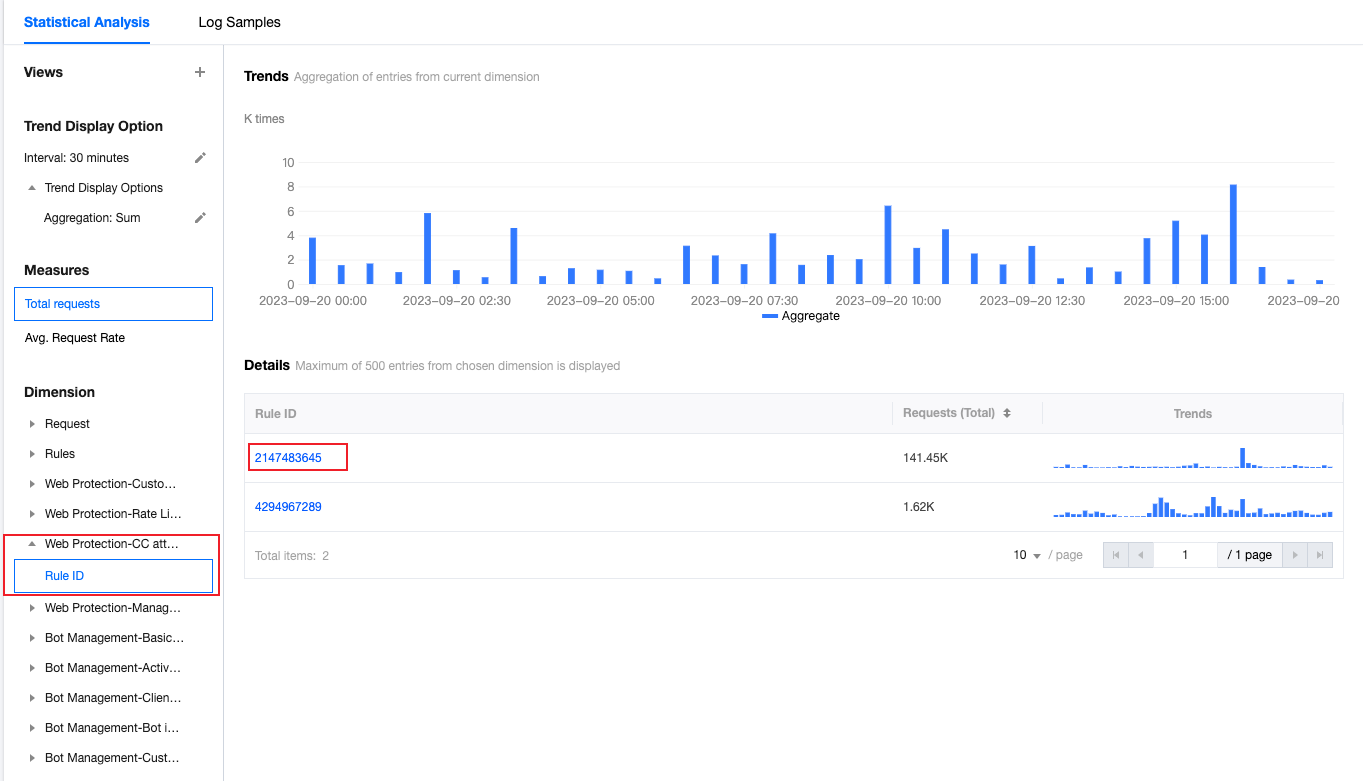
3. In the statistical analysis, click on Web Protection > CC Attack Defense > Rule ID.

4. View the data results. As shown in the figure above, the number of requests triggered by intelligent client filtering is very high (Rule ID: 4294967293). You can click on the rule ID to add it to the filter. Then click on Request > User Agent in the left statistical dimensions to view the summary information of all User Agent headers hitting the rule. You can judge whether the User Agent value meets your normal client expectations. You can also continue to add other statistical dimensions in the statistical dimensions, such as Client IP and Request URL, to further narrow down the filter range.
Scenario 2: Analyze whether there are abnormal requests in suspicious bot requests within the last 1 day
Scenario Example
Suppose your site
example.com has recently been frequently visited by suspicious bots, and you need to analyze whether all suspicious bot request accesses in the past 1 day are normal requests. You can refer to the following steps for analysis.Directions
1. Log in to EdgeOne console. In the left sidebar, click Web Security Analysis.
2. Filter and view the domain name, time range, and aggregation conditions of the site to be analyzed. In this scenario, you can select the time range within the past 1 day.
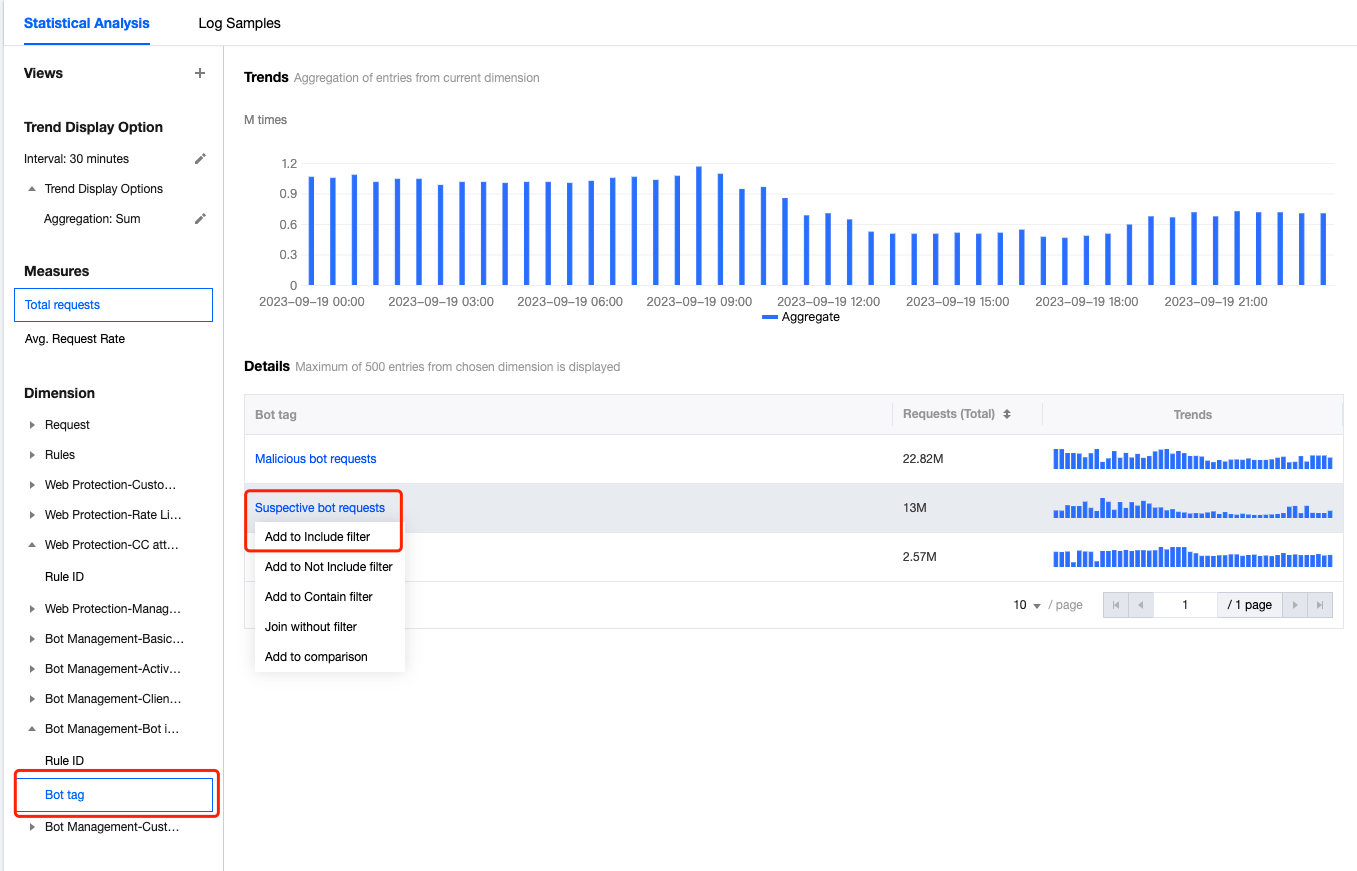
3. In the statistical analysis, click Bot Management > Bot Intelligent Analysis > Bot Tag.
4. Query the data results, and in the statistical details, you can see the request times of the corresponding bot tags. In this scenario, you can click Suspective Bot Requests > Add Equal Filter for further analysis. After adding the filter condition, you can also continue to add other statistical dimensions in the statistical dimension, such as User-Agent to further narrow the filter range.

5. Click Sample Log to switch to detailed sample log analysis. Click the arrow on the left side of each log to expand and view the detailed request header and hit rules situation to determine whether the request is a normal request.
Scenario 3: Locating and Analyzing Intercepted Requests Using Request ID
Scenario Example
Suppose users of your site example.com report encountering interception pages and provide the request ID displayed on the page. You need to quickly locate this request in Web Security Analytics, view its sample log details and matched rules to determine whether the interception is legitimate or a false positive. You can follow these steps for analysis.
Directions
1. Log in to EdgeOne console. In the left sidebar, click Web Security Analysis.
2. Filter the time range and available data zone for analysis. In this scenario, select the time range that includes the time shown on the interception page.
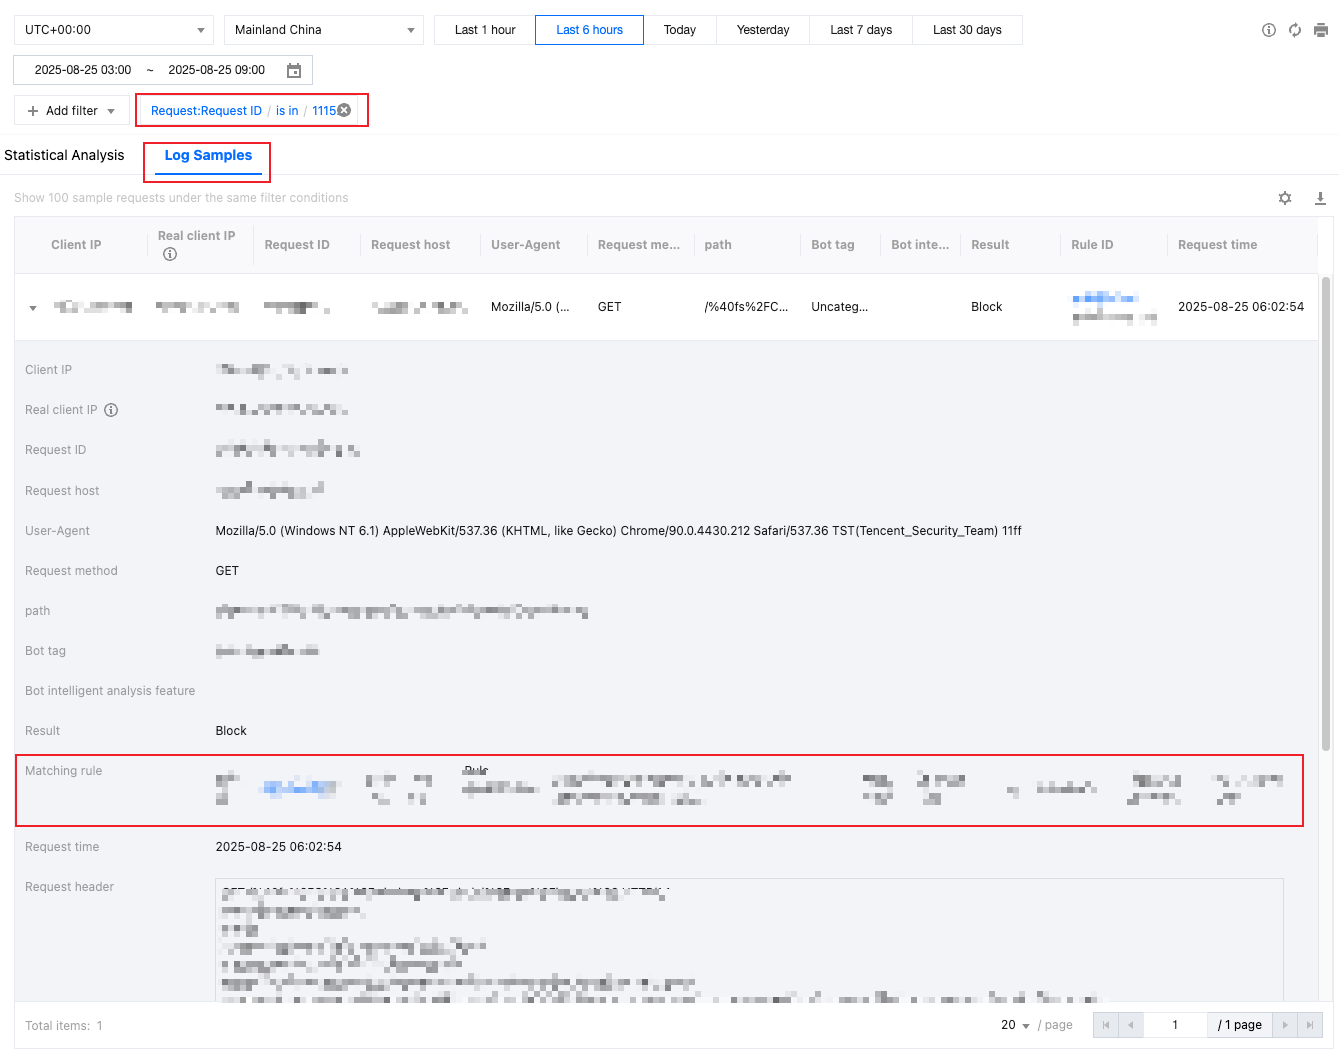
3. In the filter conditions, select Request ID, enter the request ID shown on the interception page, and click Confirm.

4. Click the Log Samples tab to view the log records matching this request ID.
5. In the sample logs list, click the arrow on the left side of the log to expand details and view complete request information, such as client IP, request method, request path, User-Agent, matched rule ID and action, rule type, and the original request header content.

6. Based on the matched rule type, match conditions, and action, combined with your site's business scenarios and normal access patterns, determine whether this interception is appropriate. If you confirm it's a false positive, you can make appropriate adjustments to the related protection rules while ensuring security, such as broadening match conditions or adding more precise conditions to limit the scope, adding exception rules, or adjusting rule priorities to reduce impact on normal access. For details, see Web Protection.
Was this page helpful?
You can also Contact Sales or Submit a Ticket for help.
Yes
No
Feedback

