- Release Notes
- Product Introduction
- Purchase Guide
- Getting Started
- Operation Guide
- Troubleshooting
- API Documentation
- History
- Introduction
- API Category
- Making API Requests
- Network Security APIs
- AddAndPublishNetworkFirewallPolicyDetail
- AddAndPublishNetworkFirewallPolicyYamlDetail
- AddNetworkFirewallPolicyDetail
- AddNetworkFirewallPolicyYamlDetail
- CheckNetworkFirewallPolicyYaml
- ConfirmNetworkFirewallPolicy
- CreateNetworkFirewallClusterRefresh
- CreateNetworkFirewallPolicyDiscover
- CreateNetworkFirewallPublish
- CreateNetworkFirewallUndoPublish
- DeleteNetworkFirewallPolicyDetail
- DescribeNetworkFirewallAuditRecord
- DescribeNetworkFirewallClusterList
- DescribeNetworkFirewallClusterRefreshStatus
- DescribeNetworkFirewallNamespaceLabelList
- DescribeNetworkFirewallPodLabelsList
- DescribeNetworkFirewallPolicyDetail
- DescribeNetworkFirewallPolicyDiscover
- DescribeNetworkFirewallPolicyList
- DescribeNetworkFirewallPolicyStatus
- DescribeNetworkFirewallPolicyYamlDetail
- UpdateAndPublishNetworkFirewallPolicyDetail
- UpdateAndPublishNetworkFirewallPolicyYamlDetail
- UpdateNetworkFirewallPolicyDetail
- UpdateNetworkFirewallPolicyYamlDetail
- Cluster Security APIs
- CreateCheckComponent
- CreateClusterCheckTask
- CreateRefreshTask
- DescribeAffectedClusterCount
- DescribeAffectedNodeList
- DescribeAffectedWorkloadList
- DescribeCheckItemList
- DescribeRefreshTask
- DescribeRiskList
- DescribeTaskResultSummary
- DescribeUnfinishRefreshTask
- DescribeUserCluster
- SetCheckMode
- DescribeClusterDetail
- DescribeClusterSummary
- Security Compliance APIs
- AddComplianceAssetPolicySetToWhitelist
- AddCompliancePolicyAssetSetToWhitelist
- AddCompliancePolicyItemToWhitelist
- CreateComplianceTask
- CreateExportComplianceStatusListJob
- DeleteComplianceAssetPolicySetFromWhitelist
- DeleteCompliancePolicyAssetSetFromWhitelist
- DeleteCompliancePolicyItemFromWhitelist
- DescribeComplianceAssetDetailInfo
- DescribeComplianceAssetList
- DescribeComplianceAssetPolicyItemList
- DescribeCompliancePeriodTaskList
- DescribeCompliancePolicyItemAffectedAssetList
- DescribeCompliancePolicyItemAffectedSummary
- DescribeComplianceScanFailedAssetList
- DescribeComplianceTaskAssetSummary
- DescribeComplianceTaskPolicyItemSummaryList
- DescribeComplianceWhitelistItemList
- InitializeUserComplianceEnvironment
- ModifyCompliancePeriodTask
- ScanComplianceAssets
- ScanComplianceAssetsByPolicyItem
- ScanCompliancePolicyItems
- ScanComplianceScanFailedAssets
- Runtime security - High-risk syscalls
- Runtime Security - Reverse Shell APIs
- Runtime Security APIs
- AddEditAbnormalProcessRule
- DescribeAssetImageBindRuleInfo
- AddEditAccessControlRule
- AddEditRiskSyscallWhiteList
- CreateDefenceVulExportJob
- CreateEmergencyVulExportJob
- CreateProcessEventsExportJob
- CreateRiskDnsEventExportJob
- CreateSystemVulExportJob
- CreateVulContainerExportJob
- CreateVulImageExportJob
- CreateVulScanTask
- CreateWebVulExportJob
- DeleteAbnormalProcessRules
- DeleteAccessControlRules
- DescribeAbnormalProcessEventTendency
- DescribeAbnormalProcessLevelSummary
- DescribeAbnormalProcessRuleDetail
- DescribeAbnormalProcessRules
- DescribeAccessControlRuleDetail
- DescribeAccessControlRules
- DescribeEmergencyVulList
- DescribeSupportDefenceVul
- DescribeVulContainerList
- DescribeVulDetail
- DescribeVulImageList
- DescribeVulScanInfo
- DescribeVulScanLocalImageList
- DescribeWebVulList
- ModifyAbnormalProcessRuleStatus
- ModifyAbnormalProcessStatus
- ModifyAccessControlRuleStatus
- ModifyAccessControlStatus
- OpenTcssTrial
- StopVulScanTask
- DescribeAccessControlEventsExport
- DescribeAbnormalProcessDetail
- DescribeAbnormalProcessEvents
- DescribeAccessControlDetail
- DescribeAccessControlEvents
- DescribeRiskSyscallDetail
- Alert Settings APIs
- Advanced prevention - K8s API abnormal requests
- CreateAccessControlsRuleExportJob
- CreateK8sApiAbnormalEventExportJob
- CreateK8sApiAbnormalRuleExportJob
- CreateK8sApiAbnormalRuleInfo
- DeleteK8sApiAbnormalRule
- DescribeAssetClusterList
- DescribeK8sApiAbnormalEventInfo
- DescribeK8sApiAbnormalEventList
- DescribeK8sApiAbnormalRuleInfo
- DescribeK8sApiAbnormalRuleList
- DescribeK8sApiAbnormalRuleScopeList
- DescribeK8sApiAbnormalSummary
- DescribeK8sApiAbnormalTendency
- ModifyK8sApiAbnormalEventStatus
- ModifyK8sApiAbnormalRuleInfo
- ModifyK8sApiAbnormalRuleStatus
- Asset Management APIs
- CreateAssetImageScanSetting
- CreateAssetImageVirusExportJob
- CreateHostExportJob
- DeleteMachine
- DescribeABTestConfig
- DescribeAgentDaemonSetCmd
- DescribeAgentInstallCommand
- DescribeAssetSyncLastTime
- DescribeExportJobDownloadURL
- DescribeExportJobManageList
- DescribeInspectionReport
- DescribePromotionActivity
- DescribeTcssSummary
- DescribeUnauthorizedCoresTendency
- ModifyContainerNetStatus
- Security Operations - Log Analysis APIs
- CreateSearchTemplate
- DeleteSearchTemplate
- DescribeESAggregations
- DescribeESHits
- DescribeIndexList
- DescribeLogStorageStatistic
- DescribePublicKey
- DescribeSearchExportList
- DescribeSearchLogs
- DescribeSearchTemplates
- DescribeSecLogAlertMsg
- DescribeSecLogCleanSettingInfo
- DescribeSecLogDeliveryClsOptions
- DescribeSecLogDeliveryClsSetting
- DescribeSecLogDeliveryKafkaOptions
- DescribeSecLogDeliveryKafkaSetting
- DescribeSecLogJoinTypeList
- DescribeSecLogKafkaUIN
- ModifySecLogCleanSettingInfo
- ModifySecLogDeliveryClsSetting
- ModifySecLogDeliveryKafkaSetting
- ModifySecLogJoinState
- ModifySecLogKafkaUIN
- ResetSecLogTopicConfig
- DescribeSecLogJoinObjectList
- ModifySecLogJoinObjects
- Runtime Security - Trojan Call APIs
- CreateVirusScanAgain
- DescribeExportJobResult
- DescribeVirusAutoIsolateSampleDetail
- DescribeVirusAutoIsolateSampleDownloadURL
- DescribeVirusAutoIsolateSampleList
- DescribeVirusAutoIsolateSetting
- DescribeVirusEventTendency
- DescribeVirusManualScanEstimateTimeout
- DescribeVirusSampleDownloadUrl
- DescribeVirusScanTaskStatus
- DescribeVirusScanTimeoutSetting
- DescribeVirusSummary
- ExportVirusList
- ModifyVirusAutoIsolateExampleSwitch
- ModifyVirusAutoIsolateSetting
- ModifyVirusFileStatus
- ModifyVirusScanTimeoutSetting
- StopVirusScanTask
- DescribeVirusMonitorSetting
- DescribeVirusScanSetting
- ModifyVirusMonitorSetting
- ModifyVirusScanSetting
- DescribeVirusList
- DescribeVirusTaskList
- CreateVirusScanTask
- DescribeVirusDetail
- Runtime Security - Container Escape APIs
- DeleteEscapeWhiteList
- CreateEscapeWhiteListExportJob
- CreateEscapeEventsExportJob
- AddEscapeWhiteList
- DescribeEscapeEventTendency
- DescribeEscapeRuleInfo
- DescribeEscapeSafeState
- DescribeEscapeWhiteList
- DescribeEscapeEventTypeSummary
- ModifyEscapeEventStatus
- ModifyEscapeRule
- ModifyEscapeWhiteList
- DescribeEscapeEventDetail
- DescribeEscapeEventInfo
- Image Security APIs
- AddAssetImageRegistryRegistryDetail
- AddEditImageAutoAuthorizedRule
- AddIgnoreVul
- CheckRepeatAssetImageRegistry
- CreateAssetImageRegistryScanTask
- CreateAssetImageRegistryScanTaskOneKey
- CreateAssetImageScanTask
- CreateComponentExportJob
- CreateImageExportJob
- CreateOrModifyPostPayCores
- CreateVulDefenceEventExportJob
- CreateVulDefenceHostExportJob
- CreateVulExportJob
- DeleteIgnoreVul
- DescribeAssetAppServiceList
- DescribeAssetComponentList
- DescribeAssetDBServiceList
- DescribeAssetHostList
- DescribeAssetImageDetail
- DescribeAssetImageHostList
- DescribeAssetImageList
- DescribeAssetImageRegistryAssetStatus
- DescribeAssetImageRegistryDetail
- DescribeAssetImageRegistryList
- DescribeAssetImageRegistryListExport
- DescribeAssetImageRegistryRegistryDetail
- DescribeAssetImageRegistryRegistryList
- DescribeAssetImageRegistryRiskInfoList
- DescribeAssetImageRegistryRiskListExport
- DescribeAssetImageRegistryScanStatusOneKey
- DescribeAssetImageRegistrySummary
- DescribeAssetImageRegistryVirusList
- DescribeAssetImageRegistryVirusListExport
- DescribeAssetImageRegistryVulList
- DescribeAssetImageRegistryVulListExport
- DescribeAssetImageRiskList
- DescribeAssetImageRiskListExport
- DescribeAssetImageScanSetting
- DescribeAssetImageScanStatus
- DescribeAssetImageScanTask
- DescribeAssetImageSimpleList
- DescribeAssetImageVirusList
- DescribeAssetImageVirusListExport
- DescribeAssetImageVulList
- DescribeAssetImageVulListExport
- DescribeAssetPortList
- DescribeAssetProcessList
- DescribeAssetWebServiceList
- DescribeAutoAuthorizedRuleHost
- DescribeContainerSecEventSummary
- DescribeImageAutoAuthorizedLogList
- DescribeImageAutoAuthorizedRule
- DescribeImageAutoAuthorizedTaskList
- DescribeImageComponentList
- DescribeImageRegistryNamespaceList
- DescribeImageRegistryTimingScanTask
- DescribeImageRiskSummary
- DescribeImageRiskTendency
- DescribeImageSimpleList
- DescribeNewestVul
- DescribePostPayDetail
- DescribeScanIgnoreVulList
- DescribeSecEventsTendency
- DescribeSystemVulList
- DescribeValueAddedSrvInfo
- DescribeVulDefenceEventTendency
- DescribeVulIgnoreLocalImageList
- DescribeVulIgnoreRegistryImageList
- DescribeVulImageSummary
- DescribeVulLevelImageSummary
- DescribeVulLevelSummary
- DescribeVulRegistryImageList
- DescribeVulScanAuthorizedImageSummary
- DescribeVulTendency
- DescribeVulTopRanking
- ModifyAsset
- ModifyAssetImageRegistryScanStop
- ModifyAssetImageRegistryScanStopOneKey
- ModifyAssetImageScanStop
- ModifyImageAuthorized
- ModifyVulDefenceEventStatus
- RemoveAssetImageRegistryRegistryDetail
- RenewImageAuthorizeState
- SwitchImageAutoAuthorizedRule
- SyncAssetImageRegistryAsset
- UpdateAssetImageRegistryRegistryDetail
- UpdateImageRegistryTimingScanTask
- DescribeAssetHostDetail
- DescribeAssetSummary
- DescribeContainerAssetSummary
- DescribeVulDefenceEventDetail
- DescribeVulSummary
- ModifyVulDefenceSetting
- DescribeAssetContainerDetail
- DescribeAssetContainerList
- DescribeVulDefenceEvent
- DescribeVulDefenceHost
- DescribeVulDefencePlugin
- DescribeVulDefenceSetting
- Billing APIs
- Data Types
- Error Codes
- FAQs
- TCSS Policy
- Contact Us
- Glossary
Supports real-time monitoring of exceptional request behaviors of cluster APIs, and includes system policies and user-defined rules.
System Policy: Based on Tencent Cloud's security technology and multi-dimensional methods, it monitors exceptional request behaviors of cluster APIs through nine types of rules, including anonymous access, exceptional UA requests, anonymous permission change, credential acquisition, sensitive path mounts, command execution, exceptional scheduled task, static pod creation, and suspicious containers creation.
User-defined Rules: Supports custom exceptional request fields and specific effective ranges of K8s APIs, making it more flexible to meet actual business needs.
Event List
Log in to the TCSS console. In the left sidebar, click Advanced Prevention > Abnormal K8s API requests, and by default, you will enter the event list page.
Security Status and Events Trend
For the security status, the pending exceptional request events of K8s APIs and the number of security events counted by high, medium, low, and note risks will be collected according to the security events reported by the system.
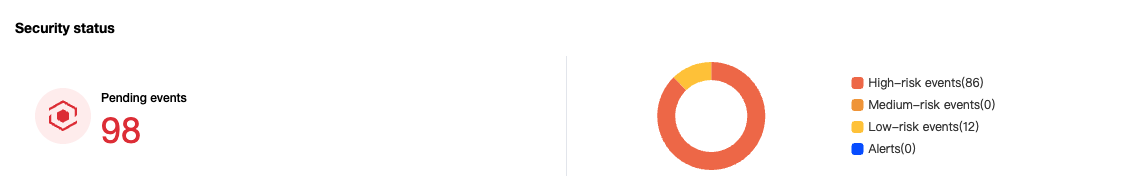
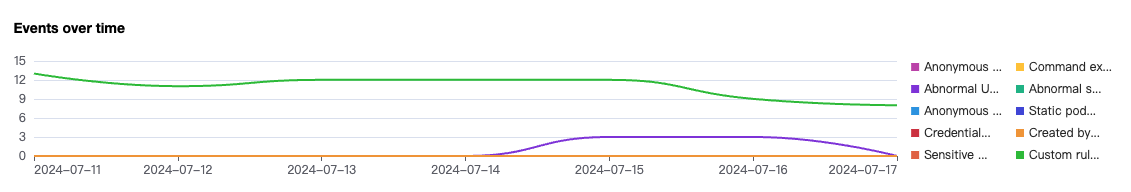
For the events trend, the security events trend over the past seven days will be collected based on the hit system rules and custom rules according to the security events reported by the system.
Event List
You can select the Last Occurred to view security events, or retrieve related events by cluster name or cluster ID. The fields in the event list include:
Field Name | Field Details |
Hit Rules | Nine system rules and user-defined rules, including anonymous access, exceptional UA requests, anonymous permission change, credential acquisition, sensitive path mounts, command execution, exceptional scheduled task, static pod creation, and suspicious containers creation. |
Rule Type | System rules, and user-defined rules |
Threat Level | High, medium, low, and note |
Cluster Name/ID/Running Status | Display the cluster name, cluster ID, and cluster running status impacted by the security events. |
First Occurred | The time when this security event first occurred. |
Last Occurred | The time when this security event most recently occurred. |
Alarms | The system aggregates pending security events by cluster name, cluster ID, hit rules, and request logs. And the system displays them with an aggregation cycle of every day. |
Status | Pending, processed, ignored, and allowlisted |
Operation | Click details to view event details. |
Viewing Details
In the event list, click details to view event details. Details include event details, cluster name/ID, cluster runtime components, risk description, recommended solution, exceptional request information, and JSON logs.
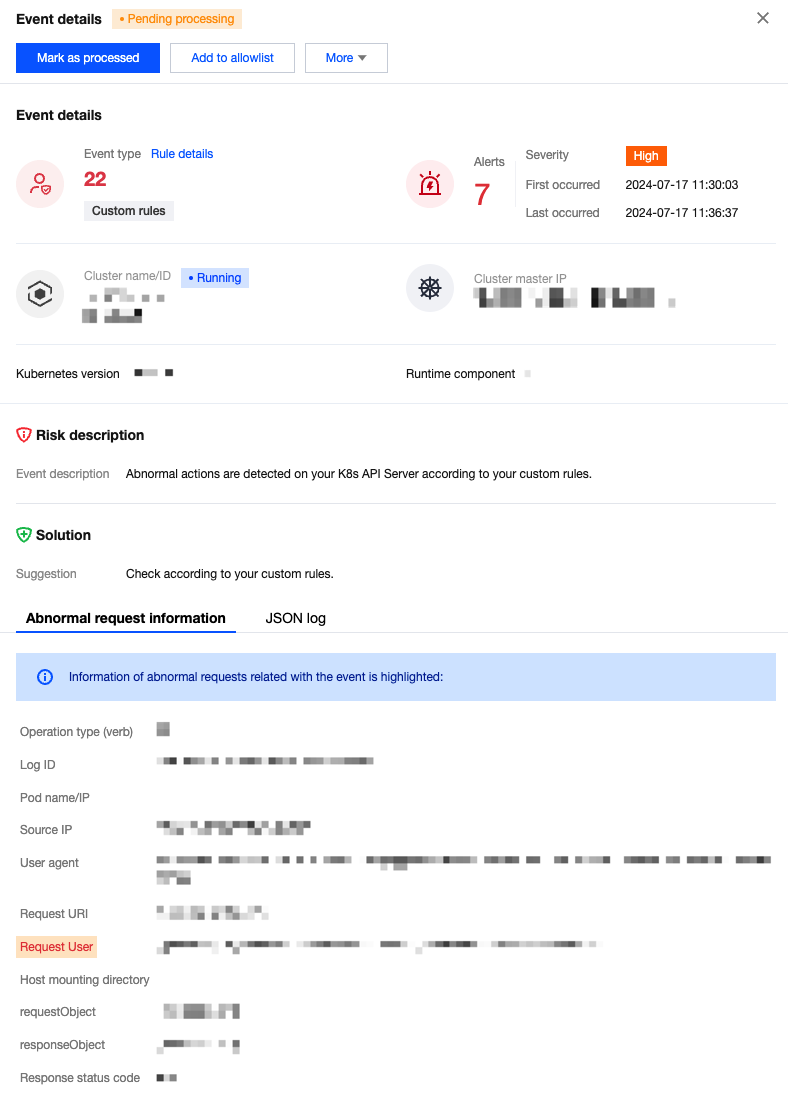
Processing the Event
1. In the event list, click Process. You can select to mark the event as processed, add it to the allowlist, ignore it, or delete the records. Click Confirm.
2. In the secondary confirmation window, perform the following actions:
Mark as processed: It is recommended to process the event risk by following the solutions in the event details, and click OK. After processing, you can mark the event as processed.
Add to the allowlist: Configure relevant parameters, and click OK.
Note:
If you confirm that the K8s APIs request is a normal behavior, you can add it to the allowlist allow rules. Subsequent occurrences of this request will then be allowed to pass through without triggering alarms. Proceed with caution.
When users add to the allowlist, the system will automatically fill in the fields that trigger alarms and the cluster based on the source event. If needed, you can manually adjust the effective fields and effective cluster range of the allowlist.
Ignore: Click OK to ignore only the selected events. Alarms will still be triggered if the same events occur again.
Delete log: Click OK, the selected event record will be deleted. It will no longer be displayed in the console, and cannot be recovered. Proceed with caution.
Rule Configuration
Log in to the TCSS console. In the left sidebar, click Advanced Prevention > Abnormal K8s API Requests > Rule configuration to enter the rule configuration page.
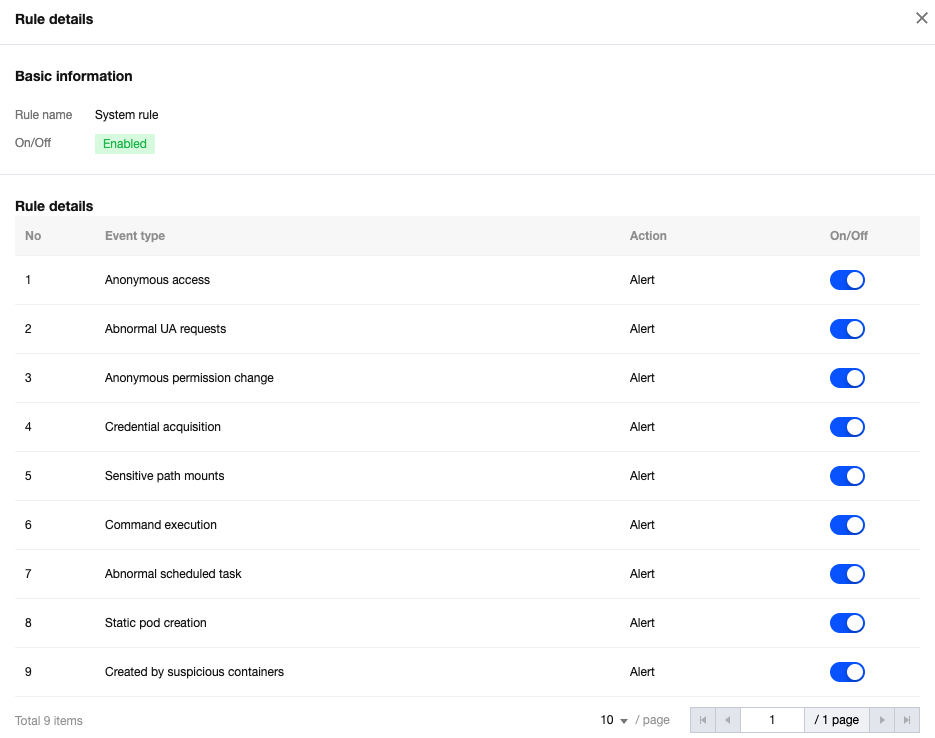
System Rules
On the rule configuration page, enable or disable system rules and custom rules. Click Rule name to view all types of system rules, as shown in the figure below. Users can also disable certain types of system rules through this page.
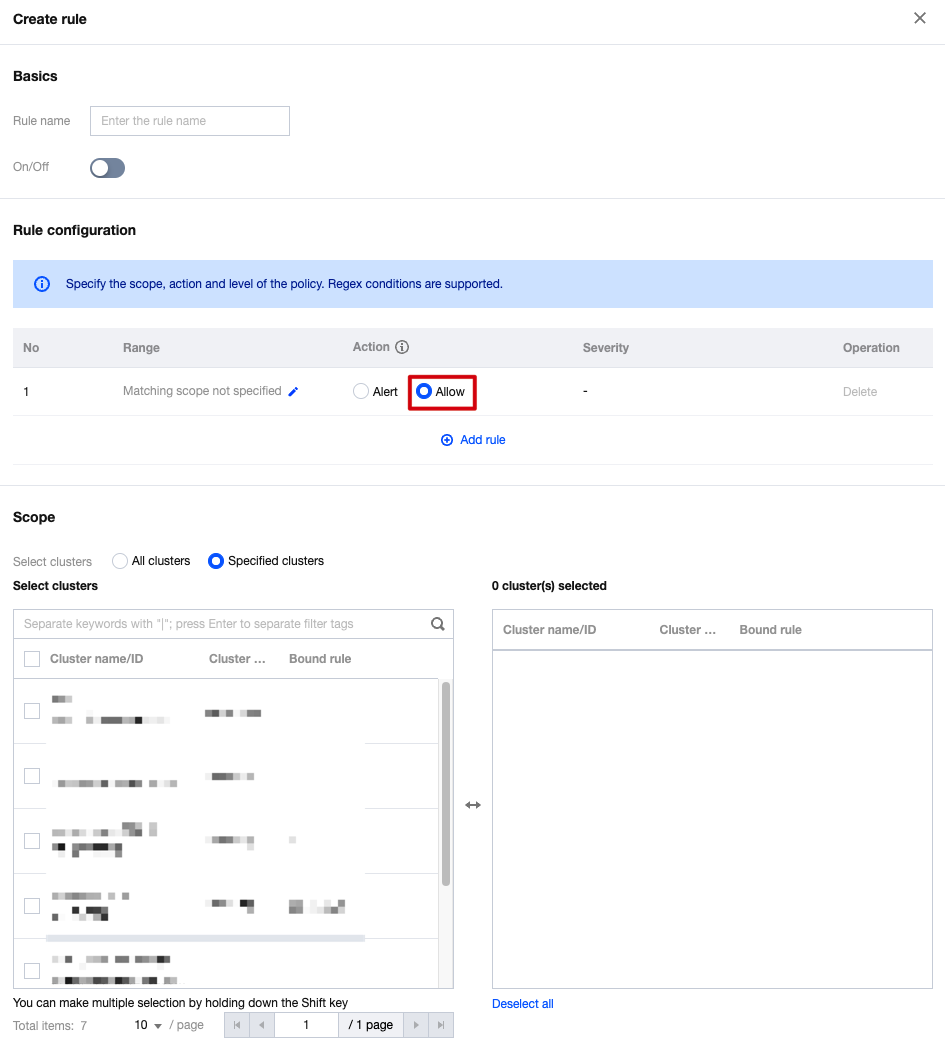
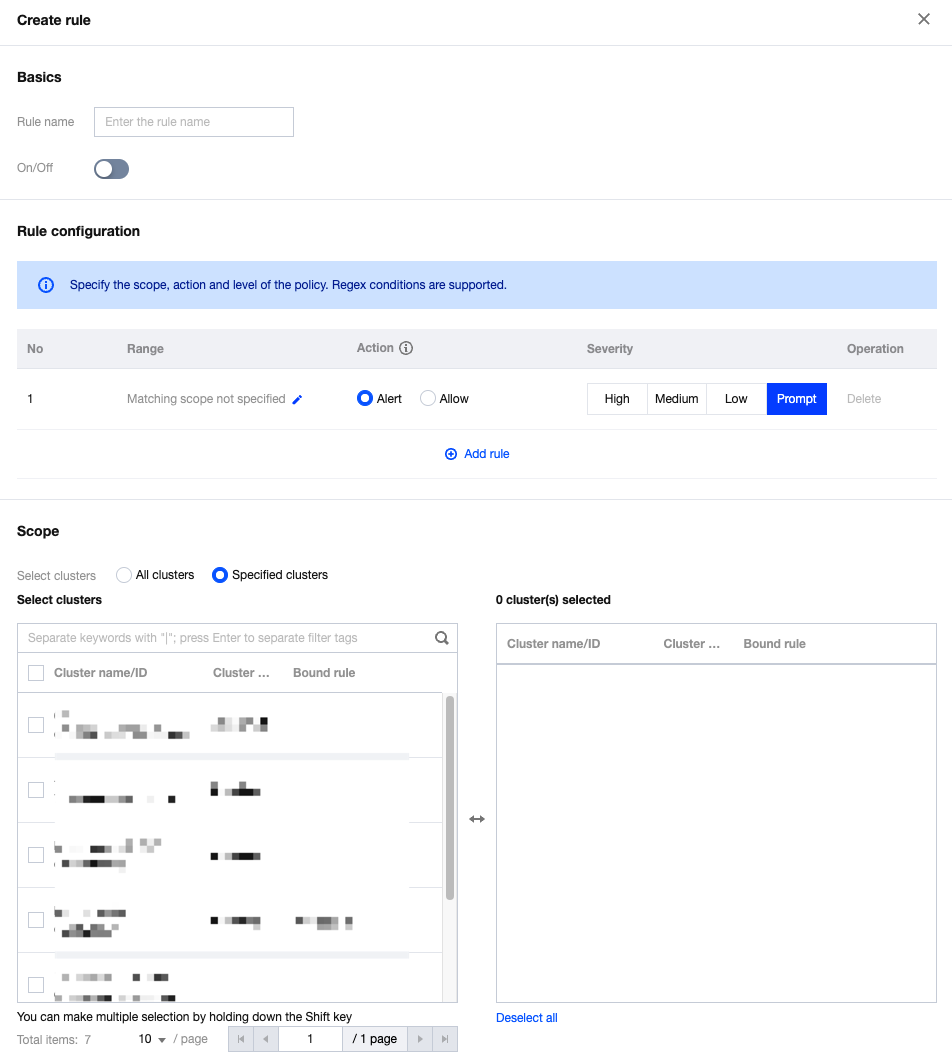
Custom Rules
In addition to the system rules provided by the TCSS products, users can also create custom rules.
On the rule configuration page, click Create rule, configure the relevant parameters, and click Save.
Field Name | Field Details |
Basic Configuration | Includes the name of custom rules and the switch for enabling or disabling the rules. |
Rule Configuration | Configure the fields for alarms and allowlisting in this section. When configuring alarm fields, you also need to concurrently configure the threat level for the rules. When there are multiple configuration items, click Add rule at the bottom. To configure the specific content of a rule, click Edit in the matching range column. Rule configuration supports regular expressions. |
Effective Range | Users can select the custom effective cluster range for configuration rules. Note:Only one custom rule can be bound to the same cluster. If multiple detection rules need to be configured for one cluster, it is recommended to edit and add them within the same rule. |
TKE K8s Cluster Enabling the Audit Process
When the audit feature of the cluster is not enabled, the audit logs of the K8s APIs cannot be collected for risk detection.
Note:
After the cluster audit is enabled, CLS will bill according to your actual usage. For billing standards, see the CLS billing overview.
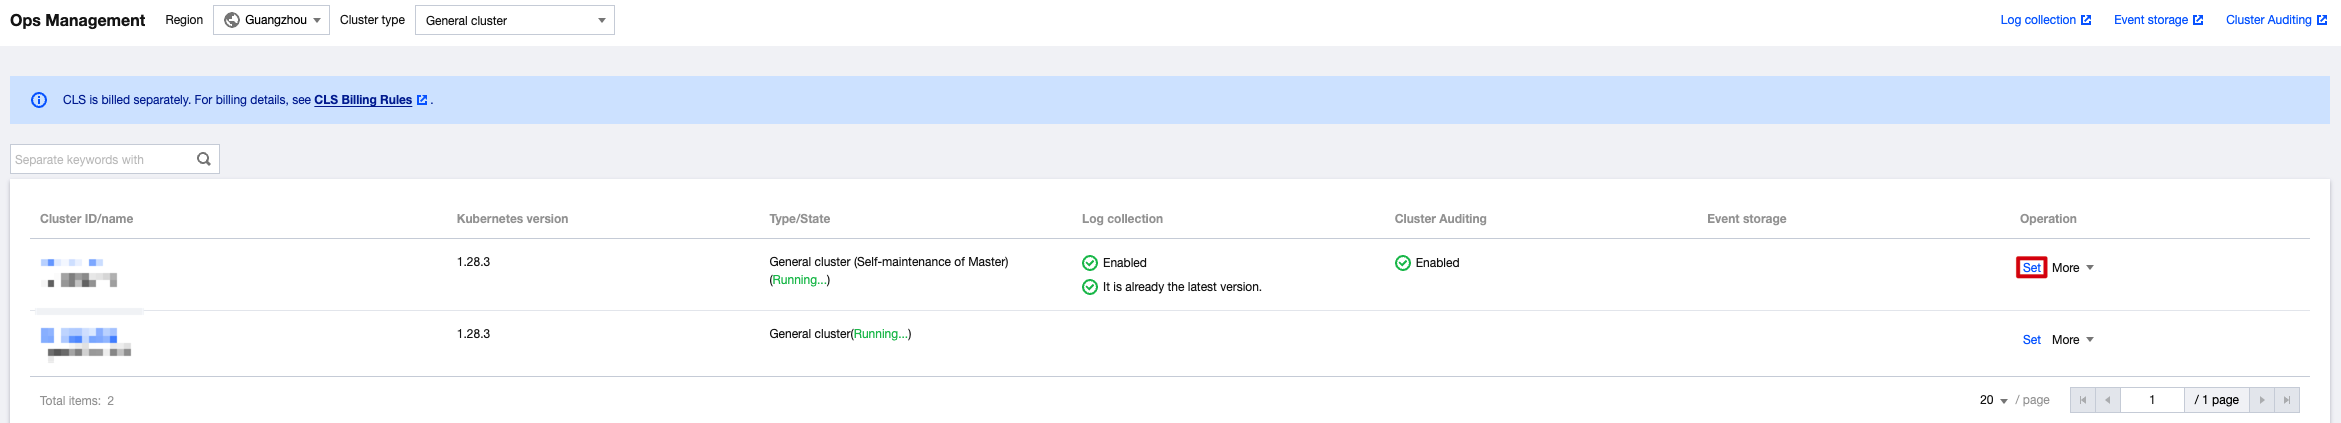
1. On the TKE console's Operation and Maintenance Feature Management Page, select the cluster for which you need to enable auditing, and click Set.
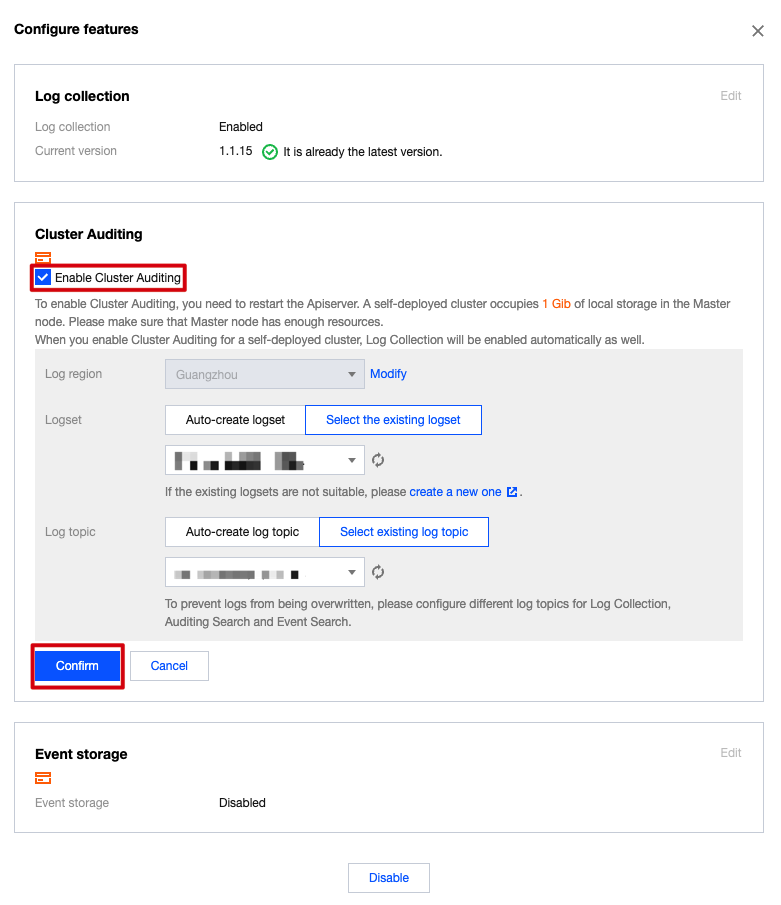
2. On the feature setting page, click Edit of the Cluster Auditing feature.
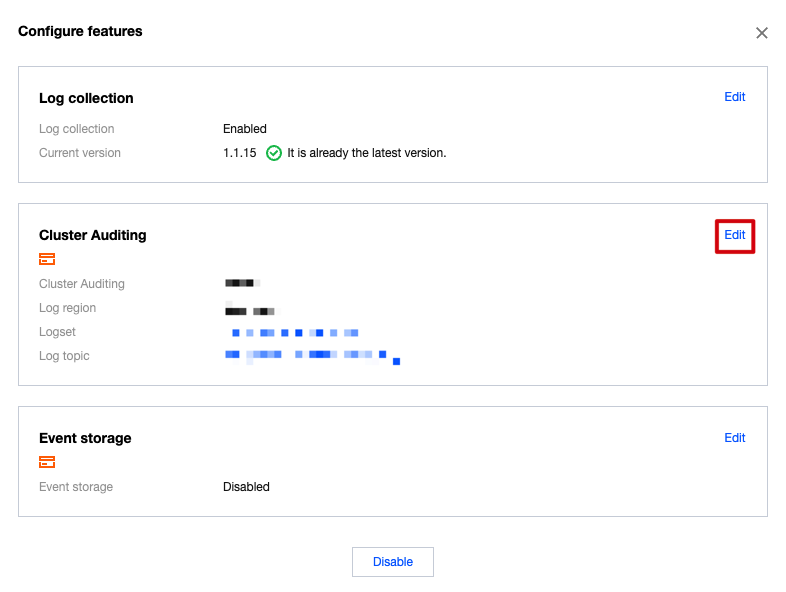
3. Check Enable Cluster Auditing, and click Confirm.

 Yes
Yes
 No
No
Was this page helpful?