
Slow Log Query

Last updated: 2025-08-22 16:37:44
The TencentDB for MongoDB (MongoDB) console supports viewing slow logs. Slow logs record database operations that exceed a specified execution time threshold. These logs are used for performance monitoring and optimization, helping developers and Ops personnel identify and address performance bottlenecks.
Background
In MongoDB, slow logs are often used as a basis for optimizing business operations. For more information about slow logs, see official documentation.
The system provides the following two query methods:
Abstract query: Query slow logs based on a specified time range. The results are presented as an aggregated analysis by command (operation) type.
Specific query: Query slow logs by specifying a specific operation command. The results are displayed in a list format, showing the execution duration of the command and the corresponding log details.
Version Description
All current versions of MongoDB support slow log management.
Use Instructions
The system records operations that take longer than 100 milliseconds to execute.
Slow logs are retained for 7 days, and each query can cover a time range of up to 1 day.
Queries are limited to the first 10,000 slow log entries. If the query is slow, narrow the time range.
Prerequisites
You have created a TencentDB for MongoDB instance.
The status of the replica set instance or sharded instance of TencentDB for MongoDB is Running.
Operation Steps
Querying Slow Logs
1. Log in to the TencentDB for MongoDB console.
2. In the left sidebar, expand the MongoDB dropdown list and select either Replica Set Instance or Shard Instance. The operations for replica set instances and sharded instances are similar.
3. Select a region at the top of the instance list page on the right.
4. Locate the target instance in the instance list.
5. Click the Target Instance ID to go to the Instance Details page.
6. Select the Log Management tab. On the Slow Log Query page, select a Query Method to query slow logs.
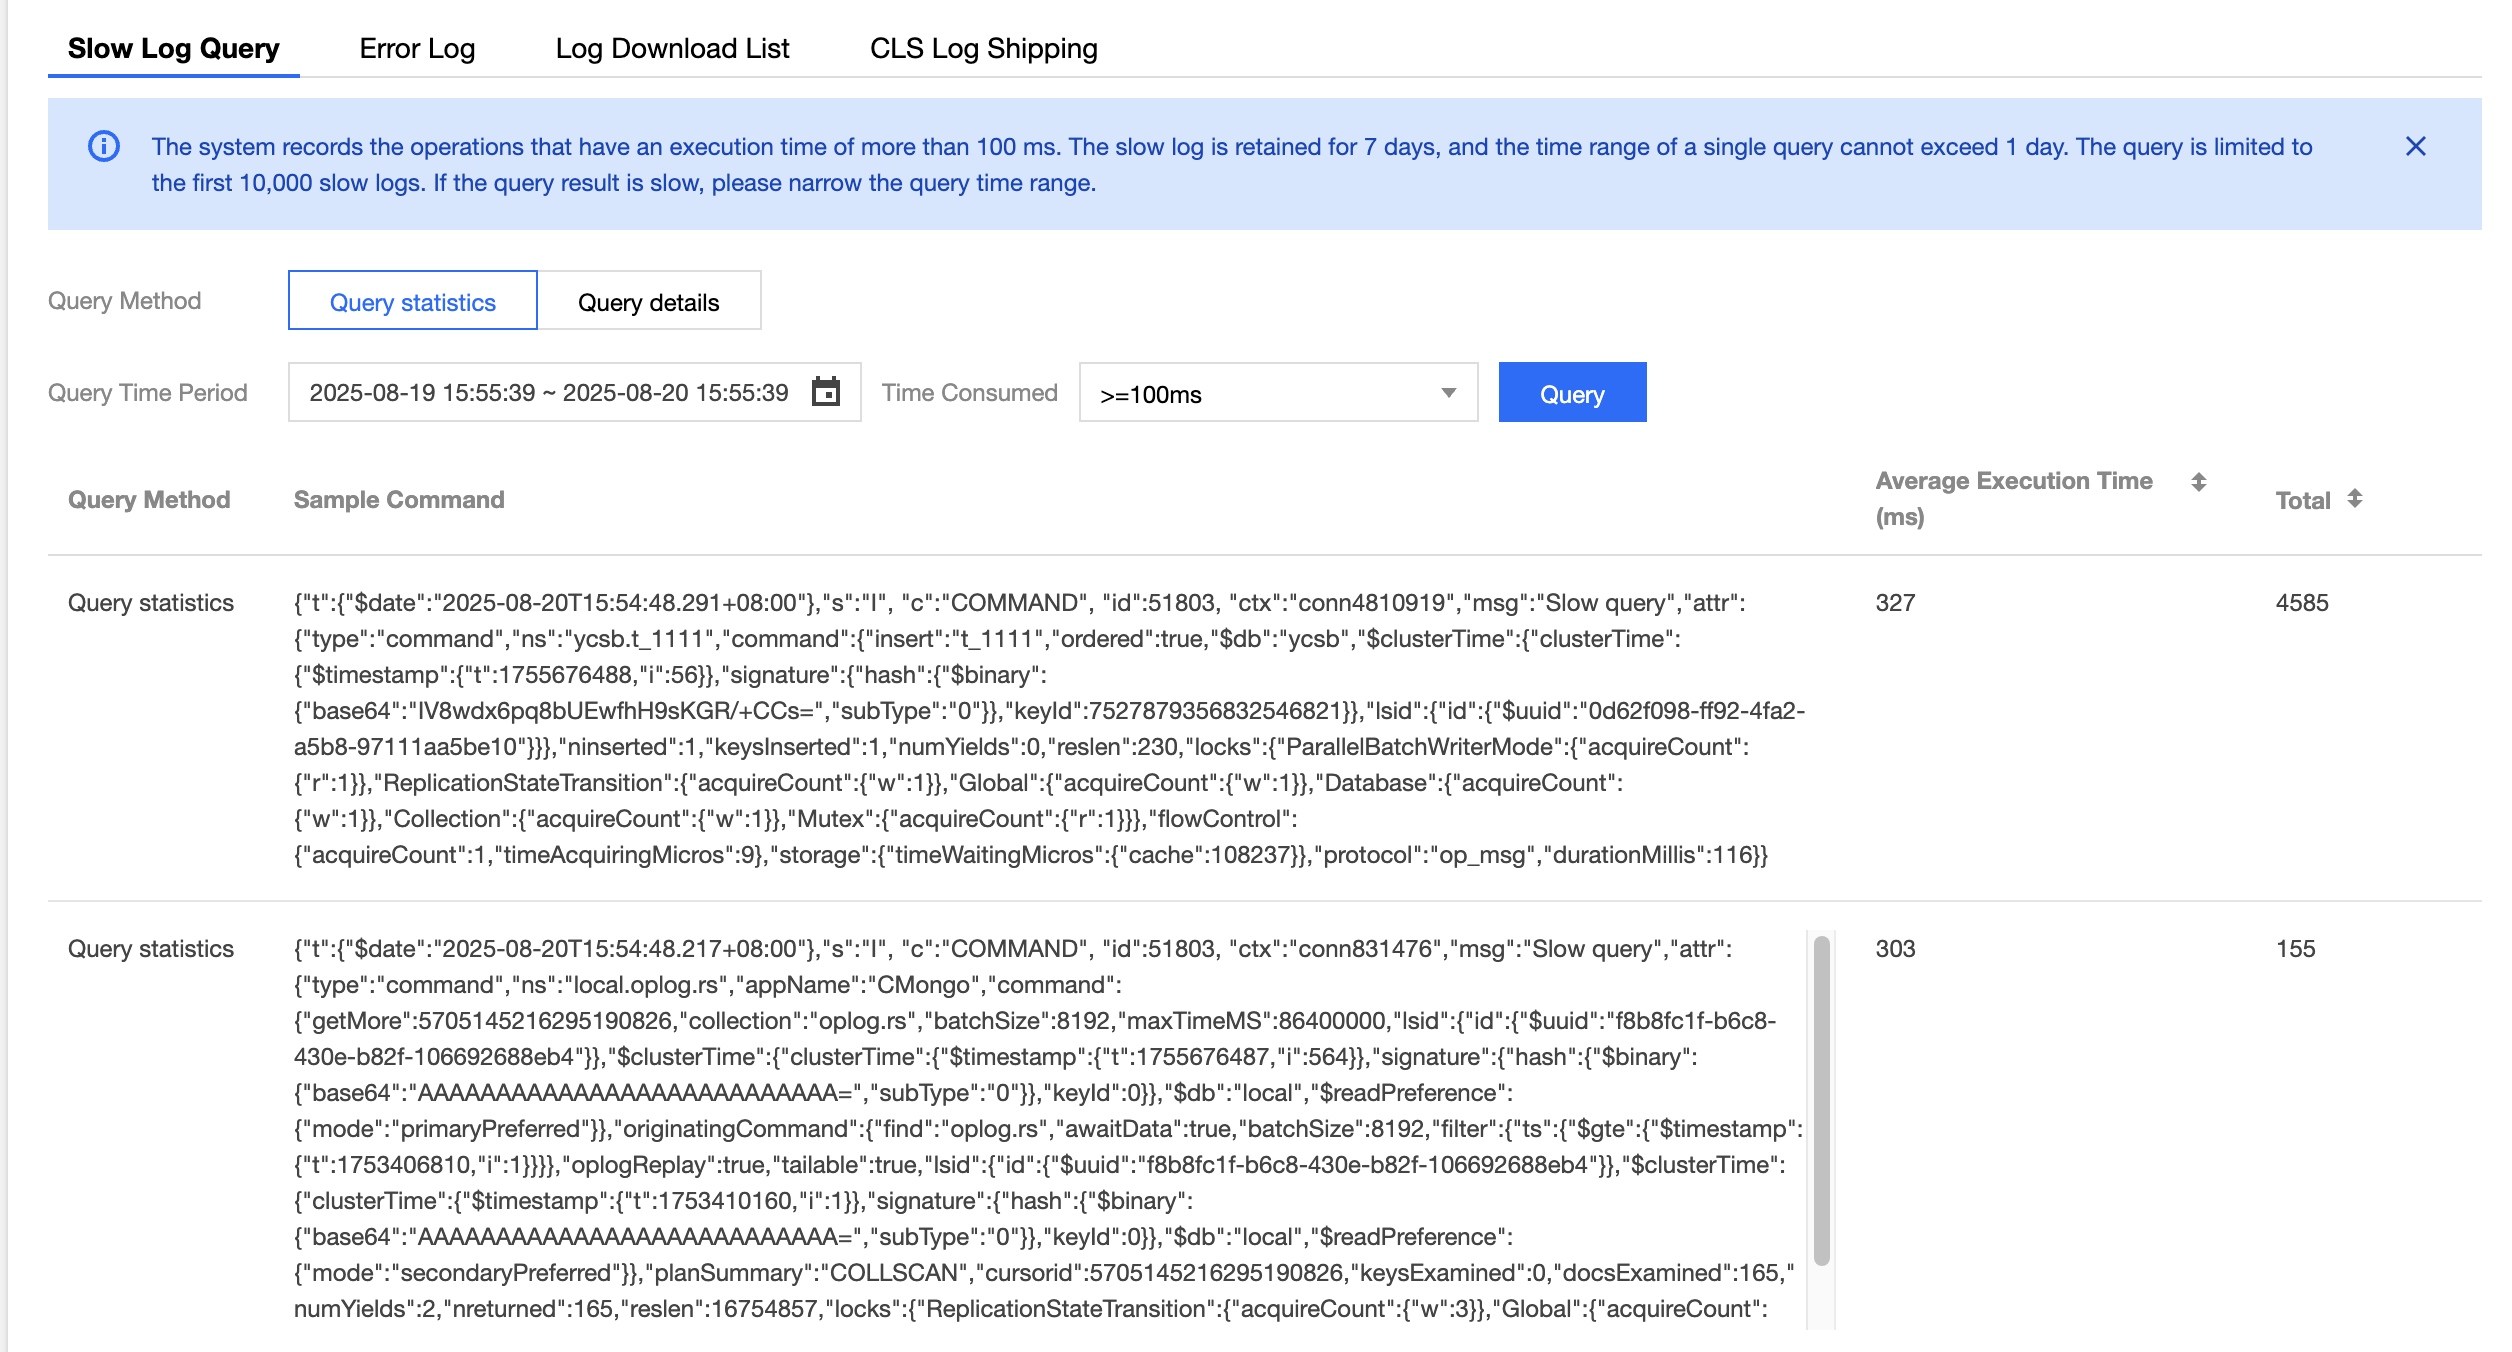
Abstract query: Select the Query Time Period, set the Time Consumed threshold, and then click Query.
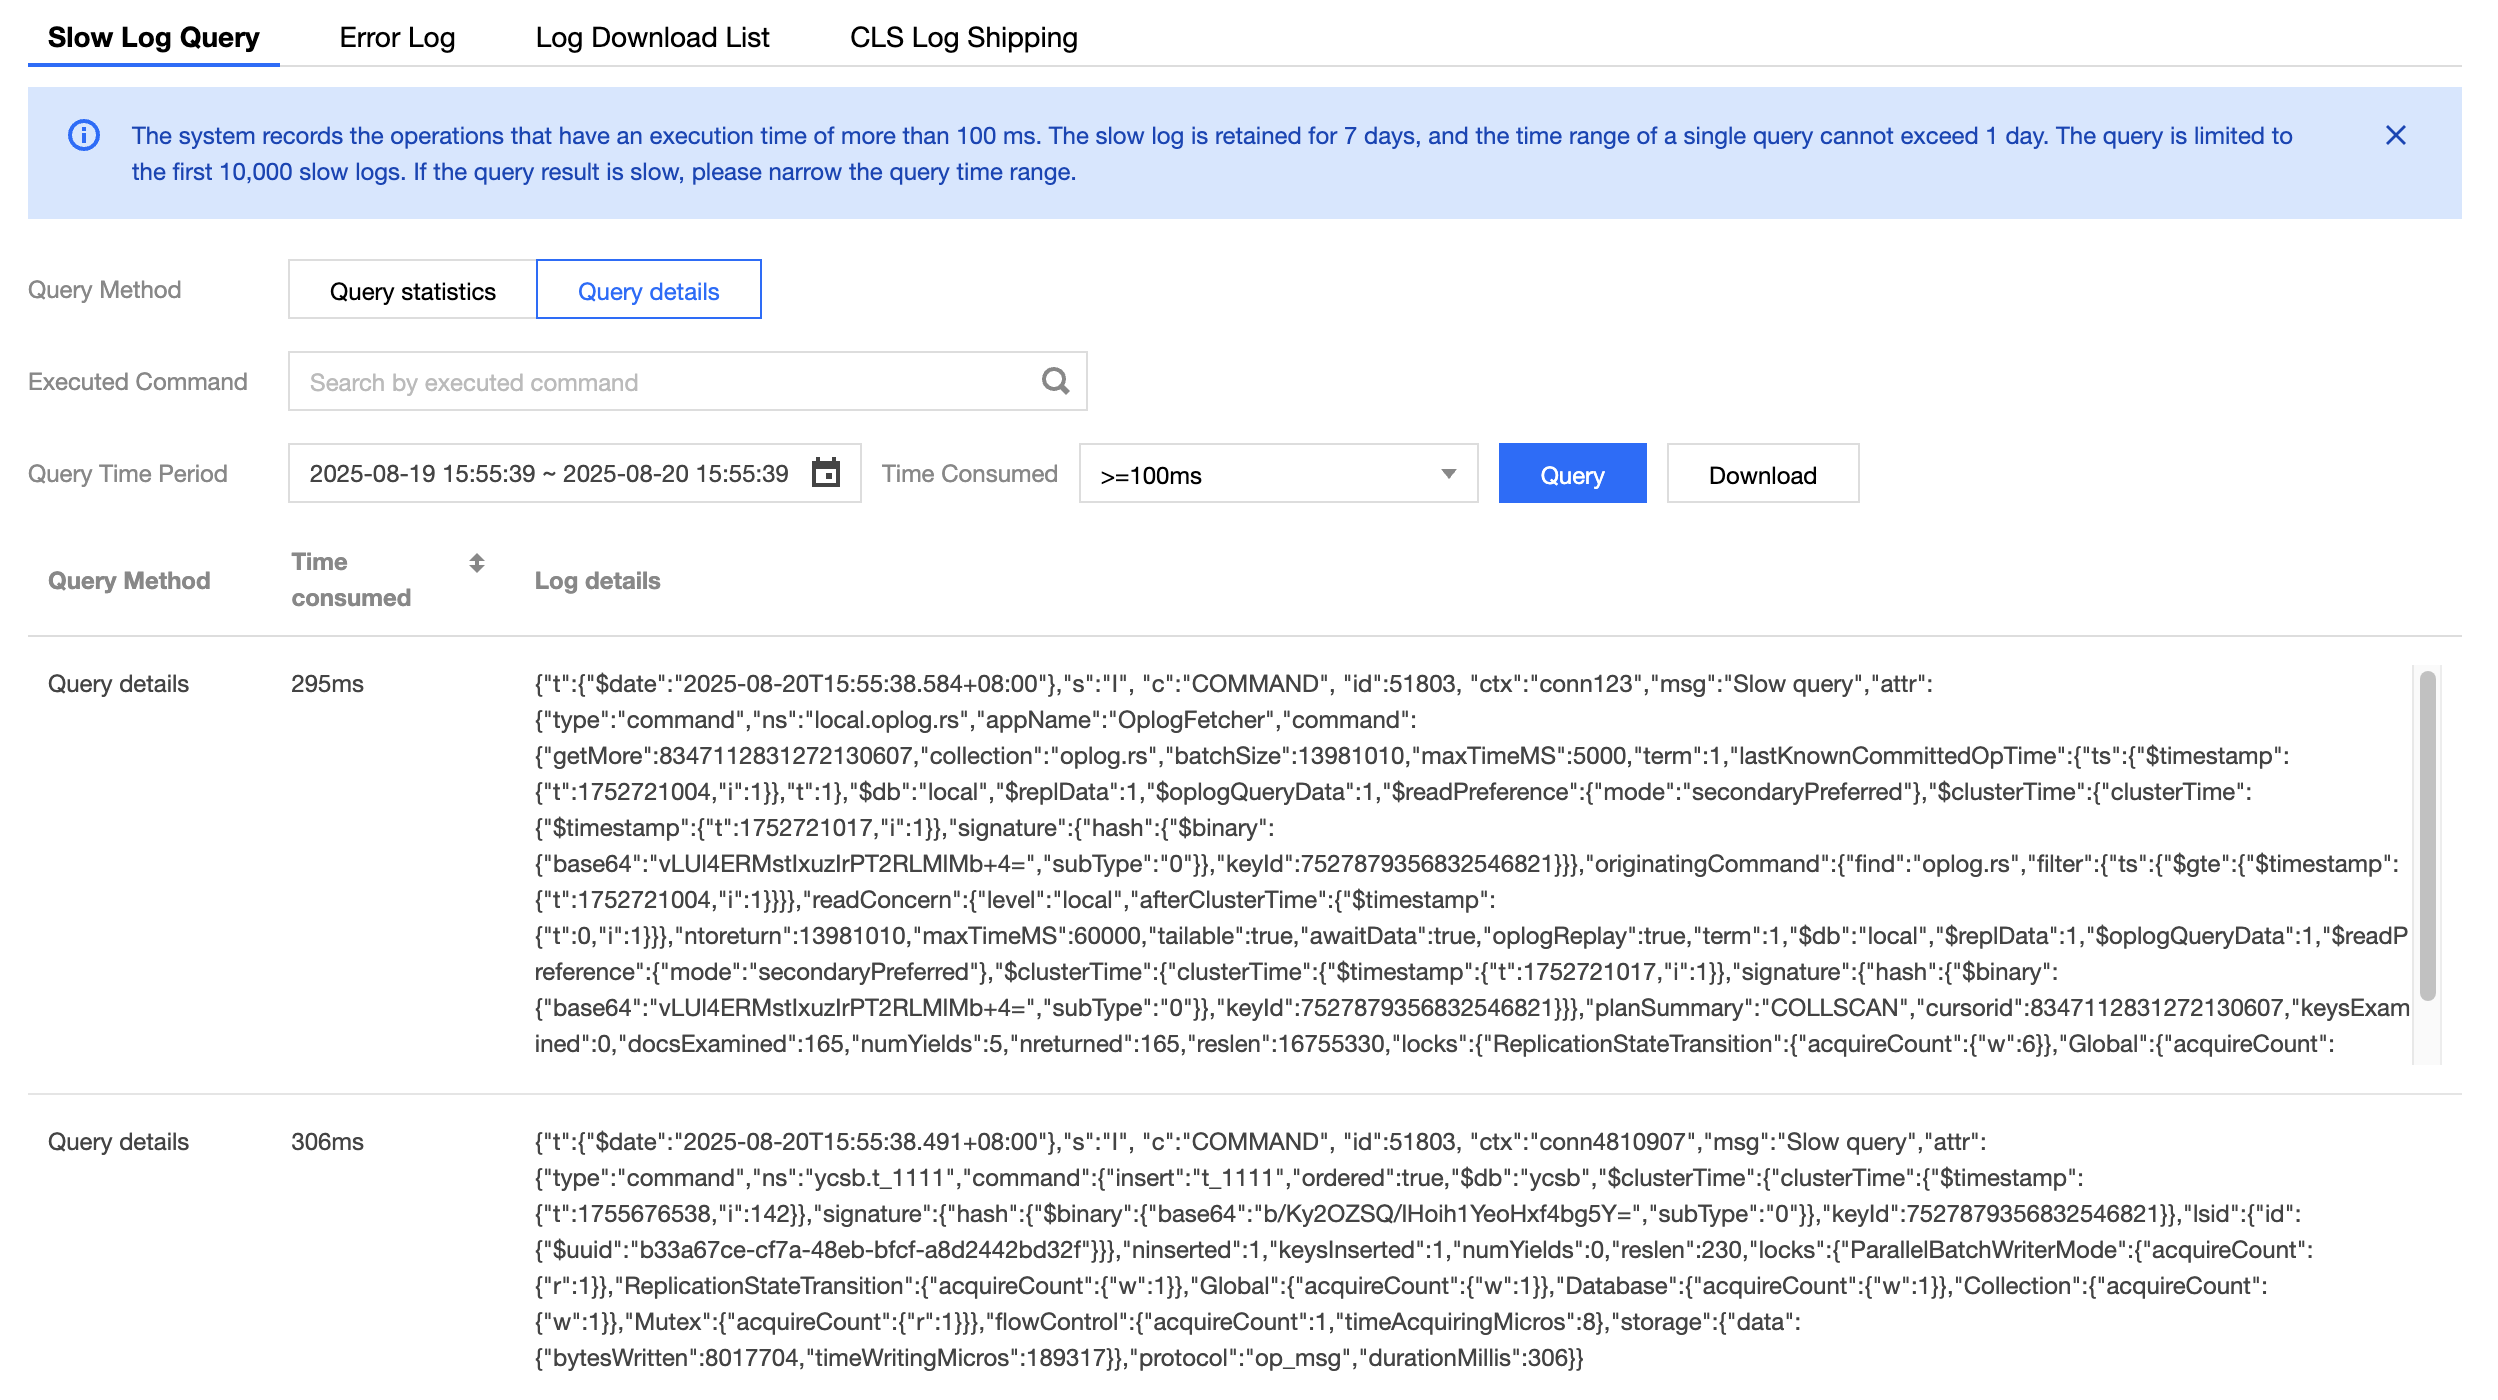
Specific query: Select the specific execution command in query command, and then select the Query Time Period and set the Time Consumed threshold. Click Query.
7. View and analyze slow logs.
Abstract query results include the following four fields:
Query method: Abstract query.
Sample Command: A statement output with the command type as the aggregation dimension, recording the operations in slow logs. The command field serves as the primary reference for troubleshooting.
Note:
Pay attention to keywords such as command, COLLSCAN, IXSCAN, keysExamined, and docsExamined. For more details on log entries, see MongoDB Official Website.
Command indicates the operation recorded in the slow log.
COLLSCAN indicates that the query performed a full table scan, while IXSCAN indicates that an index scan was performed.
keysExamined represents the number of index entries scanned, and docsExamined represents the number of documents scanned. The higher these values are, the more likely it is that there is no index in place or that the existing index has low selectivity. For guidance on index optimization, see Optimizing Indexes to Break Through Read/Write Performance Bottlenecks.
Average Execution Time (ms): The average execution time, in milliseconds, of operations aggregated by command type.
Total: The number of operations aggregated by command type.
Query details results include the following three fields:
Query Method: Specific query.
Time consumed: Execution time of the business command, measured in milliseconds.
Log details: Details of the business command.
Related APIs
API | API Description |
DescribeSlowLogs | |
DescribeSlowLogPatterns |
Was this page helpful?
You can also Contact Sales or Submit a Ticket for help.
Yes
No
Feedback