Switch Source-Replica Instance
Last updated: 2025-05-21 15:53:27
Reason for Master/Slave Switch
Interchange of master and slave node roles within an instance is called a master/slave switch. After the switch, the instance address remains the same, and the application automatically connects to the new master node, thereby ensuring high availability of the instance. The main reasons for the master/slave switch are:
Failover
The system automatically initiates a master/slave switch when it detects that the instance is abnormal and cannot be used normally. For specific switch conditions, see Failover Description.
Manual Switch
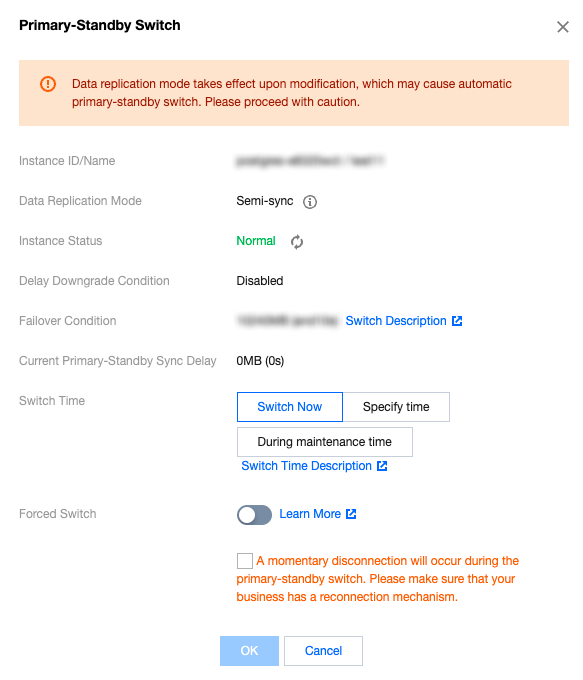
It refers to the master/slave switch initiated manually by application Ops personnel or authorized Tencent Cloud technical experts. Manual switch includes the switches with normal master-slave latency and forced switches with latency exceeding the master-slave latency.
Forced Switch
When the instance's master-slave replication mode is asynchronous replication or when semi-synchronous replication is degraded to asynchronous replication, a master/slave switch will be triggered if the master fails and cannot recover. As the data is not synchronized to the slave in real time, there is a small chance that data inconsistency might occur. Conditions for allowing switches are configured in the system by default, but you can also set specific conditions based on the needs of your business. Therefore, a switch is only allowed when the switch conditions are met. To facilitate switches in emergencies, the system provides forced switch capability.
Note:
To prevent changes in switch conditions over time, when a force switch is performed, the switch must be performed immediately.
Impact of Master/Slave Switch
There will be a momentary disconnection during the master/slave switch process. Please ensure that your application has a reconnection mechanism.
If there are read-only instances mounted on the master instance, there will be a minute-level delay after the master/slave switch.
Manual Switch of Instances
1. Log in to the PostgreSQL Console. In the instance list, click the Instance ID or Manage in the Operation column to enter the instance detail page.
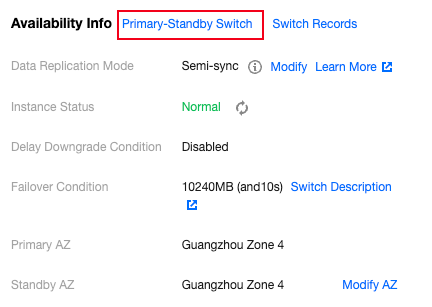
2. In the Availability Info section of the instance details, click on Primary-Standby Switch.


View Change Record
1. Log in to the PostgreSQL Console. In the instance list, click the Instance ID or Manage in the Operation column to enter the instance detail page.
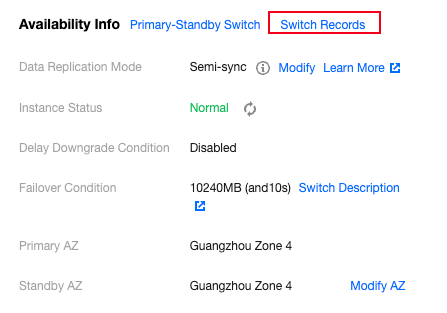
2. In the Availability Info section of the instance details, click Switch Records. The system will retain switch records for one year.

Master/Slave Latency Monitoring Metrics
TencentDB for PostgreSQL provides detailed monitoring information to help you observe the synchronization latency between the master and slave nodes. The specific monitoring metrics are as follows:
Metric Name | Metric Description |
Slave Log Write-to-Disk Latency (Bytes) | It refers to the difference in size between the slave log write-to-disk LSN and the current LSN of the master instance. For the master instance, this metric reflects the data loss size in the event of a failover. |
Slave Log Write-to-Disk Time Latency (Seconds) | The time difference between the transmission of logs from the primary database to the secondary database and the reception and persistence of these logs on the secondary database reflects the potential data loss during failover for the primary instance. This metric is available only for instance versions 10.x and above. |
Master-Slave Data Synchronization Latency (Bytes) | It refers to the difference in size between the slave replay LSN and the current LSN of the master instance. For the master instance, this metric reflects the RTO in the event of a failover. For read-only instances, this metric reflects the data latency size. |
Master-Slave Data Synchronization Latency Time (Seconds) | The time difference between the transmission of logs from the primary database to the secondary database and the reception and replay of these logs by the secondary database. This metric is available only for instance versions 10.x and above. |
Slave Log Send and Replay Position Difference (Bytes) | It refers to the size difference between the master instance sending the log to the slave instance and the completion of slave log replication. It reflects the speed of slave log application. You can mainly check the performance of the slave instance and the speed of network transmission through this metric. This metric is not available for read-only instances. |
Was this page helpful?
You can also Contact Sales or Submit a Ticket for help.
Yes
No
Feedback

