Nginx Controller now provides monitoring data of the addon running status. You can enable Nginx-ingress monitoring capabilities by configuring Nginx-ingress monitoring.
Prerequisites
The cluster has associated with cloud native monitoring PROM instance.
Cloud native monitoring PROM instance needs to be on the same network plane as Nginx.
Collection Metrics
TKE Nginx-ingress automatically configures the following collection metrics:
You can also configure monitoring collection metrics based on your business needs. For metric details, see Official Document.
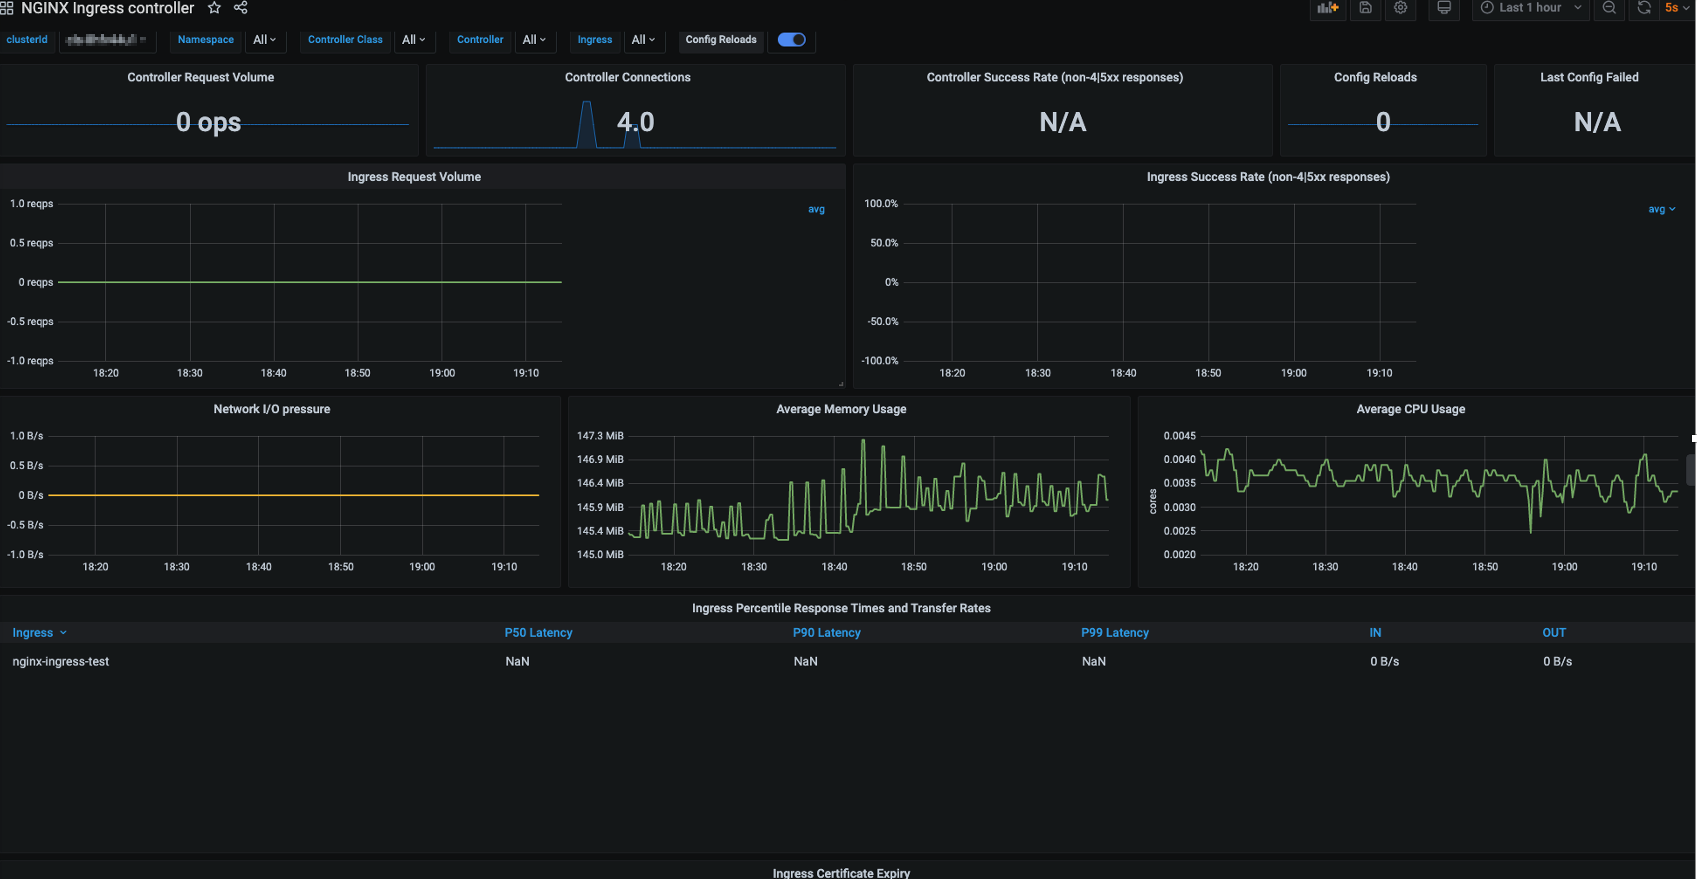
Grafana Dashboard of Nginx-ingress Monitoring
After TKE Nginx-ingress has enabled the monitoring feature, it will associate with the cloud native monitoring PROM instance. Cloud native monitoring PROM instance provides a Grafana dashboard. You can directly go to the corresponding Grafana dashboard on the Nginx-ingress addon page, as shown in the figure below: