CoreDNS Log Dashboard User Guide
Last updated: 2024-11-04 10:20:24
Tencent Kubernetes Engine (TKE) has deployed CoreDNS to provide domain name resolution service within a cluster. Due to various reasons such as network failures or excessive CoreDNS load, DNS request exception, high request latency, and uneven distribution of CoreDNS requests among multiple replicas may occur, thereby affecting users' normal DNS requests. To quickly troubleshoot DNS exception and identify potential business and security vulnerabilities, TKE has built a comprehensive CoreDNS logging capability based on the CoreDNS log plugin and the Cloud Log Service (CLS) log platform. This document will guide you on how to enable CoreDNS logs in a TKE cluster and use the corresponding dashboard feature for troubleshooting.
Prerequisites
1. CLS should be activated for clusters.
2. The log plugin needs to be added to the Corefile configuration of CoreDNS.
Note:
Add the log plugin to the Corefile configuration as follows, and edit the configmap named coredns under kube-system.
data:Corefile: |2-.:53 {template ANY HINFO . {rcode NXDOMAIN}log # Add the log plugin here.errorshealth {lameduck 30s}readykubernetes cluster.local. in-addr.arpa ip6.arpa {pods insecurefallthrough in-addr.arpa ip6.arpa}prometheus :9153forward . /etc/resolv.conf {prefer_udp}cache 30reloadloadbalance}kind: ConfigMap
Save the configuration and exit. The Corefile will be automatically reloaded. If the Corefile is not configured for reloading, you need to rebuild CoreDNS to make the configuration effective.
3. Ensure the cluster's CoreDNS version is 1.8.4 or later. If you need to upgrade CoreDNS to version 1.8.4, refer to Upgrading to v1.8.4.
Enabling CoreDNS Logs
1. Log in to the TKE console and select O&M Feature Management in the left sidebar.
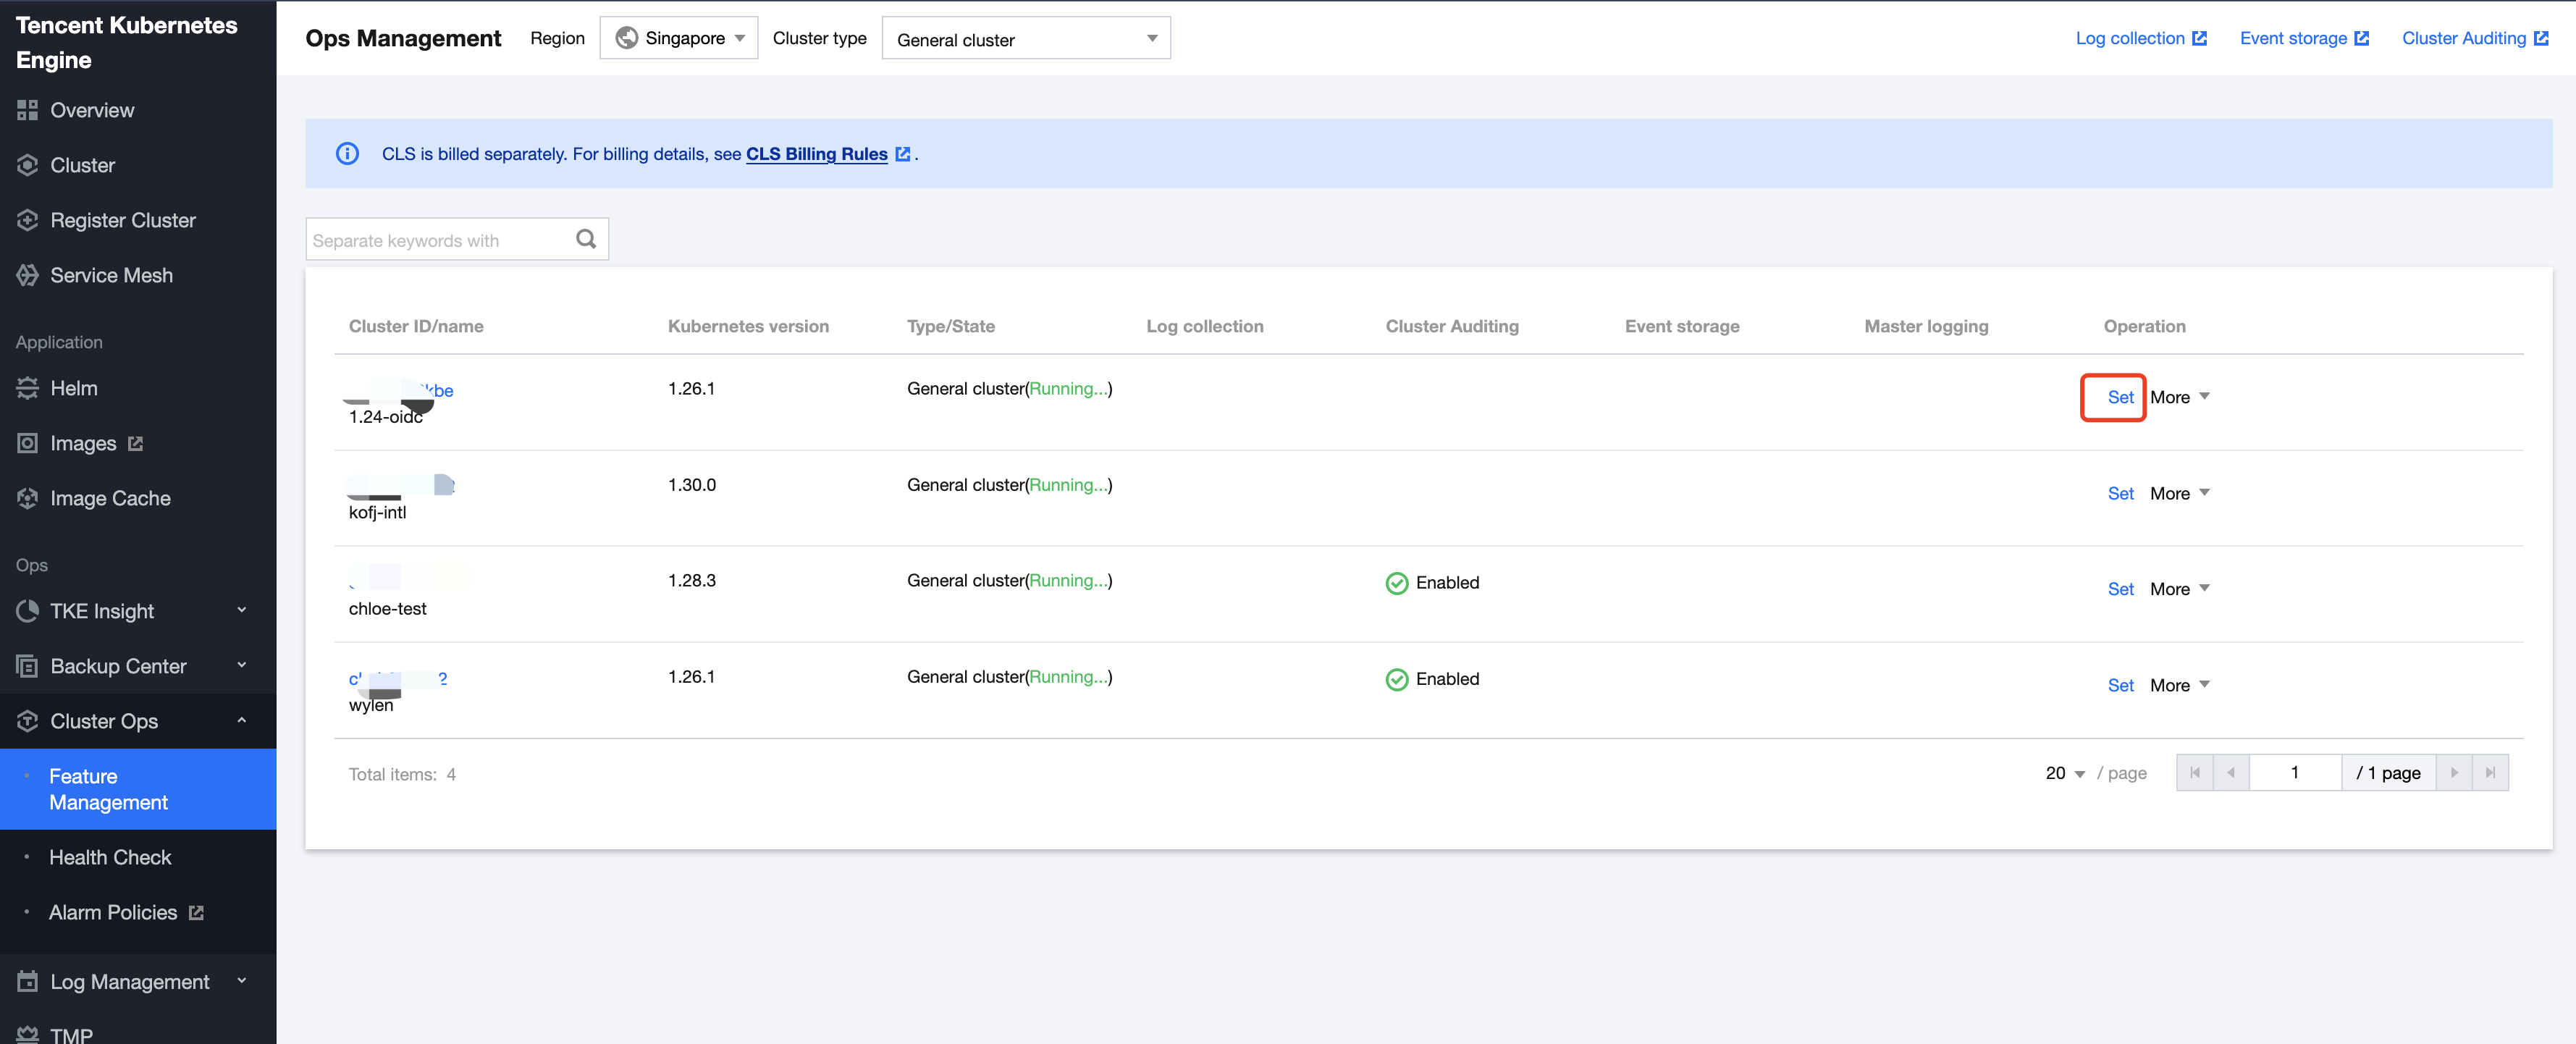
2. Select the cluster for which you want to enable CoreDNS logs and click Settings on the right side of the cluster, as shown in the figure below:
3. On the Set feature page, click Edit to the right of Log Collection.
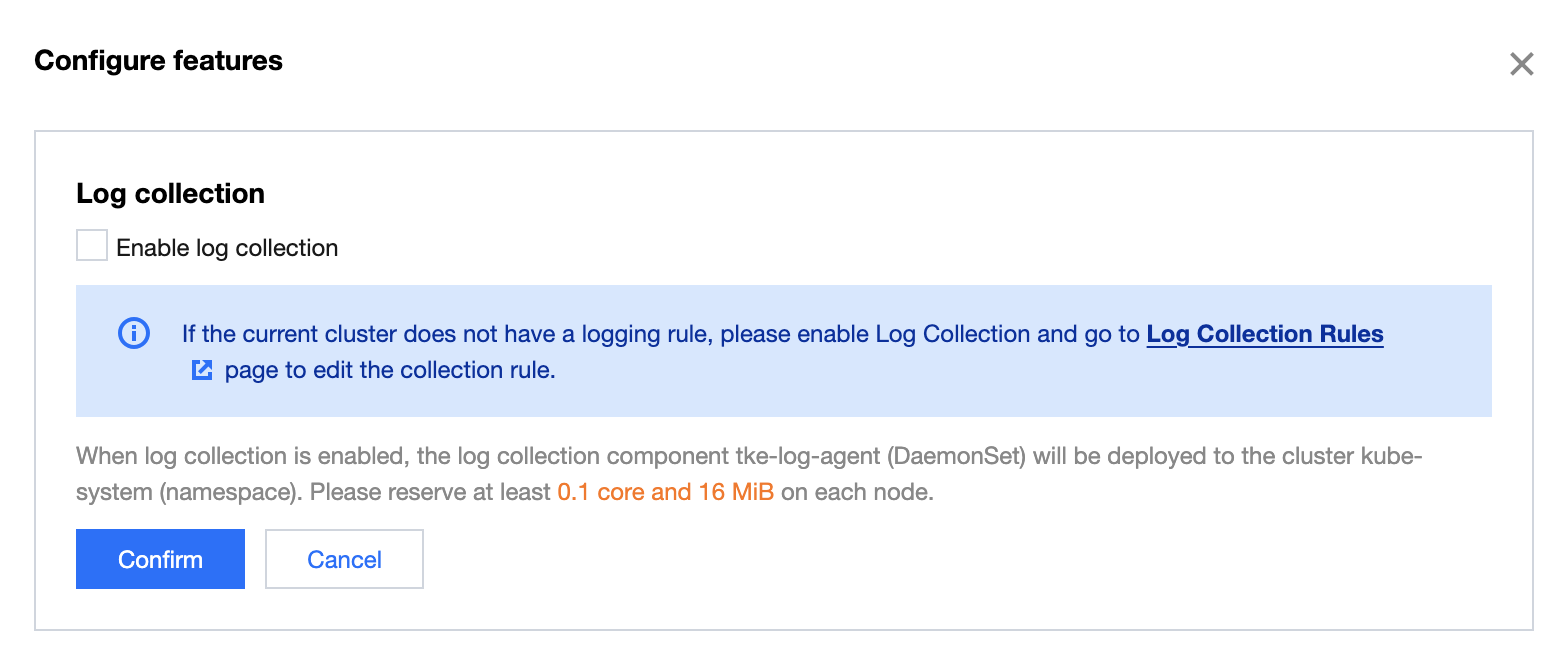
4. Select Enable Log Collection and click Confirm, as shown in the figure below:
Note:
5. Click Edit to the right of Network Logs, as shown in the figure below:

6. Select Enable CoreDNS Logs and enter the following information:

Log region: Select a region for storing CLS log sets.
Log set: Select a CLS log set name. If there is no suitable log set, you can create a log set.
Log topic: You can choose to automatically create a log topic or select an existing log topic.
7. Click Confirm to enable CoreDNS logs.

Click the log topic link to enter the CLS page to query logs and perform other operations. The meanings of the log index fields are as follows:
Field Name | Description | Example |
class | Request category. | IN |
do | Whether "DNSSEC OK" (Domain Name System Security Extensions Confirmation) is set in a query. | false |
duration | Response time (in seconds). | 0.000098921 |
id | Request ID, which identifies a specific DNS request and response. | 30008 |
level | Log level. | INFO |
name | Target domain name queried in a DNS request. | craned.crane-system.svc.cluster.local. |
port | Client port sending a DNS request. | 50424 |
proto | Protocol used. | udp |
rcode | Response code. | NXDOMAIN |
remote | Client IP address. | 10.99.10.128 |
rflags | Flag fields in response messages, which indicate the status and results of a DNS query. | qr, aa, rd |
rsize | Maximum DNS response size. | 162 |
size | Maximum DNS request size. | 69 |
bufsize | Internal buffer size for DNS requests and responses. | 65535 |
type | Request type. | A |
Using the CoreDNS Dashboard in Log Management
1. Log in to the TKE console and select Log Management > CoreDNS Logs in the left sidebar.
2. Go to the CoreDNS Log page and select the region, cluster type, and the cluster you need to view, as shown in the figure below:

3. View dashboard data, as shown in the figure below:
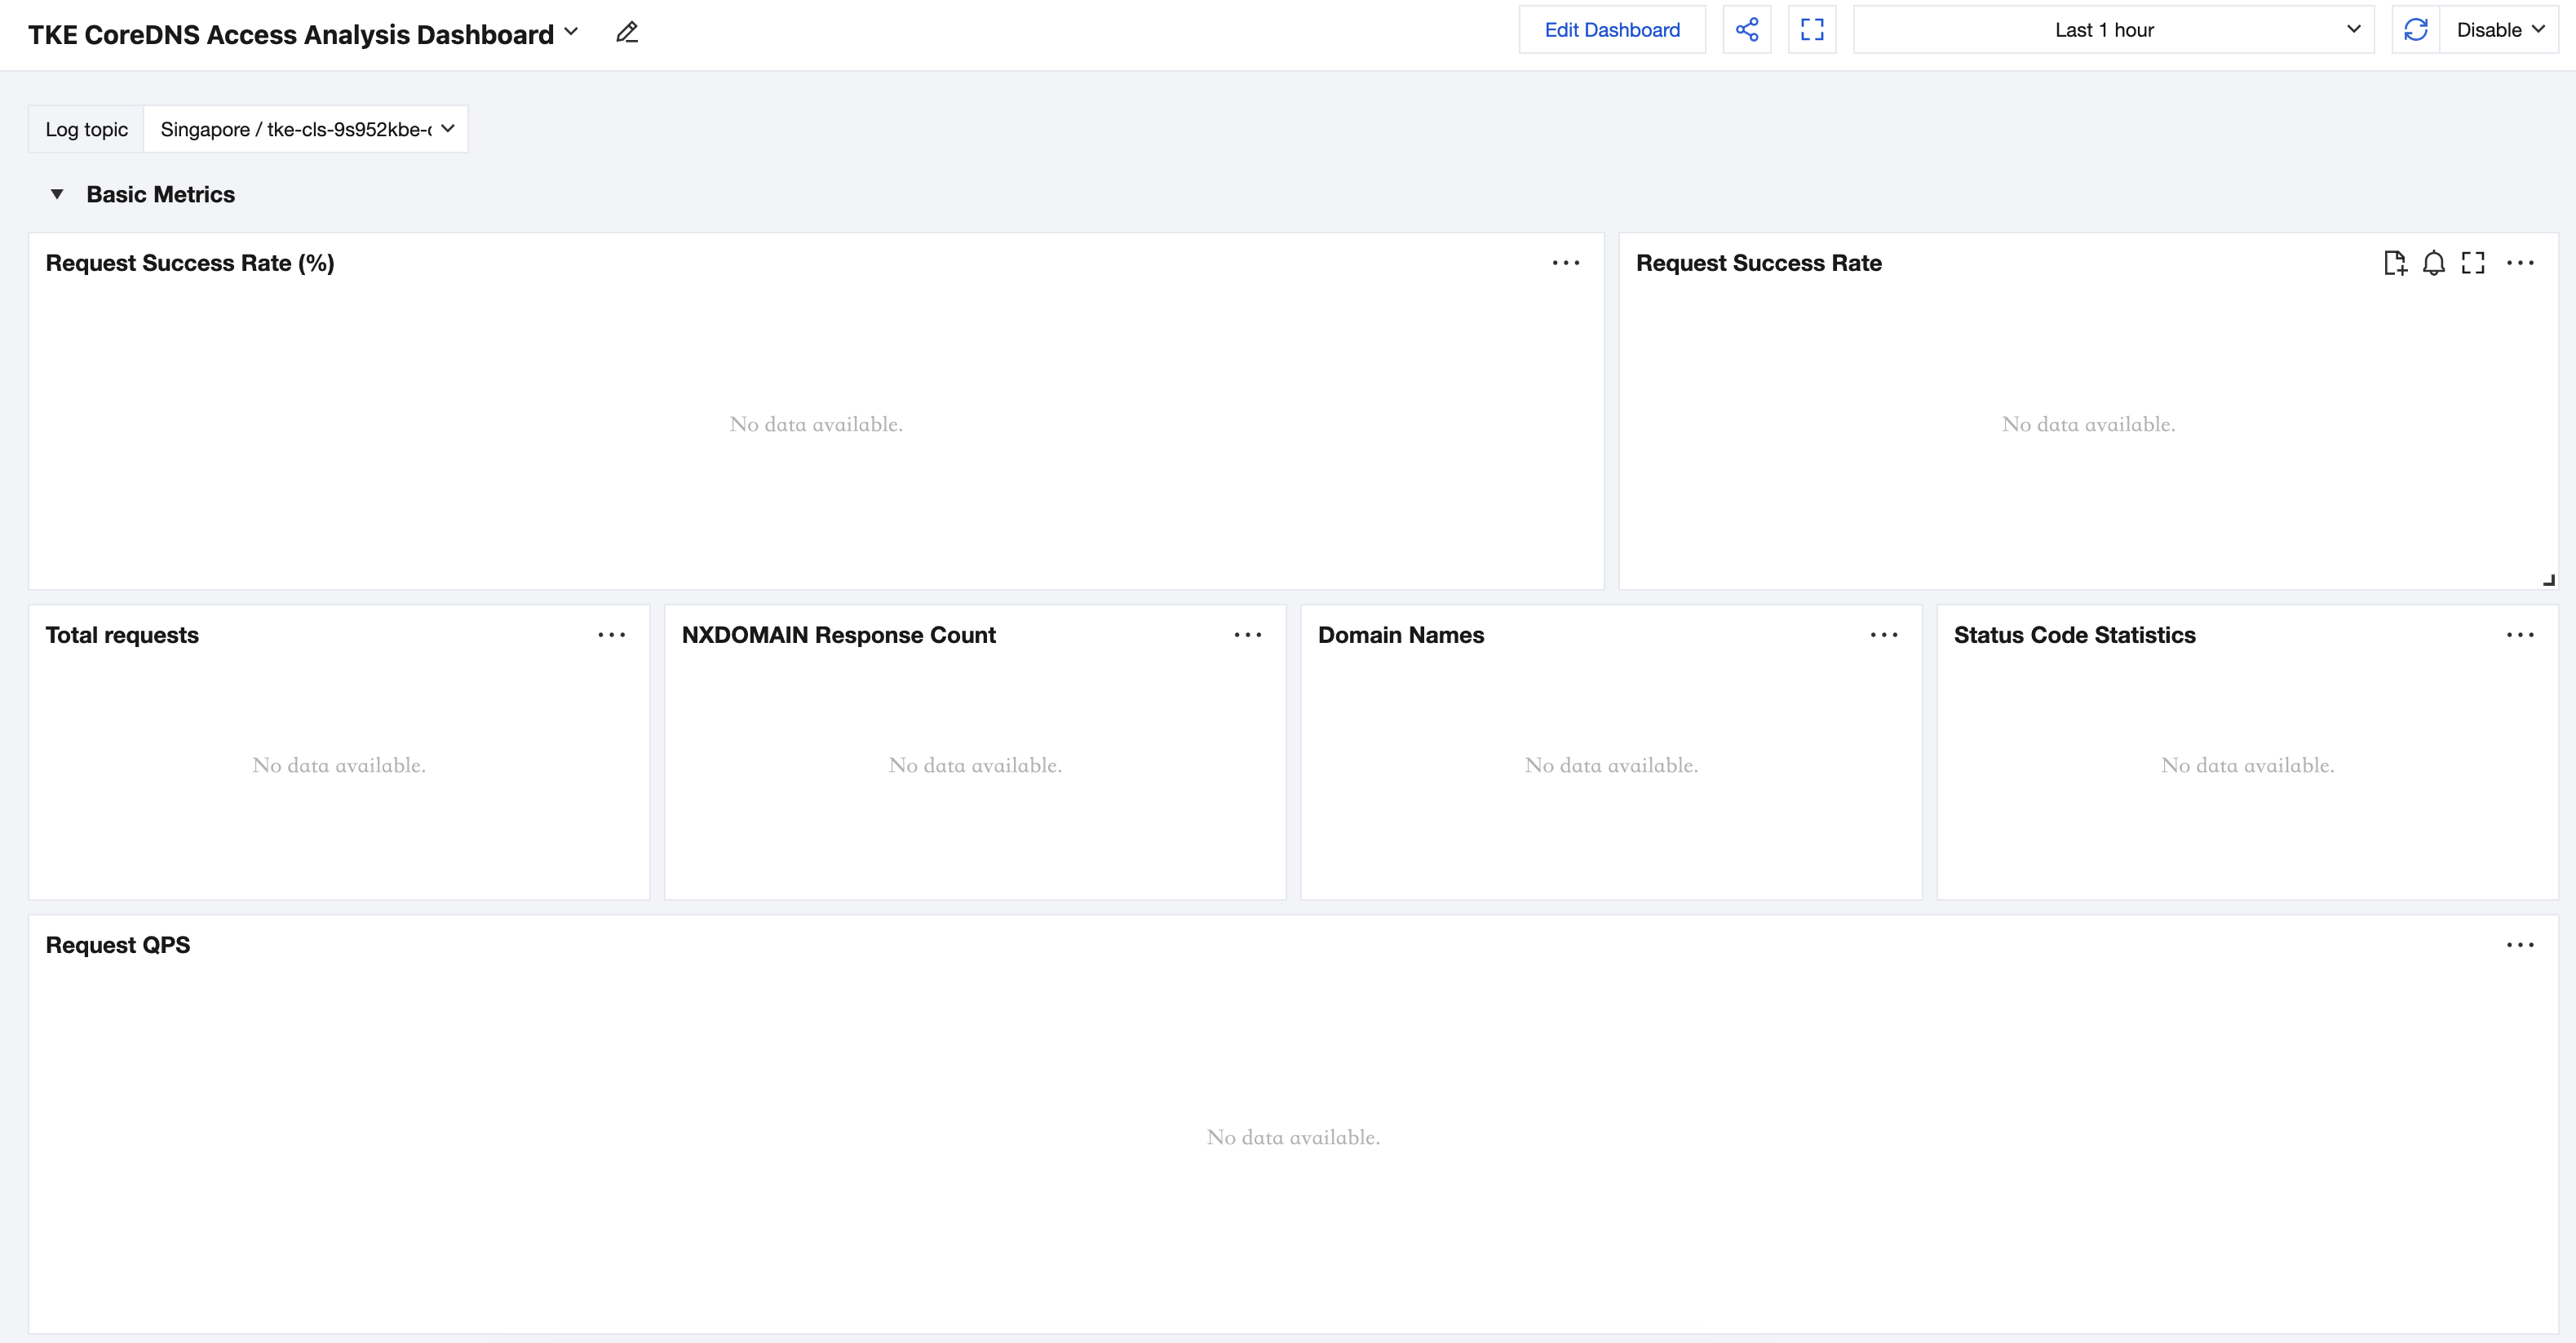
Request Success Rate: Calculates the proportion of all normal DNS responses (NOERROR and NXDOMAIN) to the total number of requests. You can use this metric to identify whether there are any resolution failures in the current CoreDNS.
Number of Domains: Displays the total number of domain names responded to by the current CoreDNS service.
Request QPS: Reflects the queries per second (QPS) performance of CoreDNS service over a certain time period . You can use the sequence diagram to identify performance issues in CoreDNS.
Average Latency/P95 Latency/P99 Latency: Reflects the average latency, P95 latency, and P99 latency of the last 10,000 requests in the CoreDNS service, helping to identify slow response issues in CoreDNS.
CoreDNS Pod Request Distribution: Displays the request distribution and average latency for each replica in multi-replica CoreDNS scenarios, helping to identify issues with uneven request distribution among CoreDNS replicas.
Slow Resolution Log: Records relevant information in the slow resolution log when DNS request processing time exceeds a specific threshold. By analyzing the slow resolution log, you can identify the types of requests that take the most time and optimize accordingly.
Disabling CoreDNS Logs
If you no longer need CoreDNS log collection, you can disable CoreDNS log collection capability as follows:
1. Log in to the TKE console and select O&M Feature Management in the left sidebar.
2. Select the cluster for which you need to disable CoreDNS logs and click Settings on the right side of the cluster.
3. On the Set feature page, click Edit to the right of Network Log, as shown in the figure below:

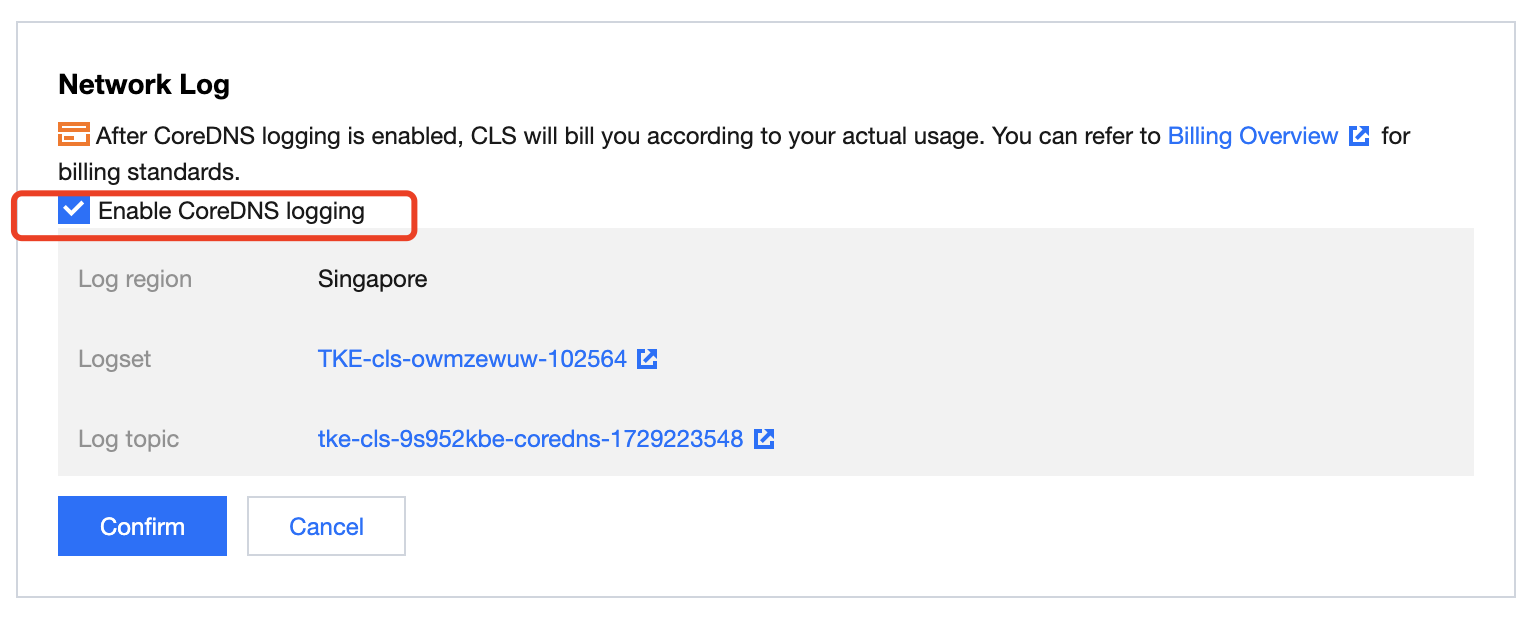
4. Deselect Enable CoreDNS Logs, as shown in the figure below:
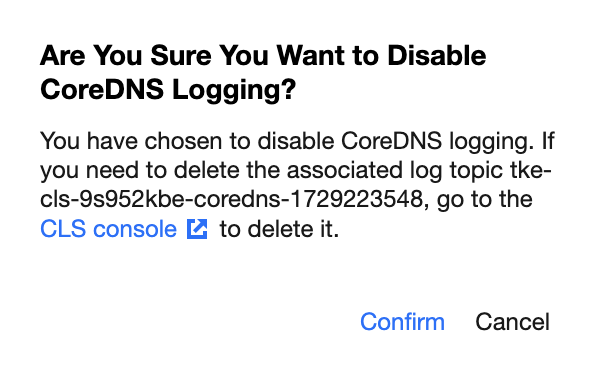
5. Click Confirm. If a log topic is automatically created, you will be prompted about the associated log topic. If you no longer need this log topic, click to go to the CLS console to delete the corresponding log topic. Otherwise, the associated log topic will be retained and incur charges.
Was this page helpful?
You can also Contact Sales or Submit a Ticket for help.
Yes
No
Feedback

