Cost Analysis is a basic feature of the cost management system, helping you flexibly and efficiently analyze bill data to clearly understand your cost of migrating to cloud. Meanwhile, Tencent Cloud introduced the AI feature for cost management. Starting with AI-powered cost analysis, this feature leverages technological innovation to maximize the value of every cloud resource, making cloud financial management easier and more intelligent.
To use Cost Explorer, log in to the Billing Center, and click Cost Management > Cost Explorer in the left sidebar to enter the Cost Explorer page.
Feature Introduction
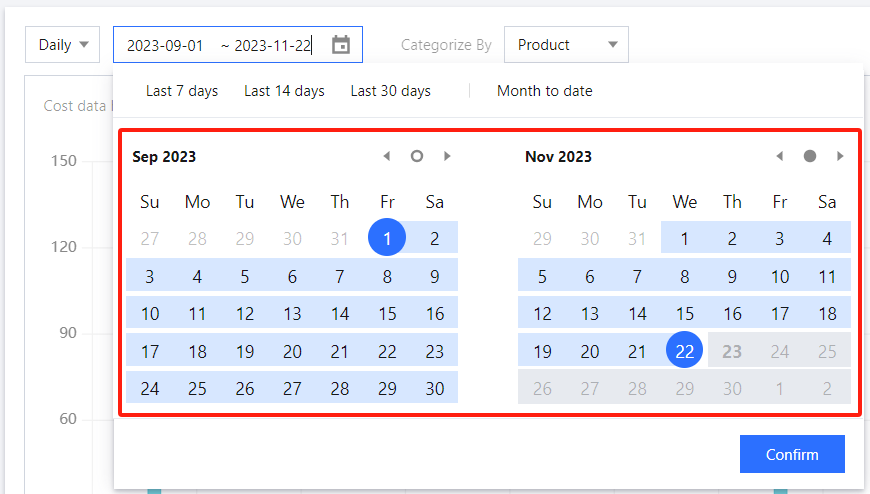
Time period
Cost data can be displayed for a specified period or a relative period at hourly, daily, and monthly granularities.
Specified period: Select the start date and the end date in the calendar.
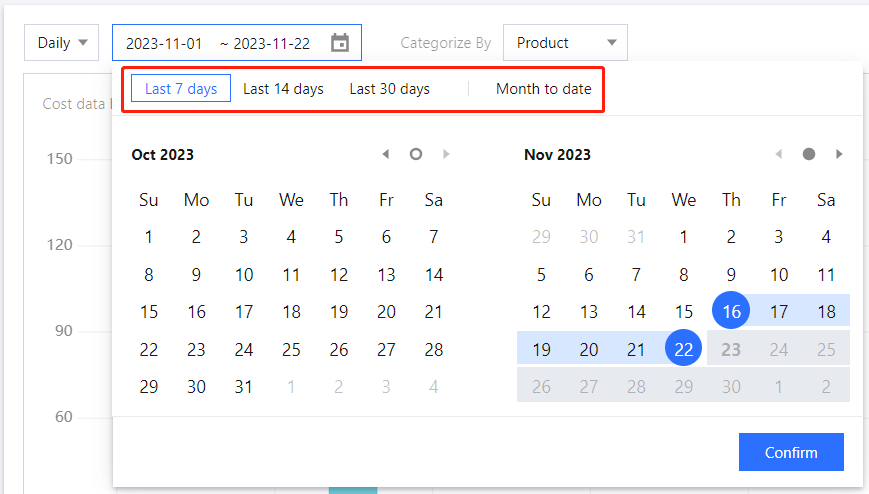
Relative period: Select a time period from the top of the calendar. This is mainly used to automatically update a regularly occurring cost report.
Daily granularity supports the last 7 days, 14 days, 30 days, month-to-date, current month, +7 days, +14 days, +30 days.
Monthly granularity supports the last 3 months, 6 months, 2 months, year-to-date, current year, +3 months, +6 months, +12 months.
Note:
Hourly granularity supports a maximum of 30 days. Daily granularity can display data from within the last 6 months. Monthly granularity can display data from within the last 12 months.
Data Update Validity Period Description
Billing statement caliber
The update schedule for daily and monthly cost analysis data is within 2 hours after the detailed billing data is updated(except when the categorize by is "resource ID" which updates at T+2 days), latest within 4 hours after the update (since the task takes time, no more than 2 hours); current month data does not include unissued pay-as-you-go data.
The update schedule for hourly cost analysis data is T+2 days after the detailed billing data is updated. For example, data from November 21 can be viewed after 12:00 on November 23.
Consumption Billing Basis
The update schedule for hourly, daily, and monthly cost analysis data is T+2 days. For example, data from November 21 can be viewed after 12:00 on November 23.
Note:
The complete cost data of the previous month can be viewed in cost analysis after 12:00 on the 2nd each month.
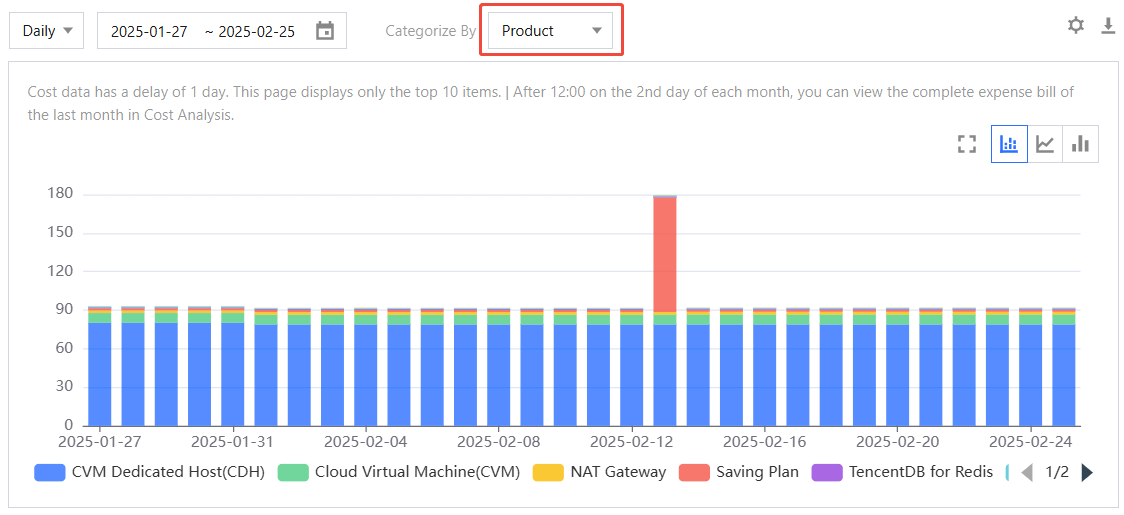
Categories
You can select different categories to aggregate and display your costs based on different dimensions. It supports group and multi-account cost filtering, classification, aggregation, and analysis.
One category can be selected at a time. The chart displays the categorized cost data over a certain period of time.
Categories include spend type, bill type, product, subproduct, component type, component name, resource ID, region, availability zone, transaction type, billing mode, tag, project, payer account, user account, and cost allocation unit.
Note:
The organization account administrator can assign cost analysis viewing permissions to member accounts under "finance authorization". For more details, please refer to Adding Organization Member.
Note: Data for the current month is refreshed with a 2-hour delay after the detailed bill is issued, and does not include unbilled pay-as-you-go data.
You can view the complete cost data for the previous month in cost analysis after 12:00 on the 2nd of each month.
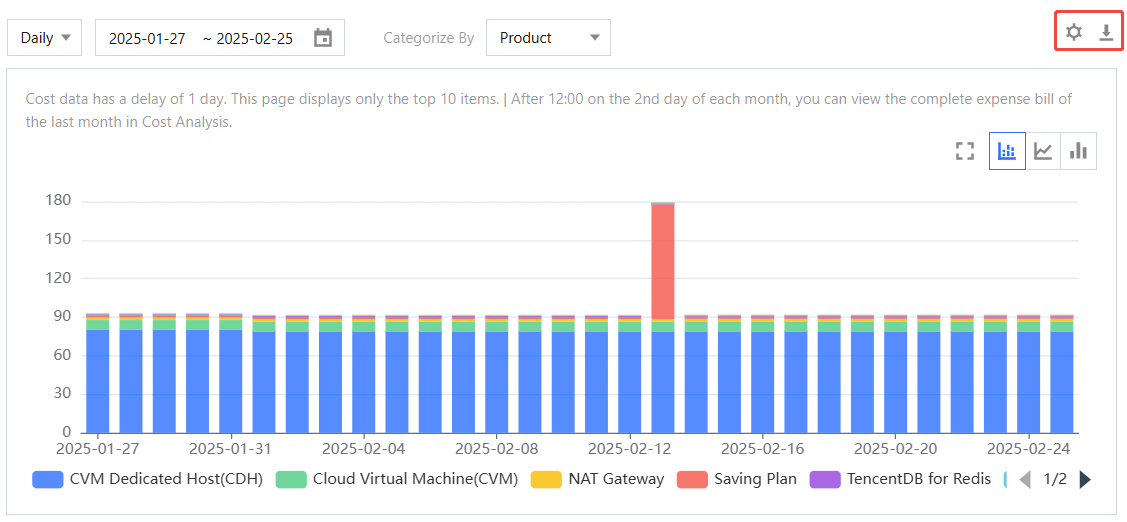
In the cost analysis chart, only display the TOP 10 projects, with the remaining projects summarized as "other". Detailed data is exportable for viewing.
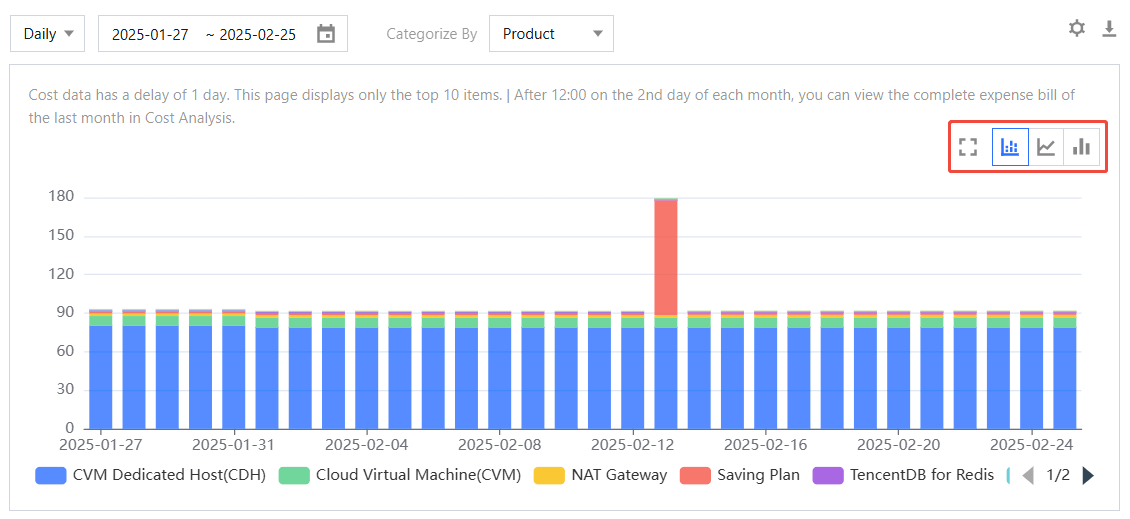
Chart types
You can change the chart type to stacked bar chart, line chart, and bar chart, and supports display in full screen.
Table Data
The detailed cost data supports pagination queries and downloads. If needed, click Download to download data.
Note:
The Settings button allows for the customization of table row height and shading, as well as the number of decimal places in charts (supports two and eight places).
After selecting the growth rate as needed, click download button. The downloaded data includes total cost summary by categorization dimensions, growth rate calculation data by categorization dimensions in two sheets.
Advanced filters
Manual Filtering
AI Filter
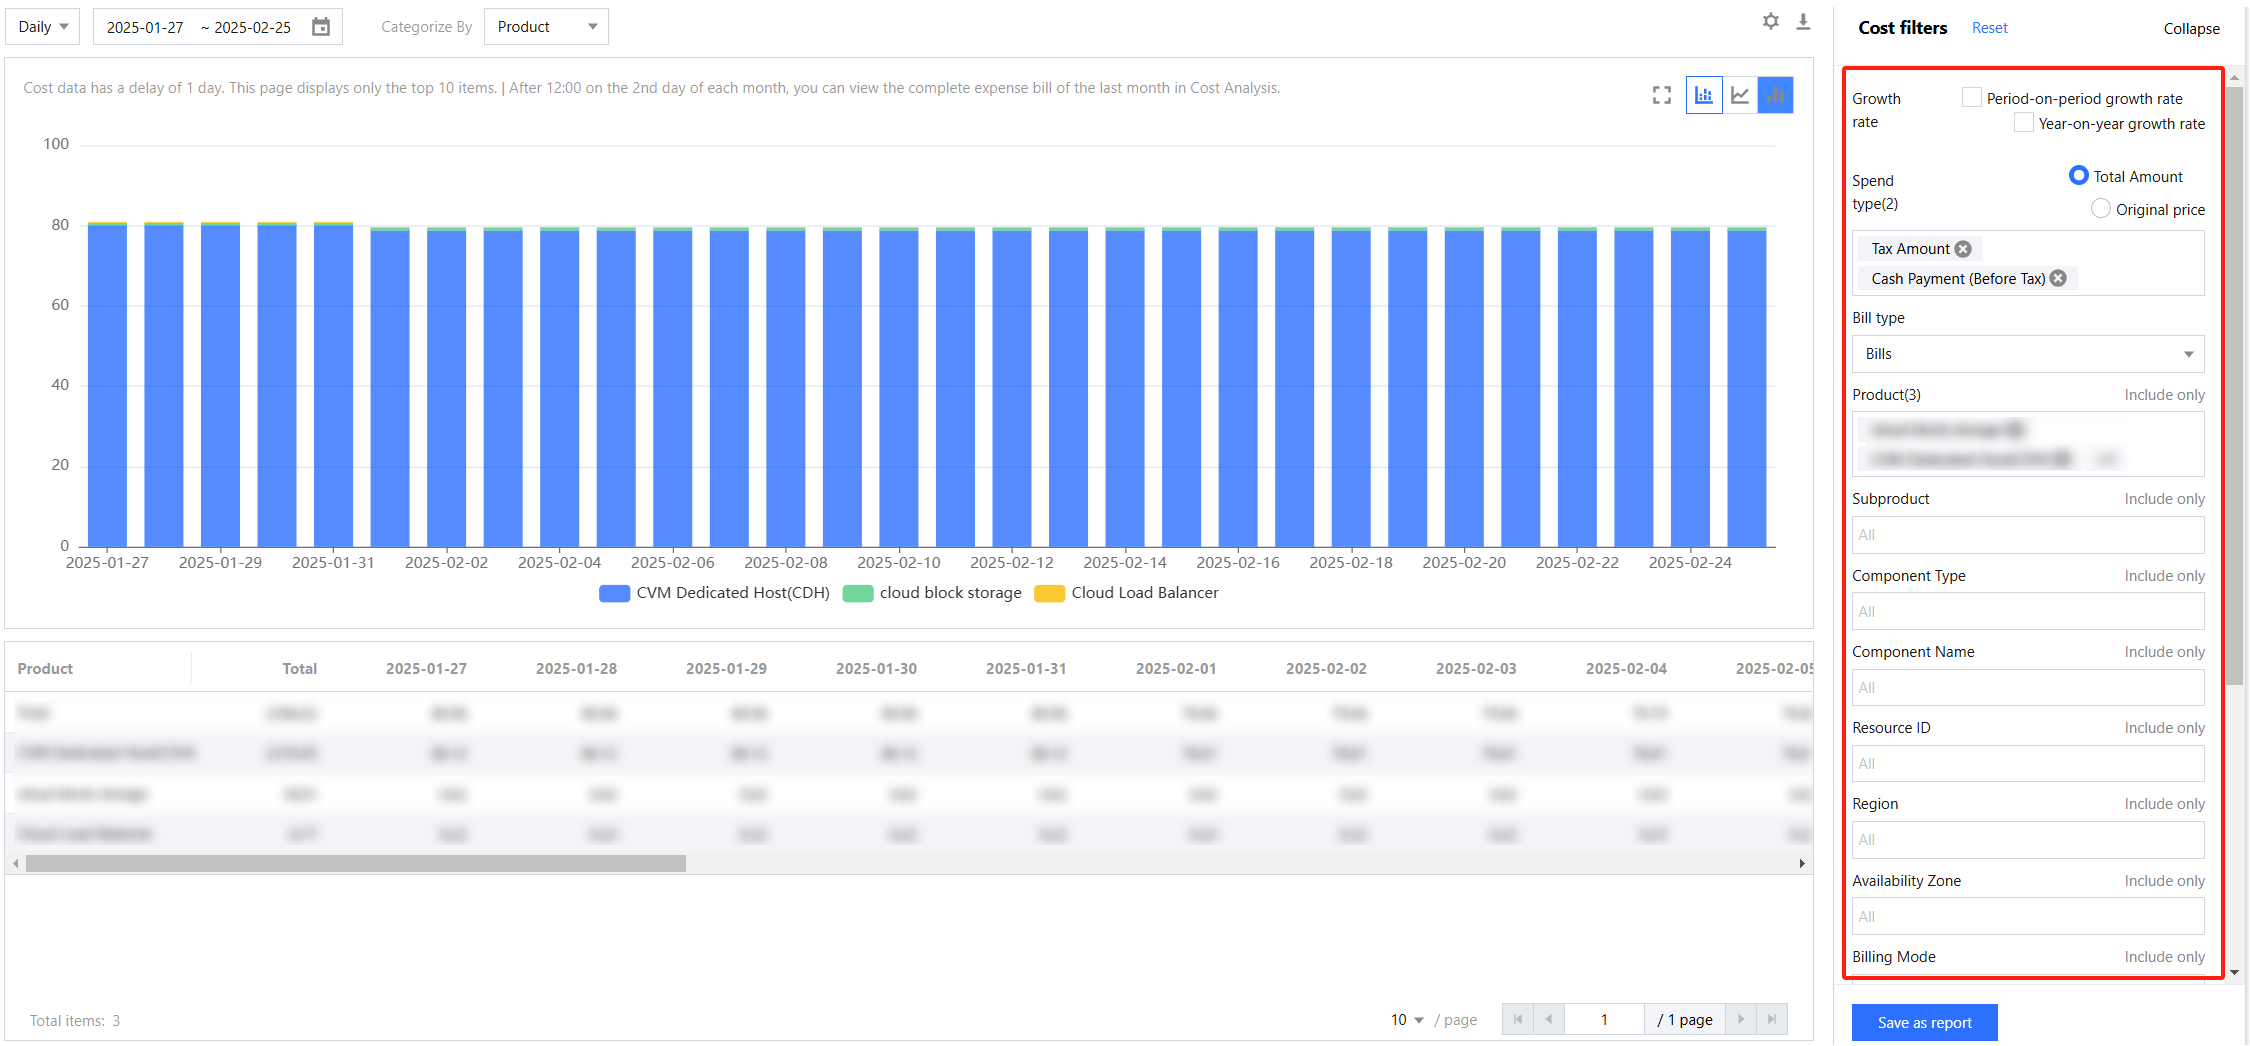
Advanced filters allow you to further refine the target costs you want to display. You can filter costs by selecting multiple criteria to be included or excluded.
Advanced filtering capabilities include MoM growth rate, YoY growth rate,spend type, bill type, product, sub-product, component type, component name, resource ID, region, availability zone, billing mode, transaction type/consumption type, tag, project, payer account, user account, and cost allocation unit. Advanced filtering supports multi-dimensional combination multiple selection and exclusion selection.
Note:
The cost analysis interface only shows the cost of the login account by default. You can check other payer accounts and user accounts to add in advanced filtering.
MoM/YoY Growth Rate
The MoM/YoY rate data information will be displayed in the cost analysis data.
Month-over-month: It compares with the previous adjacent statistical cycle, indicating the development and change of statistical indicators from period to period. Month-over-month focuses on reflecting the short-term changes in data. When using the month-over-month growth rate to reflect indicator changes, it has strong timeliness and is sensitive.
Year-on-year: It compares with the same period of the previous year, that is, comparing a certain time period of this year with that of the same period last year. It can be understood as the comparison between the nth month of this year and the nth month of last year. Compared with month-over-month, it focuses on reflecting long-term trends and can overcome the influence of seasonal fluctuations to a certain extent.
For the same field, when both historical development trends and short-term changes need to be considered, it is recommended to conduct comparative analysis by putting year-on-year and month-over-month together.
The calculation formula is:
Growth rate = (Current period cost data - Previous period cost data) / Previous period cost data * 100%
Year-on-year rate = (Current period cost data - Same period cost data of the previous year) / Same period cost data of the previous year * 100%
Detailed description of month-over-month/year-over-year calculation for different time granularities:
Time Granularity
Month-over-month
Year-on-Year
Monthly
Cumulative comparison with last month
Calculate the year-on-year indicator: cumulative comparison of this month with the same period last year.
Daily
Compared with the previous day
Calculate the month-on-month indicator: compared with the same day of the previous month. In day-on-day comparison, if the amount for the current day cannot be found for the same day of the previous month, for example, if data for April 31st cannot be found when comparing with May 31st, obtain it according to the proximity principle and compare it with the data of April 30th.
By hour
Compared with the previous hour
Calculate the daily year-on-year indicator: compared with the same hour of the previous day.
Note:
If there is no data or the data is 0 in the previous period, the year-on-year and month-on-month rates are displayed as -. The calculation result is rounded to two decimal places, such as 88.88%.
Note that when querying by hour, the fee for the last hour of yesterday needs to be updated on T+2, so the growth rate corresponding to the last hour is -.
Spend types and bill types
Spend types and bill types are integrated into standard analytical dimensions, supporting categorized summary queries and advanced filtering.
Spend Type: The default display is the total amount (the total price after discounts), which can be broken down into payment types such as cash, coupons, and gift money in the categorized summary. You can switch to the original price, and the data will reflect the original price bill, allowing for a comparison of the original price and the total cost difference in the categorized summary.
Note:
Under the original price spend type, the original price amount corresponding to the refund item will be the actual refund amount after discount.
Bill Type: You have the option to toggle between bills and consumption bills (which needs to be enabled first). In the classification summary, both can be compared side by side on the same screen.
The default combination is total cost + expense bill, suitable for normal cost analysis scenarios. Switch to consumption bill for amortization perspective requirements, or switch to cash payment to analyze cash flow expenses, as well as other specific requests.
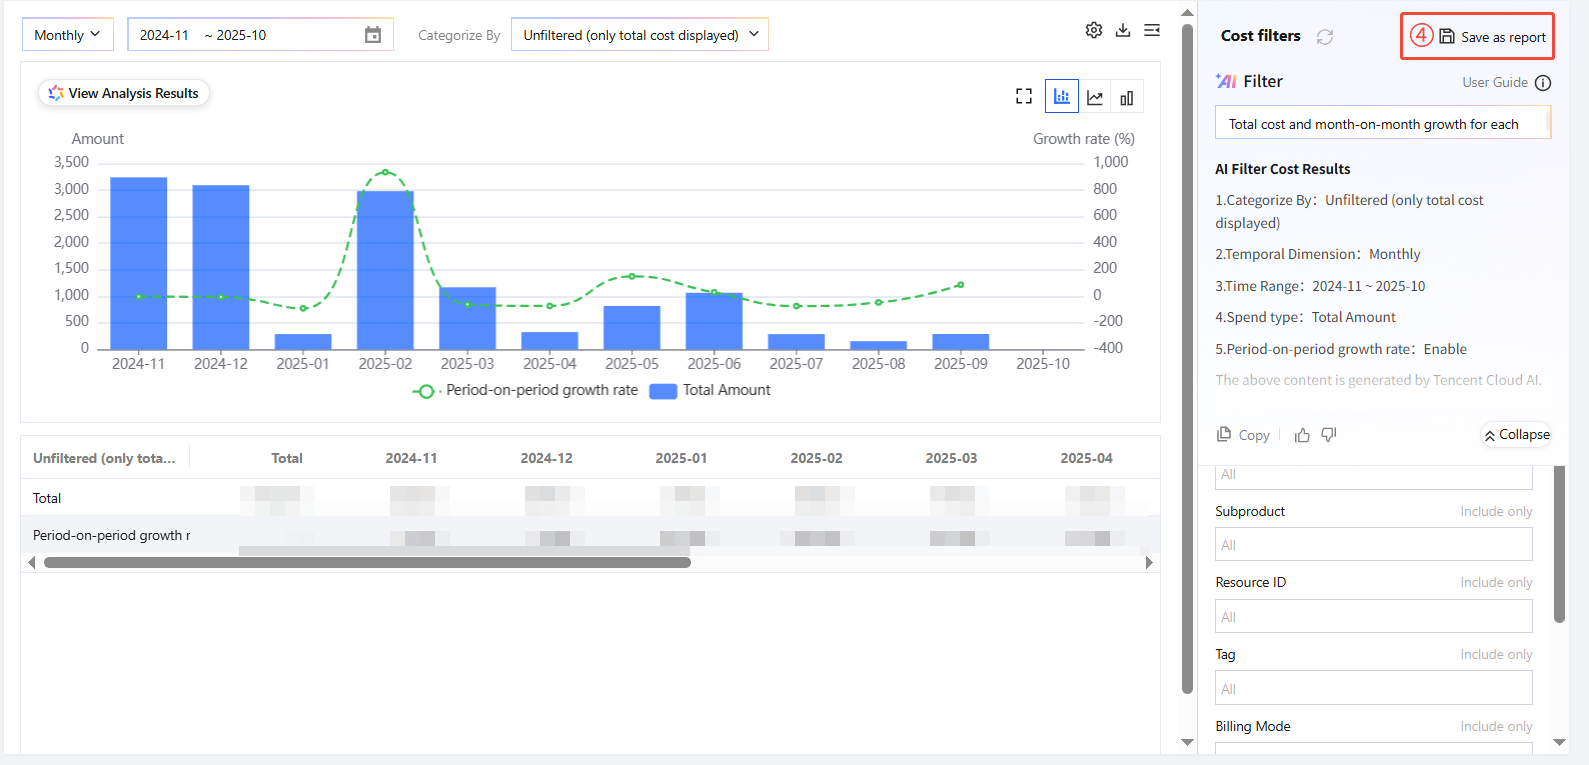
Cost analysis AI Filter uses intelligent algorithms and AI technology to create a smart semantic parsing engine. Users describe cost analysis demands in natural language, and the AI intelligently matches cost filter criteria to generate visual data insight views, achieving a "what you think is what you get" interaction experience while significantly reducing data query and analysis costs. It also supports one-click saving of analysis paths and generating standardized cost report templates, enabling seamless transition from ad hoc queries to systematic monitoring. This allows users to easily start cloud financial management, effectively improving enterprise cloud financial management efficiency and experience.
Operation Steps
1. Log in to the Billing Center > Cost Explorer page, enter your cost analysis needs (such as "overall cost by month for the past year") in the input box under Cost filters > AI Filter, then click Search.
2. AI will offer the following content:
Accurate filtering: Automatically match data that meets the criteria.
Intelligent aggregation: Generate a statistical summary of key metrics (such as total amount, classification dimension, time range).
Exclusive information filtering: Project, payer account, user account, and cost allocation unit are your exclusive or custom fields. Filtering requires exact input. For example: What was the total cost for user account=100005678 last month? What are the expense details for project="marketing activity" in Q2?
Tag filtering (key-value pair): Tags are stored in the format "key=value". When entering, you must specify both the key and value.
Single-key multi-value: Multi-key is not supported. Only one Tag key can be filtered at a time. The same Tag key can match multiple values (for example: department="Operations Department, Marketing Department").
For example: What was the expense for Tag key="department", value="Operations Department" last month? What is the cost for Tag key="project type", value="R&D, test" this quarter?
If your query does not specify the following dimensions, the system will display data by default:
Time range: Last 6 months (rollover period)
Statistical granularity: Summarize by month.
Data caliber: Billing statement caliber.
Fee type: Total fee.
Analytical perspective: Category statistics by product dimension.
3. You can perform the following operations on the filtered results: data replication, feedback evaluation (like and dislike).
4. Save report: If needed, you can click Save as report in the top right corner of the cost filter to save the AI intelligent filtering results as an official report, making it easy for subsequent reading and sharing.
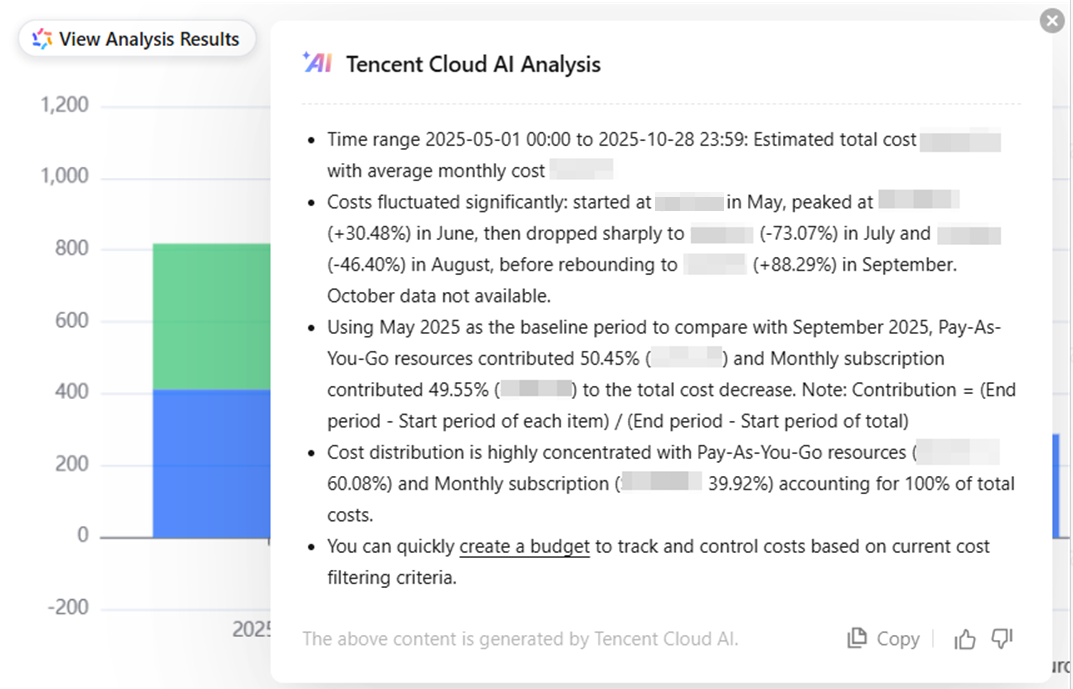
AI Analysis
AI cost analysis is centered on FinOps, leveraging AI Intelligent Identification to detect cost fluctuation patterns (overall cost, cost trend, cost drivers, and cost concentration) across dimensions, locate core consumption scenarios, and output structured text summaries. This enables performance enhancement from basic data querying to in-depth insights for decision-making.
Operation Guide
On the Cost Explorer webpage, click Analyze Cost. Tencent Cloud AI will perform intelligent analysis based on your cost data and generate a structured analysis report to help you quickly gain insights into the cost situation.
You can also perform the following quick actions on the Tencent Cloud AI result page:
One-click budget creation: Quickly generate budgets based on criteria and monitor cost anomalies in real time.
Anomaly detection: Click to view cost fluctuation anomalies identified by the system and root cause recommendations.
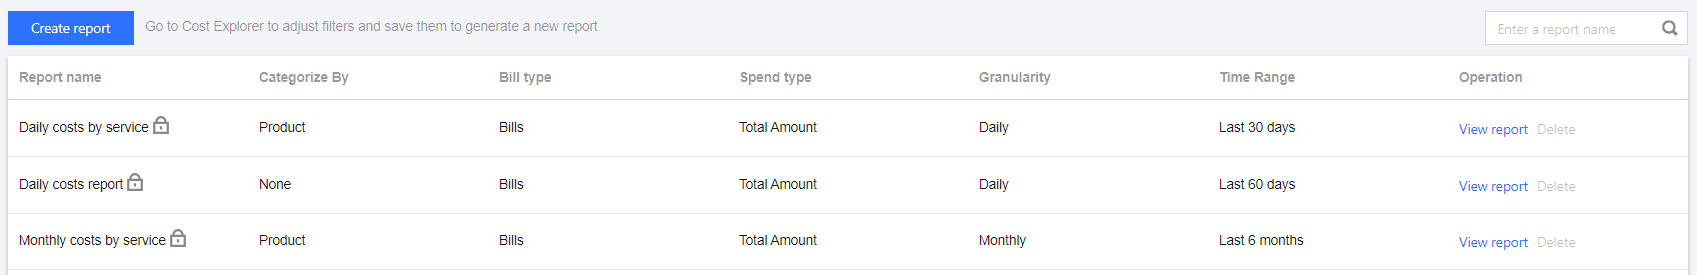
Cost Report Overview
The cost report feature allows you to save the results of cost analysis as a report that can be easily referenced and shared. Reports can be saved in the cost analysis interface, supporting multi-member reports, and also allow re-editing or deletion.
The report will save all the settings you configured in Cost Explorer. If the time is set to a relative time period, the cost report will be updated automatically.
Tencent Cloud provides customers with three preset default reports: Daily costs by service, Daily costs report, and Monthly costs by service. They can be viewed on the cost report webpage and do not support modification or deletion.
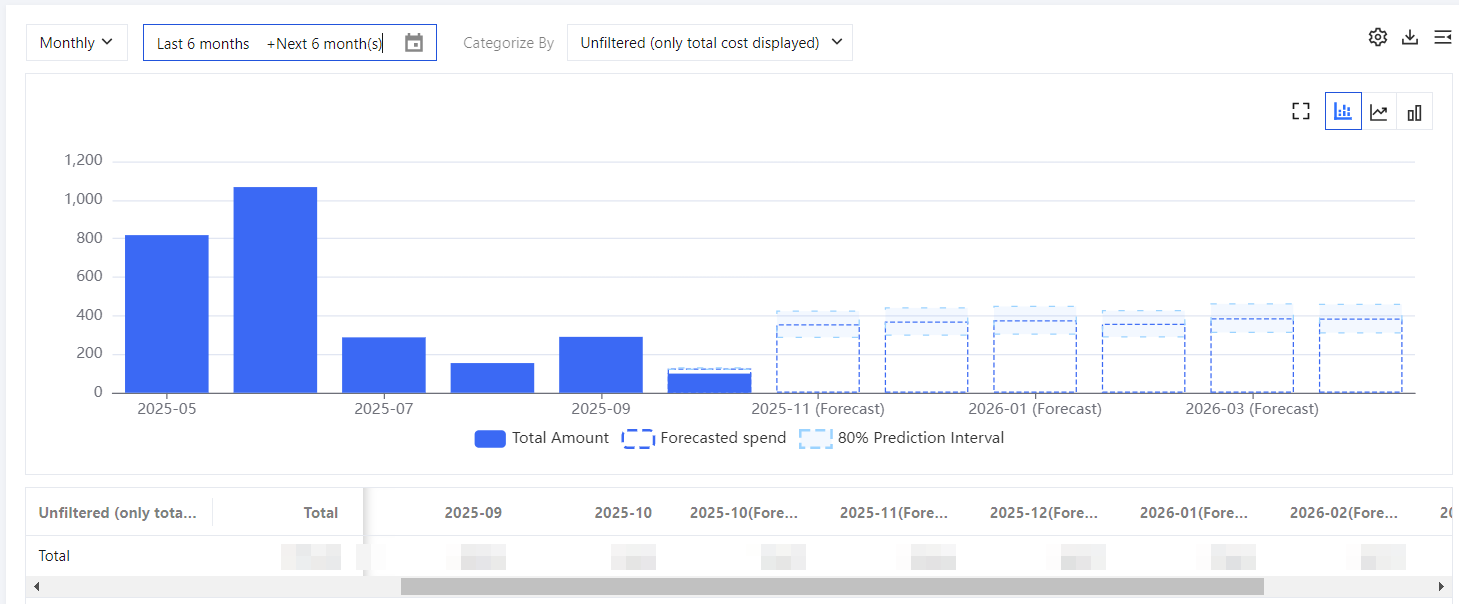
Spend Projection
The spend projection feature predicts your future cloud costs based on your historical consumption in Tencent Cloud using AI technology and machine learning algorithms. It meets your need for forecasting upcoming costs, helping you understand and manage cloud costs in advance.
Feature Description
Prerequisite: The user's daily consumption bill for the past 60 days must exceed 1 CNY; otherwise, there will be insufficient data to perform the prediction.
Bill caliber: Supports billing statement and consumption bill two kinds of calibers, default is billing statement.
Data caliber: Spend projection only supports total cost projection and display.
Time granularity: Spend projection supports day-level and month-level time granularity, but no support for hour-level time granularity.
Classification dimension: Spend projection only supports total dimension and does not support filtering and presenting by other classification dimensions.
Time range: Supports predicting cost up to 12 months in the future.
Note:
The projection data in cost analysis is for reference only. Support viewing data for up to 24 months.
Operation Steps
You can log in to the Tencent Cloud Billing Center, click Cost Management > Cost Explorer in the left sidebar to enter the cost analysis webpage. If the selected start date or end date is later than the current day/month, the spend projection will appear. The line chart and histogram for the current month show actual fee as a solid line and predicted fee as a dotted line.