
Monitoring Metric Details

Last updated: 2025-09-19 15:58:29
Feature Description
TDMQ for CKafka provides a comprehensive, multidimensional monitoring metrics system, covering each level from instances to topics and consumption groups, helping you gain real-time insights into resource running states. This document describes the meanings of CKafka monitoring metrics and recommends key focus metrics. Through these metrics, you can quickly grasp the health status of resources such as instances and determine whether scaling or other operational tasks are required to ensure stable operation.
Namespace
Namespace=QCE/CKAFKACluster Health Status Description
A CKafka cluster has three health statuses: Healthy, Alarm, and Anomaly. The system performs regular inspections on each cluster. The inspection program checks the number of connections, disk usage percentage, production peak bandwidth, and consumption peak bandwidth of the cluster. When these metrics exceed certain thresholds, different health statuses will be generated.
If the cluster status is abnormal, you can view the corresponding monitoring metric details on the monitoring page in the console to troubleshoot. If you need to further check cluster load monitoring, you can view relevant information on the advanced monitoring page (currently, only Pro Edition instances support advanced monitoring capacity).
Metric | Threshold (N) | Status Description |
number of connections (default maximum value 50000) | N ≤ 80% | Health |
| 80% < N ≤ 95% | Alarm |
| N > 95% | Abnormal |
Disk usage percentage | N ≤ 80% | Health |
| 80% < N ≤ 95% | Alarm |
| N > 95% | Abnormal |
Production peak bandwidth (excluding replica bandwidth) | N ≤ 80% | Health |
| 80% < N ≤ 100% | Alarm |
| N > 100% | Abnormal |
Consumption peak bandwidth | N ≤ 80% | Health |
| 80% < N ≤ 100% | Alarm |
| N > 100% | Abnormal |
Note:
The default maximum number of connections is 50,000. Threshold judgment is based on the percentage of the maximum value. If instance connections exceed the maximum value, the client cannot create new connections. If the maximum value cannot meet needs in actual business, you can contact us to apply for an increase in quota.
Basic Monitoring Metrics
CKafka basic monitoring capability supports instance, Topic, and Consumer Group monitoring metrics across three dimensions. It is suitable for basic ops scenarios such as abnormal issue detection and cluster capacity planning. The following is the description of monitoring metrics provided by CKafka basic monitoring capability. Please configure monitoring and alarm policies properly based on actual business needs.
Note:
The content in the table below is consistent with Tencent Cloud Observability Platform (TCOP) to ensure consistency of your data when submitting and when an alarm is generated. Partially, time granularity is not shown in the CKafka console. You may further view specific data in TCOP.
Monitoring Metrics | Parameter | Unit | Description |
Maximum production traffic of an instance | InstanceMaxProFlow | MB | Peak message bandwidth of a single replica in an instance, excluding replica production bandwidth (reference for calculating instance production bandwidth usage percentage), take the maximum value per unit time. |
Instance production traffic | InstanceProFlow | MB | Instance production traffic (excluding traffic generated by replicas), summed according to the selected time granularity. |
Instance Production Bandwidth Percentage | InstanceProduceBandwidthPercentage | % | Instance production bandwidth usage as a percentage of quota, averaged over unit time. |
Maximum consumption traffic of the instance | InstanceMaxConFlow | MB | Peak bandwidth of instance consumption messages, with no concept of replicas when consuming (reference for calculating instance consumption bandwidth usage percentage), take the maximum value per unit time. |
Instance consumption traffic | InstanceConFlow | MB | Instance consumption traffic (excluding traffic generated by replicas), summed according to the selected time granularity. |
Instance consumption bandwidth percentage | InstanceConsumeBandwidthPercentage | % | Instance consumption bandwidth as a percentage of quota, averaged over unit time. |
Instance Production Message Count | InstanceProCount | Count | Number of messages produced in the instance, summed according to the selected time granularity. |
Number of messages consumed by the instance | InstanceConCount | Count | Number of messages consumed by the instance, summed according to the selected time granularity. |
Total number of messages written to disk by instance | InstanceMsgCount | Count | Total number of messages written to disk by instance (excluding replicas), taking the latest value by the selected time granularity. |
Group message request rate | InstanceTps | Count/s | Cluster instance request rate, including production, consumption, metadata, and offset submission, averaged over unit time. |
Cluster TPS details | BMetadataRequestsPersecOneminuterate BProduceRequestsPersecOneminuterate BFetchConsumerRequestsPersecOneminuterate BOffsetCommitRequestsPersecOneminuterate | Count/s | Cluster TPS changes, averaged over unit time. |
Instance disk usage | InstanceMsgHeap | MB | Instance disk usage (including replicas), taking the latest value by the selected time granularity. |
Disk usage percentage | InstanceDiskUsage | % | The percentage of the current disk usage to the total disk capacity of the instance specification, calculated as the average over unit time. |
Instance production throttling times | InstanceProduceThrottle | Count | Instance production throttling times, summed according to the selected time granularity. |
Instance consumption throttling times | InstanceConsumeThrottle | Count | Instance consumption throttling times, summed according to the selected time granularity. |
Number of instance connections | InstanceConnectCount | Count | Number of client connections to the server, summed according to the selected time granularity. |
Topic Monitoring
Monitoring Metrics | Parameter | Unit | Description |
Maximum production traffic of a Topic | TMaxProduceFlow | MB/s | Maximum production traffic of a Topic (excluding replica traffic), take the maximum by selected time granularity. |
Maximum consumption traffic of a Topic | TMaxConsumeFlow | MB/s | Maximum consumption traffic of a Topic, take the maximum by selected time granularity. |
Topic consumption message count | CtopicConCount | Count | The actual number of consumed messages of the topic is summed according to the selected time granularity. |
Topic consumption traffic | CtopicConFlow | MB | The actual consumption traffic of the topic (excluding the traffic generated by the replica) is summed according to the selected time granularity. |
Total amount of messages occupying disk for the Topic | CtopicMsgHeap | MB | The total amount of messages occupied by the topic on disk (excluding replicas), with the latest value taken according to the selected time granularity. |
Number of messages produced in the Topic | CtopicProCount | Count | The actual number of messages produced by the topic is summed according to the selected time granularity. |
Topic production traffic | CtopicProFlow | MB | The actual production traffic of the topic (excluding the traffic generated by replicas) is summed according to the selected time granularity. |
Total number of messages written to disk for the Topic | CtopicMsgCount | Count | Actual total number of messages written to disk for the Topic (excluding replicas), taking the latest value by the selected time granularity. |
Topic consumption throttling count | TTopicConsumeThrottle | Count/s | Topic consumption throttling count, calculate the average by selected time granularity. |
Topic production throttling count | TTopicProduceThrottle | Count/s | Topic production throttling count, calculate the average by selected time granularity. |
Topic-Partition Monitoring
Monitoring Metrics | Parameter | Unit | Description |
Partition consumption message count | PartitionConCount | Count | Actual number of messages consumed by the Partition, summed according to the selected time granularity. |
Partition Consumption Traffic | PartitionConFlow | MB | Actual consumption traffic of the Partition (excluding traffic generated by replicas), summed according to the selected time granularity. |
Total number of messages written to disk for the Partition | PartitionMsgCount | Count | Actual number of messages written to disk for the Partition (excluding replicas), summed by the selected time granularity. |
Total amount of messages occupying disk for the Partition | PartitionMsgHeap | MB | Total amount of messages actually occupying disk for the Partition (excluding replicas), summed by the selected time granularity. |
Number of messages produced in the Partition | PartitionProCount | Count | Actual number of messages produced in the Partition, summed according to the selected time granularity. |
Partition production traffic | PartitionProFlow | MB | Actual production traffic of the Partition (excluding traffic generated by replicas), summed according to the selected time granularity. |
Consumer Group-Topic Monitoring
Monitoring Metrics | Parameter | Unit | Description |
Topic maximum offset | MaxOffsetTopic | not applicable | The maximum offset of all partitions in the current topic, take the maximum by selected time granularity. |
Topic consumption offset (distinguishing offset maximum value) | CtopicMsgOffset | not applicable | The maximum offset consumed by the consumer group in all partitions of the current topic, take the maximum by selected time granularity. |
Number of unconsumed messages in the topic | CtopicUnconsumeMsgCount | Count | Total number of unconsumed messages in all partition consumer groups of the current topic, summed by selected time granularity. |
Topic consumption speed | CtopicConsumerSpeed | Count/min | Sum of consumption rates of all partition consumer groups of the current topic, summed by selected time granularity. |
Consumer Group-Partition Monitoring
Monitoring Metrics | Parameter | Unit | Description |
Partition consumption speed | CpartitionConsumerSpeed | Count/min | The consumption rate of the consumer group in the partition (items/minute). |
Current consumption offset | CpartitionOffset | / | Consumer group: The current consumption offset of the partition. |
The maximum offset of the current partition | CpartitionMaxOffset | / | The maximum offset of the current partition. |
Number of unconsumed messages | CpartitionUnconsume | Count | The number of unconsumed messages in the partition by the consumer group. |
For monitoring API details, see the following documents: Topic Monitoring, Instance Monitoring, Consumption Group Monitoring.
Advanced Monitoring Metrics (Professional Edition)
CKafka Pro Edition clusters support advanced monitoring capabilities in addition to basic monitoring metrics. You can view node-level monitoring metrics through advanced monitoring for business troubleshooting scenarios such as issue localization, throttling analysis, and duration analysis. The following is the introduction and description of all monitoring metrics provided by CKafka advanced monitoring.
Monitoring Metrics | Description | Normal Value Range | Handling Suggestion |
Broker node liveness | The service status of each Broker node is detected by the heartbeat mechanism to check node availability. | Normal value is 100%. If the node live rate is less than the normal value, meaning Broker downtime exists, it will trigger ISR shrinkage. | When the node status is abnormal, it is advisable to immediately restart the faulty node and check system resource utilization. If restart fails multiple times, contact online customer service. |
cluster load | Overall cluster load situation, taking the maximum value among all nodes. | Single availability zone deployment, cluster load < 70%. For 2-AZ deployment, cluster normal load < 35%. For 3-AZ deployment, cluster normal load < 47%. If bandwidth utilization is low but cluster load is high, perform cluster bandwidth expansion combined with cluster load metrics. | When the load is too high, upgrade the cluster bandwidth specification. See Cluster Capacity Planning Practical Tutorial. |
Monitoring Metrics | Description | Normal Value Range | Handling Suggestion |
network idle degree | Used to measure the remaining IO resources for concurrent processing in the current instance network. The closer to 1, the more idle. | The value normally fluctuates between 0.5 and 1. Less than 0.3 indicates high load. | When the value remains below 0.3, check the instance bandwidth utilization and disk usage percentage via console monitoring. If bandwidth exceeds 80%, upgrade the configuration for expansion. If disk usage percentage exceeds 80%, adjust disk capacity or enable disk water level processing policy. For scale-out operations, see Upgrade Cluster Specifications; to enable disk water level processing policy, see Configure Disk Water Level Processing Policy. |
request queue depth | The number reflects unprocessed production requests. If the value is too large, it might be due to high request volume at the same time, CPU overload, or a disk I/O bottleneck. | If it remains equal to 2000, it means the cluster load is relatively high. Less than 2000 can be ignored, no impact. | When client production consumption times out but the Cloud Virtual Machine workload remains normal, it indicates the request queue of a single server has reached the upper limit. By default, the request queue length of a single node Broker is configured to 500, which can be adjusted based on the purchased resource configuration (contact online customer service). |
number of unsynchronized replicas | The number of unsynced replicas in the cluster. If an instance has unsynced replicas, it means the cluster's health status may be problematic. | To ensure normal running of the instance, CKafka sets up some built-in topics. These topics may be offline in some cases, but will be counted into the number of unsynchronized replicas, which does not impact normal business operation. Normally, the number of unsynchronized replicas should be below 5. If the curve water level remains above 5 for a long time, it means processing is needed. Broker occasionally fluctuates, the curve value spikes, then returns to stable after a period of time, which is normal. | When the curve water level remains above 5 for a long time, it represents unsynchronized replicas in the cluster, typically caused by Broker node exceptions or network factors. The cause can be located through Broker logs. |
ZK disconnection count | The number of persistent connection disconnections and reconnections between Broker and ZooKeeper. Network fluctuation or high cluster load may cause disconnection and reconnection, during which Leader Switch may occur. | No normal value range. This value is a cumulative sum, increasing by 1 after each disconnection since Broker startup, and only resets to 0 when Broker restarts. ZK disconnection count is cumulative. A higher count does not indicate a cluster issue. Monitor the ZK disconnection frequency. If disconnections occur frequently, further investigation is required. | Check the cluster load in the console to see if it exceeds 80%. If the threshold is exceeded, upgrade the cluster bandwidth specification. For specific operations, see Upgrade Cluster Specifications. |
ISR expansion count | ISR (In-Sync Replica) refers to the collection of Follower replicas that remain synchronized with the Leader Replica. When the Kafka ISR expansion count exists for an unsynced Replica, the count increases by 1 once the unsynced Replica catches up with the Leader data and rejoins the ISR. | No normal range. Expansion occurs when cluster fluctuations appear. Infrequent fluctuations (e.g., fewer than 3 per hour) require no intervention. If the value continuously increases, troubleshooting is required. | Keep the cluster load water level below 80%. If it exceeds this threshold, upgrade the cluster specifications. For specific operations, see Upgrade Cluster Specifications. If the cluster water level is normal, the client can optimize production end parameters, adjust linger.ms to not 0, set ack=1 at the same time, and ensure throughput while reducing cluster sync pressure. If ISR occurs frequently, production or consumption is affected, and prolonged unrecovery occurs, contact us. |
ISR contraction count | Kafka ISR contraction count refers to the count statistics of ISR shrinking when Broker downtime or ZooKeeper reconnection occurs. | No normal range. Contraction occurs when cluster fluctuations appear. Instantaneous fluctuations have no impact. If they occur frequently over the long term, need to check. | Keep the cluster load water level below 80%. If it exceeds this threshold, upgrade the cluster specifications. If the cluster water level is normal, recommend manually partitioning and balancing high load partitions. For messages with keys, set a partitioning policy to ensure balanced writes. If a single partition becomes a bottleneck, add partitions to improve the degree of parallelism for writes. |
Instance Broker storage utilization | Maximum disk usage of each Broker in the cluster per unit time. | The value is generally between 0-100%. If the value reaches over 80%, it needs to be fixed. | Upgrade storage specification, reserve 30% disk buffer space. |
Monitoring Metrics | Description | Normal Value Range | Handling Suggestion |
Broker node production throttling count | Number of times each Broker node triggers production traffic throttling. | No normal value range. A small amount of burst traffic throttling is normal and has no impact on business, with no need for special attention. If it occurs frequently and continuously, further investigation is required. | Check the bandwidth utilization. If the production flow exceeds 80% of the bandwidth specification, perform an upgrade. For specific operations, see Upgrade Cluster Specifications. Ensure partitions are an integral multiple of nodes, with no write bottleneck in a single partition. If a bottleneck occurs, adjust the partitioning policy to guarantee balanced writes. Enable the automatic scaling feature for disk water level processing. For specific operations, see Configure Disk Water Level Processing Policy. |
Broker Node Production Traffic (MB) | Production flow of each Broker node. | No normal range, fluctuates according to business and purchase specs. General production flow occasionally exceeding bandwidth specification for purchase requires no special attention. If it continues to exceed the purchase specification, further operation is needed. | Recommend upgrading the bandwidth specification, reserving at least 20% buffer interval. For specific operations, see Upgrade Cluster Specifications. If a single node remains high-risk, confirm if there is an imbalance in writes, such as when messages are configured with a key, and optimize the imbalance issue. |
Maximum production traffic (Bytes/s) | Maximum production traffic of each Broker node. | No normal range, fluctuates according to business and purchase specs. General peak production traffic occasionally exceeding purchase specs requires no special attention. If it continues to exceed the purchase specification, further operation is needed. | Recommend upgrading the bandwidth specification, reserving at least 20% buffer interval. For specific operations, see Upgrade Cluster Specifications. If a single node remains high-risk, perform manual partition balancing. |
Production Traffic Usage Rate by Single Broker (%) | Production Traffic Usage Rate by Single Broker (% of Purchased Traffic) | The value is generally between 0-100%. Peak occupancy rate in a short time may be a normal business symptom, no need for special attention. If the occupancy rate remains relatively high long-term, further processing is recommended. | If the value remains above 80% long-term, it is recommended to upgrade the specifications. For specific operations, see Upgrade Cluster Specifications. |
Production Total Duration | The total time consumed by production requests is summarized from metrics such as reply queue, delayed packet response, fetch request duration, local processing, and request queue duration. At each time point, the total time is not equal to the sum of the five durations because each metric is obtained by averaging respectively, hence non-accumulating and not equals. | The value ranges between 0 - 100ms, and when the data volume is large, a duration of 0 - 1000ms falls within the normal range. As long as it does not exceed 1000ms for an extended period, no need to handle. If it continues to exceed 1000ms, further investigation is recommended. | Keep the cluster load water level below 80%. If it exceeds this threshold, upgrade the cluster specifications. For specific operations, see Upgrade Cluster Specifications. If the cluster water level is normal, attempt to optimize production parameters by setting ack to -1 and adjusting linger.ms to a non-zero value for write optimization. |
Request queue duration | The time a production request waits in the queue of requests to be received indicates the request waits for follow-up processing. | The value ranges between 0 - 50ms, and when the data volume is large, a duration of 0 - 200ms falls within the normal range. As long as it does not exceed 200ms for an extended period, no need to handle. If it continues to exceed 200ms, further investigation is recommended. | Keep the cluster load water level below 80%. If it exceeds this threshold, upgrade the cluster specifications. For specific operations, see Upgrade Cluster Specifications. If the cluster water level is normal, attempt to optimize production parameters by setting ack to -1 and adjusting linger.ms to a non-zero value for write optimization. |
Local processing duration | The time when the production request is processed by the Leader Broker, from taking the request packet out of the request queue to writing it into the local page cache. | The value ranges between 0 - 50ms, and when the data volume is large, a duration of 0 - 200ms falls within the normal range. As long as it does not exceed 200ms for an extended period, no need to handle. If it continues to exceed 200ms, further investigation is recommended. | Recommend using a cluster with SSD disk storage. For batch writing scenarios, it is advisable to increase batch.size and linger.ms to optimize batch efficiency. |
Waiting duration | The time taken for production requests to wait for data sync. This value is only above 0 when client ack = -1. As long as ack = 1 or 0, the value remains 0. | The value ranges between 0 - 200ms, and when the data volume is large, a duration of 0 - 500ms falls within the normal range. Cross-availability zone instances have higher values when ack = -1 compared to non-cross-availability zone instances. Refer to Cross-AZ Deployment. As long as it does not exceed 500ms for an extended period, no need to handle. If it continues to exceed 500ms, further investigation is recommended. | Reduce the number of replicas (ack=1 takes precedence to protect production and throughput). |
delayed response duration | The time taken for production requests to receive delayed system responses. This value remains 0 if the traffic volume of the instance does not exceed the purchased traffic. If rate limited, it will be above 0. | When the instance is not overloaded, this value remains 0 long-term. If the instance exceeds the limit, it will be delayed for 0 to 5 minutes based on the percentage exceeded, with a maximum value of 5 minutes. | When the value remains above 0, enable traffic throttling on the production side and check the burst traffic source. If the limit is continuously exceeded, upgrade and expand the bandwidth. For specific operations, see Upgrade Cluster Specifications. |
response packet queue duration | The waiting duration of a production request in the response packet queue indicates the request packet waits to be sent to the client. | The value ranges between 0 - 50ms, and when the data volume is large, a duration of 0 - 200ms falls within the normal range. As long as it does not exceed 200ms for an extended period, no need to handle. If it continues to exceed 200ms, further investigation is recommended. | Check network congestion and the number of TCP connections, optimize connection reuse on the production side, and reduce the water level at the producer's current node. |
95th percentile of delayed response duration | 95% of production requests have a system latency response time less than this value. | When the instance is not overloaded, this value remains 0 long-term. If the instance exceeds the limit, it will be delayed for 0 to 5 minutes based on the percentage exceeded, with a maximum value of 5 minutes. | This scenario generally appears in traffic limiting, need confirmation whether exceeds bandwidth and the condition. If it continues to exceed, it needs to be processed and can be addressed by upgrading specifications. For specific operations, see Upgrade Cluster Specifications. |
Monitoring Metrics | Description | Normal Value Range | Handling Suggestion |
Broker node consumption throttling count | Number of times each Broker node triggers consumption throttling. | No normal value range. A small amount of burst traffic throttling is normal and has no impact on business, with no need for special attention. If throttling occurs frequently and continuously, further investigation is required. | Check the bandwidth utilization. If the consumption traffic exceeds 80% of the specification, perform scaling out. For scale-out operations, see Upgrade Cluster Specifications. Enable the automatic scaling feature for disk water level processing. For details, see Configure Disk Water Level Processing Policy. |
Broker Node Consumption Traffic (MB) | Consumption traffic of each Broker node. | No normal range, fluctuates according to business and purchase specs. General production traffic occasionally exceeding purchase specs requires no special attention. If it continues to exceed the purchase specification, further processing is needed. | Recommend upgrading the bandwidth specification, reserving at least 20% buffer interval. For scale-out operations, see Upgrade Cluster Specifications. Enable elastic bandwidth. For specific operations, see Enable Elastic Bandwidth. |
Maximum consumption traffic (Bytes/s) | Maximum consumption traffic of each Broker node. | No normal range, fluctuates according to business and purchase specs. General peak production traffic occasionally exceeding purchase specs requires no special attention. If it continues to exceed the purchase specification, further processing is needed. | Recommend upgrading the bandwidth specification, reserving at least 20% buffer interval. For scale-out operations, see Upgrade Cluster Specifications. Enable elastic bandwidth. For specific operations, see Enable Elastic Bandwidth. |
Consumption Traffic Usage Rate by Single Broker | Consumption Traffic Usage Rate by Single Broker (% of Purchased Traffic) | The value is generally between 0-100. If the value remains above 80 for a long time, consider upgrading the configuration. | If the value remains above 80% long-term, it is recommended to perform an upgrade operation. For specific operations, see Upgrade Cluster Specifications. |
Total consumption time | The total time consumed is summarized from metrics such as reply queue, delayed packet response, fetch request duration, local processing, and request queue duration. At each time point, the total time is not equal to the sum of the five durations because each metric is obtained by averaging respectively, hence non-accumulating and not equals. | The value typically ranges between 500ms - 1000ms (client's default fetch.max.wait.ms=500ms), and when the amount of data is large, a duration of 500 - 5000ms is considered normal. If it continues to exceed 5000ms, further investigation is recommended. | Keep the cluster load water level below 80%. If it exceeds this threshold, upgrade the cluster specifications. For specific operations, see Upgrade Cluster Specifications. Increase the consumer timeout period request.timeout.ms to avoid timeout misjudgment. |
Request queue duration | The time a consumption request waits in the request queue indicates the request waits for follow-up processing. | The value ranges between 0 - 50ms, and when the data volume is large, a duration of 0 - 200ms falls within the normal range. As long as it does not exceed 200ms for an extended period, no need to handle. If it continues to exceed 200ms, further investigation is recommended. | Keep the cluster load water level below 80%. If it exceeds this threshold, upgrade the cluster specifications. For specific operations, see Upgrade Cluster Specifications. If the cluster water level is normal, attempt to optimize production parameters, set ack to -1, and increase linger.ms to a non-zero value for write optimization. |
Local processing duration | The consumption request pulls data at the time when the Leader Broker reads data from the local disk. | The value ranges between 0 - 500ms, and when the data volume is large, a duration of 0 - 1000ms falls within the normal range. As long as it does not exceed 1000ms for an extended period, no need to handle, because consumption may involve reading cold data, at this point the duration may be high. If it continues to exceed 1000ms, further investigation is recommended. | Recommend using a cluster with SSD disk storage. |
Consumption wait time | The client's default fetch.max.wait.ms = 500ms, indicating how long the server waits to send the response package to the client when no data is available. | The value is typically around 500ms (client's default fetch.max.wait.ms = 500ms), and its size depends on the parameter setting of the client. | Adjust the waiting time fetch.max.wait.ms based on business needs. Note: Note: In scenes of consumption termination, fetch duration is not required as a delay reference. Refer to multiple metrics such as health status, consumption delay, and consumption backlog for comprehensive evaluation. |
delayed response duration | The time taken for consumption requests to receive delayed system responses. This value remains 0 if the traffic volume of the instance does not exceed the purchased traffic. If rate limited, it will be above 0. | When the instance is not overloaded, this value remains 0 long-term. If the instance exceeds the limit, it will be delayed for 0 to 5 minutes based on the percentage exceeded, with a maximum value of 5 minutes. | When the value remains above 0, enable traffic throttling on the consumption side and check the burst traffic source. If the limit is continuously exceeded, upgrade and expand the bandwidth. For specific operations, see Upgrade Cluster Specifications. |
response packet queue duration | The waiting duration of a consumption request in the response packet queue indicates the request packet waits to be sent to the client. | The value typically ranges between 0 - 50ms, and when the data volume is large, a duration of 0 - 200ms is considered normal. As long as it does not exceed 200ms for an extended period, you can leave it unhandled. If it continues to exceed 200ms, further investigation is recommended. | Optimize consumer network configuration and shorten the waiting interval fetch.max.wait.ms. Check the TCP Retransmission Rate of Broker nodes. If the water level of the consumer's current node is relatively high, a vertical configuration upgrade or horizontal scale-out is required. For specific operations, see Upgrade Cluster Specifications. |
95th percentile of delayed response duration | 95% of consumption requests have a delayed response time less than this value. | When the instance is not overloaded, this value remains 0 long-term. If the instance exceeds the limit, it will be delayed for 0 to 5 minutes based on the percentage exceeded, with a maximum value of 5 minutes. | This scenario generally appears in traffic limiting, need confirmation whether exceeds specification bandwidth. If it continues to exceed, it needs to be processed and can be addressed by upgrading specifications. For specific operations, see Upgrade Cluster Specifications. |
Monitoring Metrics | Description | Normal Value Range | Handling Suggestion |
CPU Usage (%) | CPU usage is the percentage of CPU time occupied by a process within a period of time to the total CPU time. | The value is generally between 1-100%. If it remains above 90% for more than one cycle, it indicates high system load and needs to be troubleshooted. | Upgrade the instance specification. For specific operations, see Upgrade Cluster Specifications. |
Private Network Inbound Bandwidth (MB) | Private Network Inbound Bandwidth refers to the bandwidth a CVM can achieve for communication within the cluster. It is limited by different specifications, affecting private network bandwidth and inbound packet capacity. | The value is generally above 0 (there is data in CVM monitoring within the cluster). If there is no inbound bandwidth, it signifies CVM service exception or unreachable network issue. | Check security group rules. Troubleshoot VPC network routing issues. If there is data but the limit is exceeded, purchase a private network bandwidth package. |
Private Network Outbound Bandwidth (MB) | Private Network Outbound Bandwidth refers to the bandwidth a CVM can achieve for communication within the cluster. It is limited by different specifications, affecting private network bandwidth and packet sending capabilities. | The value is generally above 0 (there is data in CVM monitoring within the cluster). If there is no outbound bandwidth, it signifies CVM service exception or unreachable network issue. | Check security group rules. Troubleshoot VPC network routing issues. If there is data but the limit is exceeded, purchase a private network bandwidth package. |
Memory utilization (%) | Memory usage is the percentage of total memory space consumed, calculated by subtracting available memory from total memory space. | Normal range: 1-100. If memory usage reaches over 90, it signifies the program has consumed too much memory and requires specific processing. | Upgrade bandwidth specifications to raise physical resource specifications. For specific operations, see Upgrade Cluster Specifications. |
Public Network Inbound Bandwidth (MB) | Public Network Inbound Bandwidth refers to the bandwidth a CVM can achieve for public network communication. It is limited by varying specifications, affecting public network bandwidth and packet receiving capability. | The value will be above 0 if there is inbound traffic to the public network, otherwise 0. If the exception is 0, further investigation is required. | Check if the Elastic IP is in arrears. Upgrade public network bandwidth when the limit is exceeded. For specific operations, see Public Network Bandwidth Management. |
Public Network Outbound Bandwidth (MB) | Public Network Outbound Bandwidth refers to the bandwidth a CVM can achieve for public network communication. It is limited by varying specifications, affecting public network bandwidth and packet sending capabilities. | The value will be above 0 if there is public outbound traffic, otherwise 0. If the exception is 0, further investigation is required. | Check if the Elastic IP is in arrears. Upgrade public network bandwidth when exceeding the limit. For specific operations, see Public Network Bandwidth Management. |
Monitoring Metrics | Description | Normal Value Range | Handling Suggestion |
Heap memory utilization (%) | JVM heap memory usage of the Broker as a percentage of total heap memory, taking the maximum per unit time. | The maximum value of this metric generally fluctuates between 80-90. If the upward trend persists long-term, attention is required for heap memory usage. | Keep the cluster water level below 80%. If it exceeds this threshold, upgrade the cluster specifications. For specific operations, see Upgrade Cluster Specifications. If the cluster water level is not exceeded, first ensure the version is the latest. If not, upgrade to the latest version. For specific operations, see Upgrade Instance Version. If it is the latest version and the issue still persists, contact online customer service. |
Young GC (Count) | Broker Young GC (Count) | Normally between 0 - 300. If it continues to exceed 300, the GC parameter can be adjusted. | Keep the cluster water level below 80%. If it exceeds this threshold, upgrade the cluster specifications. For specific operations, see Upgrade Cluster Specifications. If the cluster water level is not exceeded, first ensure the version is the latest. If not, upgrade to the latest version. For specific operations, see Upgrade Instance Version. If it is the latest version and the issue still persists, contact online customer service. |
Full GC (Count) | Broker Full GC (Count) | 0 is normal. If the count is above 0, it needs to be processed. | Keep the cluster water level below 80%. If it exceeds this threshold, upgrade the cluster specifications. For specific operations, see Upgrade Cluster Specifications. If the cluster water level is not exceeded, first ensure the version is the latest. If not, upgrade to the latest version. For specific operations, see Upgrade Instance Version. If it is the latest version and the issue still persists, contact online customer service. |
Dashboard Metrics (Pro Edition)
CKafka Pro Edition supports Dashboard capacity, showing Top Ranking of key metrics for production consumption hot spot analysis, disk usage analysis, and business optimization analysis needs.
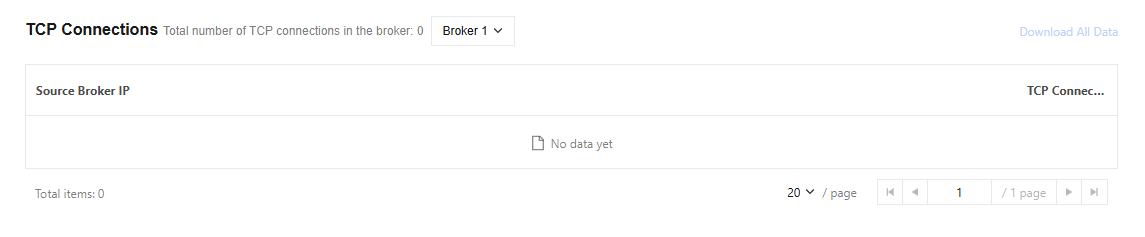
Connection metrics show the total number of TCP connections on the Broker. Use the drop-down list to switch and view connection status on different Brokers. When the number of TCP connections is ≤ 500, the system supports full data download.
Users can quickly view the connection status of each machine with this data. If the number of connections is close to or reaches the limit, priority recommendation is to troubleshoot anomalies or scale instances to avoid affecting service availability.
Details of unsynced replicas: Show the details of unsynced replicas for the specified Topic to quickly locate partitions with abnormal replica synchronization, ensuring data redundancy and availability.
Node distribution: Show the replica distribution of the specified Topic across Broker nodes. This metric can be used for the following scenarios:
Help locate Brokers with uneven replica distribution.
For disaster recovery assessment, underwrite partition replica dispersion on different nodes.
Provide data migration reference and plan node scaling for cluster scaling.
Topic: Show the top 10 topics by production/consumption traffic and disk usage, and support viewing specified node ranking statistics. This metric helps quickly detect high-load topics and locate traffic anomalies or storage overload issues on a single node.
Consumer Group: Show the Top 10 consumption speed of Consumer Groups. This metric helps identify high-throughput consumption groups, locate delays in message consumption or backlog issues, thereby optimizing resource configuration at the Consumer end.
Was this page helpful?
You can also Contact Sales or Submit a Ticket for help.
Yes
No
Feedback