A bar chart describes categorical data. It visually reflects the comparison of each category in size. It is suitable for category statistics scenarios, for example, collecting the numbers of each type of error codes in the last 24 hours.
Chart Configuration
General configuration
|
| Chart Name: Set the display name of the table, which can be left empty. |
| Set the unit of all metric-type fields in the chart. For more information, see Unit Configuration. |
Bar chart configuration
|
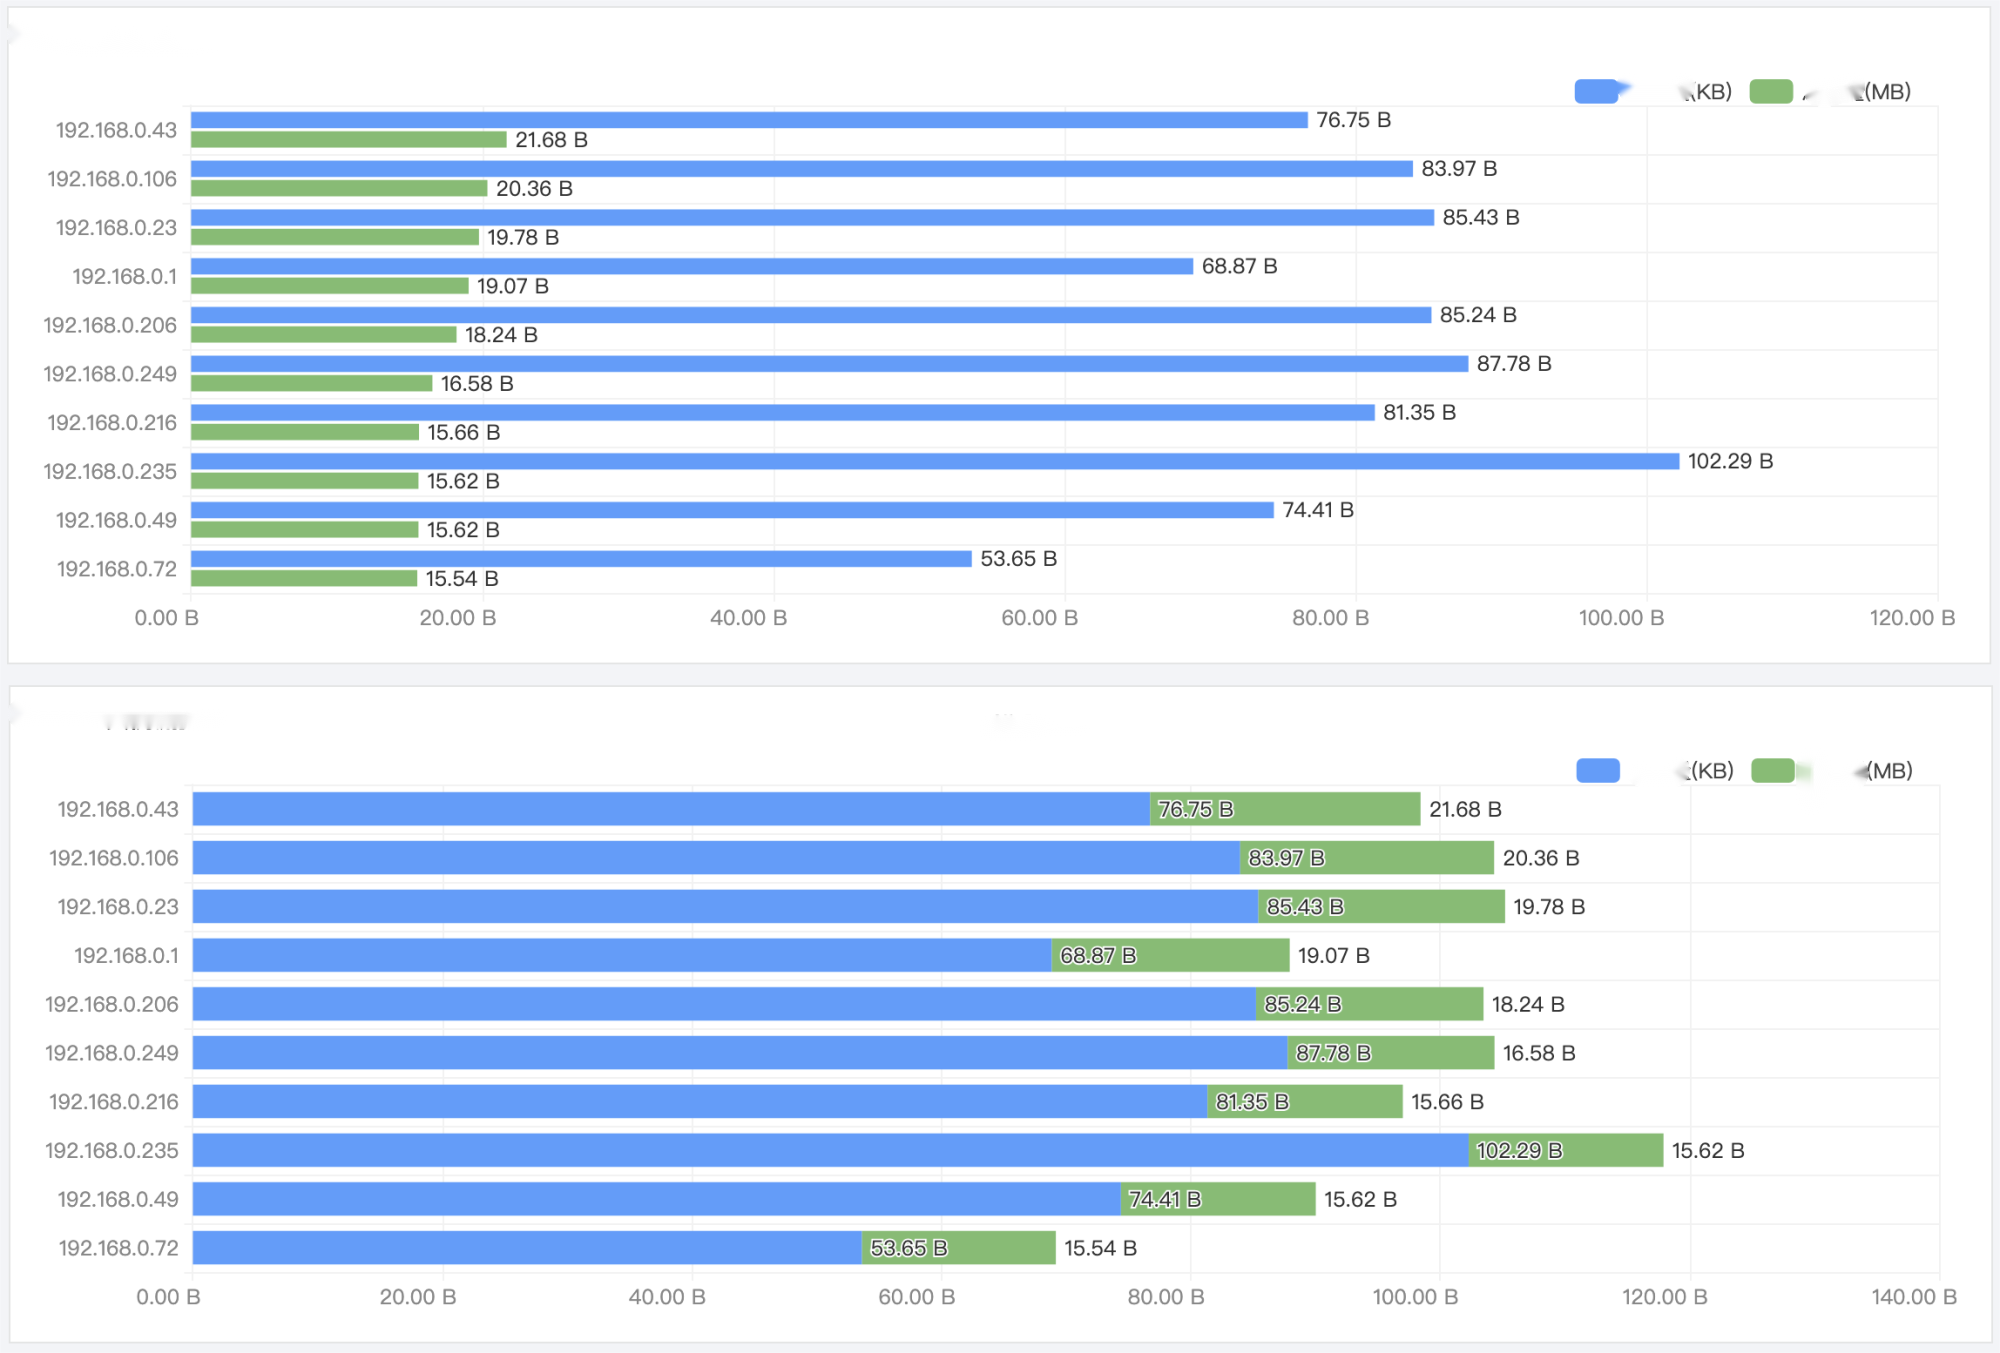
| Direction: Control the bar/column direction. A bar chart is horizontal, while a column chart is vertical. Sort By: Control the bar/column sorting order, which can be ascending or descending by metric. If there are multiple metrics, you need to select one for sorting. Sorting is disabled by default. Display Value: Control whether to display the value label of each bar/column. Bar/Column Mode: Grouped and stacked display modes are supported. |
Bar/Column mode example:
Chart Operations
Local zoom-out
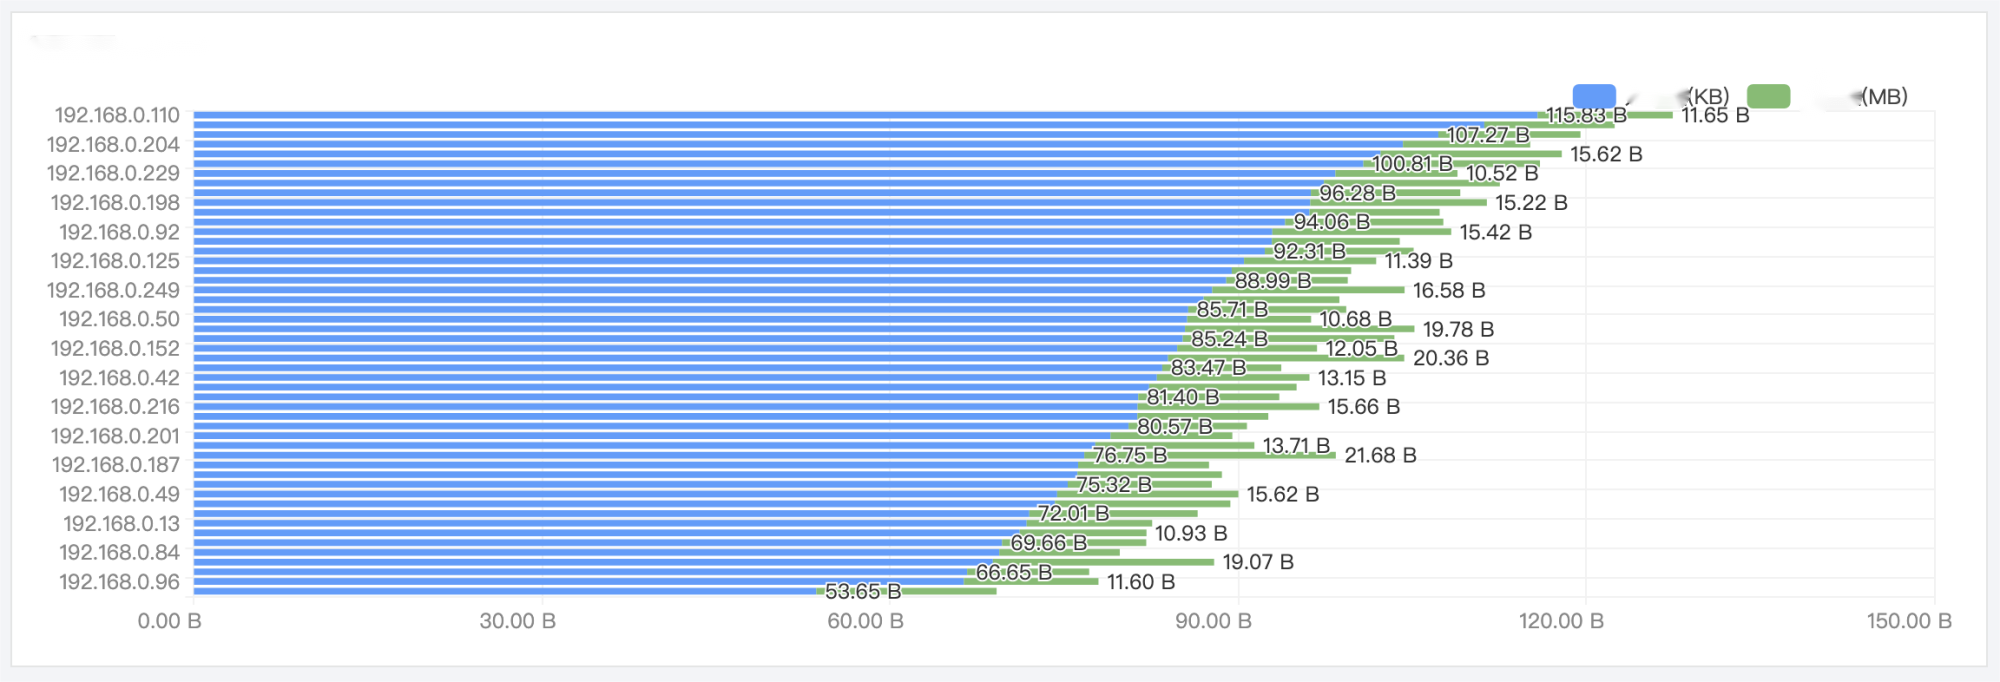
If there are too many statistical results, the bars/columns will be too dense and labels will overlap each other as shown above, which will affect the analysis. In this case, you can hover over the chart and scroll the mouse wheel to zoom in/out the displayed area. This allows you to focus on the local content and display the complete information.
Was this page helpful?