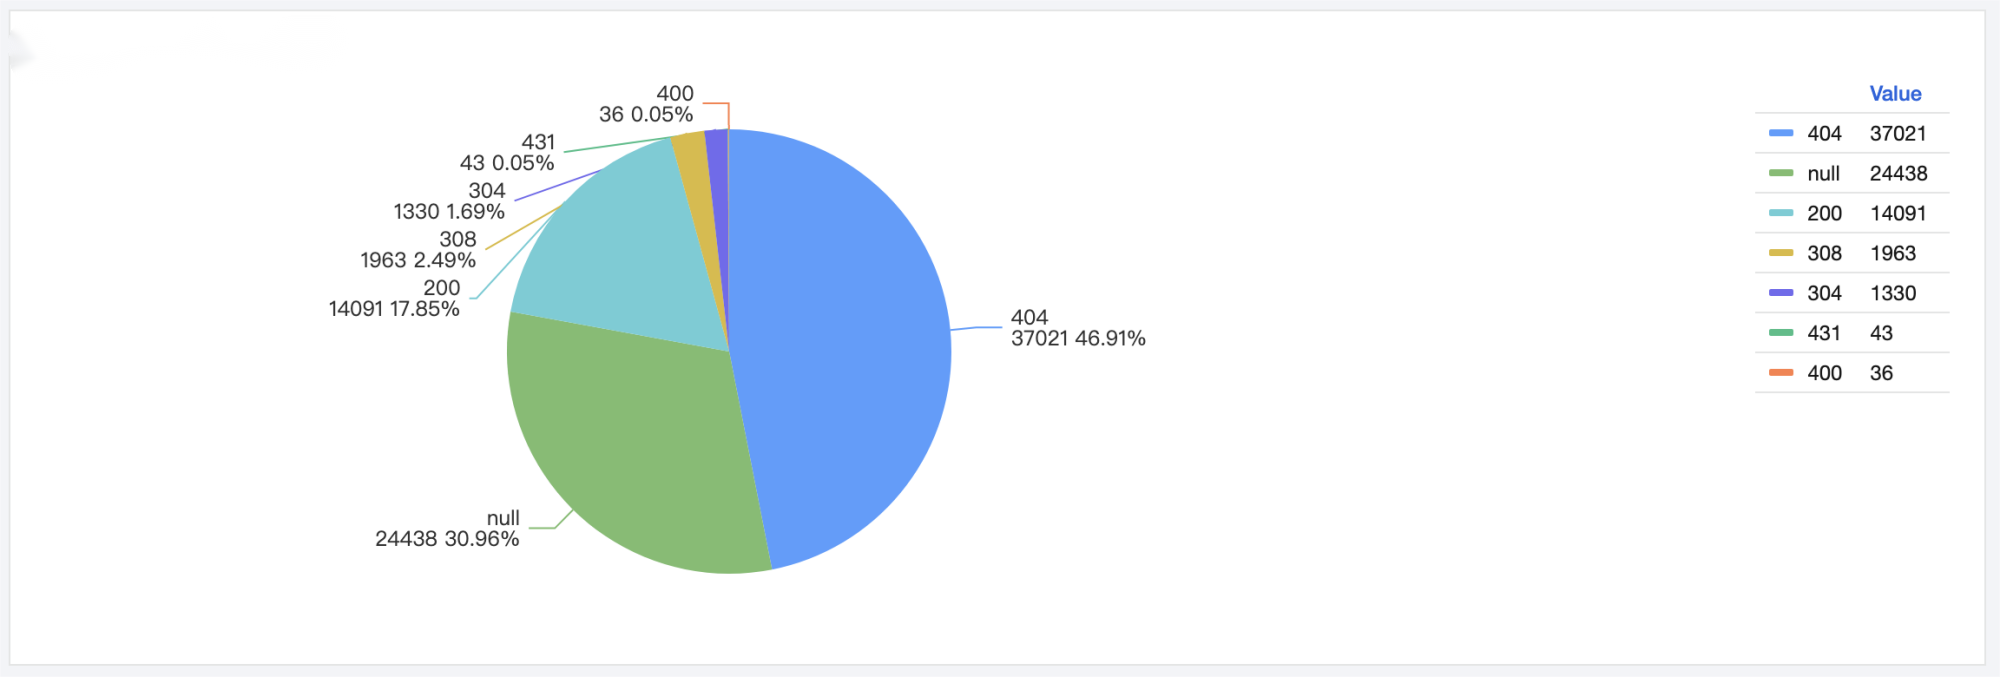
A pie chart describes the proportions of different types. It measures the proportion of each type by the slice size. It is suitable for proportion statistics scenarios, for example, analyzing the proportions of different error codes.
Chart Configuration
General configuration
Configuration Item
Description
Basic information
Chart Name: Set the display name of the table, which can be left empty.
Legend
Set the chart legends. You can control the legend styles and positions and add comparison data to legends.
Standard configuration
Set the unit of all metric-type fields in the chart. For more information, see Unit Configuration.
Pie chart configuration
Configuration Item
Description
Pie chart
Display Mode: Control the pie chart style. A solid chart is a pie chart, and a hollow chart is a donut chart.
Sort By: Control the slice sorting order, which can be ascending and descending. Sorting is disabled by default.
Merge Slices: Merge slices other than top N slices into the "Others" slice. If there are too many slices, you can use this feature to focus on top N slices.
Label: Display pie chart labels. You can set name, value, and/or percentage as tags.