When using Spring Boot as the development framework, you need to monitor the status of applications such as JVM and Spring MVC. TMP collects data such as JVM data based on the Spring Boot Actuator mechanism. With the Grafana dashboard that comes with TMP, you can conveniently monitor the status of Spring Boot applications.
This document uses deploying a Spring Boot application in TKE as an example to describe how to use TMP to monitor the application status.
The image is developed based on the Spring Boot framework.
Directions
Note:
Spring Boot provides the Actuator component to monitor applications, which reduces the development costs. Therefore, Actuator is directly used in this document to track Spring Boot metrics. You should use Spring Boot v2.0 or above in the following steps, as lower versions may have different configurations.
If you use Spring Boot v1.5 for integration, the integration process will differ from that for v2.0, and you should note the following:
1. The address for accessing prometheus metrics is different from that for v2.0. On v1.5, the default address is /prometheus, i.e., http://localhost:8080/prometheus.
2. If error 401 is reported, it indicates no permissions (Whitelabel Error Page). On v1.5, security control is enabled for the management API by default, so you need to set management.security.enabled=false.
3. If bootstrap.yml is used to configure parameters in the project, modifying management in it will not work, which should be modified in application.yml due to the Spring Boot start and load sequence.
4. You cannot add metric common tag through YML; instead, you can add it only by adding a bean to the code.
Modifying application dependencies and configuration
Step 1. Modify POM dependencies
If spring-boot-starter-web is already imported in this project, add the actuator/prometheus Maven dependency to the pom.xml file.
Edit the application.yml file in the resources directory and modify the actuator configuration to expose the metric data in the Prometheus protocol.
management:
endpoints:
web:
exposure:
include: prometheus # Web access path for opening Prometheus
metrics:
# We recommend you enable the following options to monitor P99 and P95 latencies of HTTP requests. You can set the specific time distribution based on the actual conditions
# You must add the corresponding application name, as the corresponding monitoring information needs to be viewed by application
application: spring-boot-mvc-demo
Step 3. Perform local verification
In the current directory of the project, run mvn spring-boot:run. If you can access the metric data of the Prometheus protocol through http://localhost:8080/actuator/prometheus, the relevant dependency configuration is correct.
Note:
The default configurations of the port and path are used in the same, which should be replaced with those in your actual project.
Releasing application to TKE
Step 1. Configure a Docker image environment locally
If you have already configured a Docker image environment locally, proceed to the next step; otherwise, configure one as instructed in Getting Started.
Step 2. Package and upload the image
1. Add Dockerfile in the root directory of the project. You can add it by referring to the following sample code and modify Dockerfile based on your actual project:
2. Package the image by running the following command in the project root directory. You need to replace namespace, ImageName, and image tag as needed in your actual project.
1. Log in to the TKE console and select the container cluster for deployment.
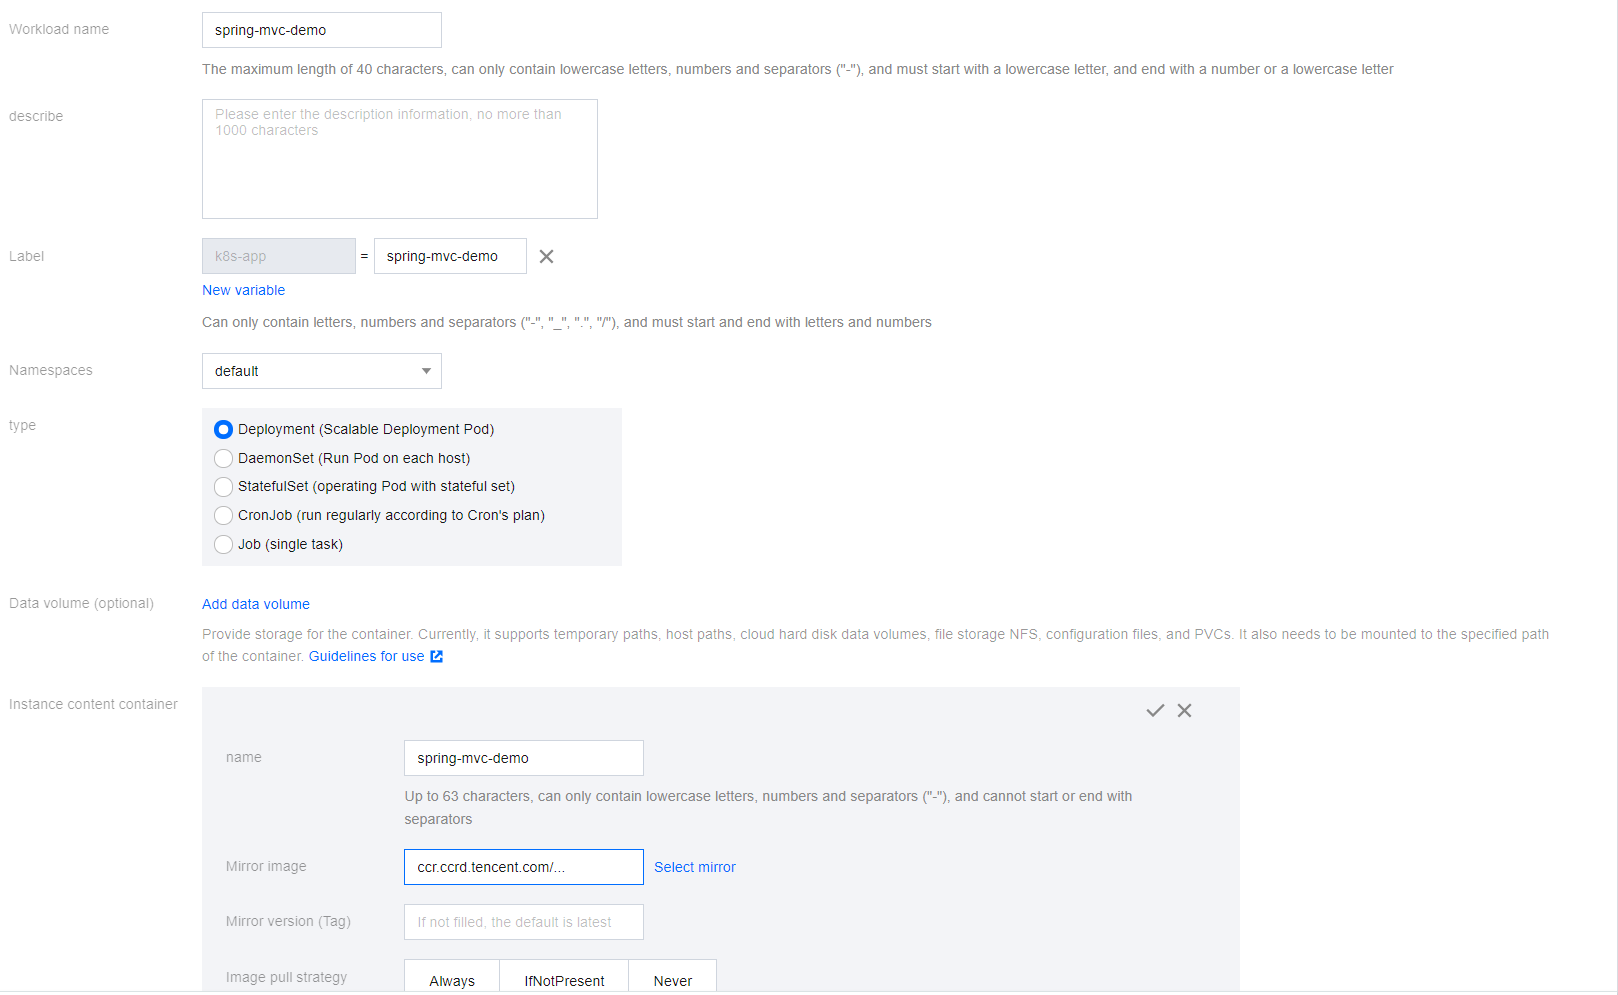
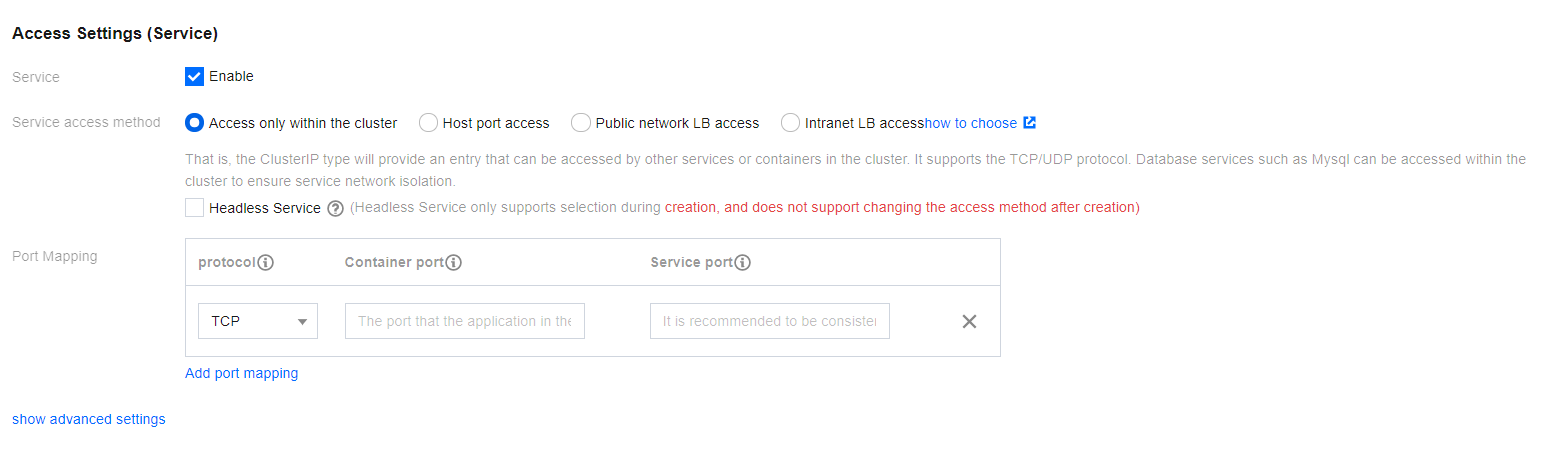
2. Click Workload > Deployment to enter the Deployment management page and select the corresponding namespace to deploy the service. Here, a workload is created in the console, and Service access is also enabled. You can also create one on the command line.
3. Add K8s labels to the corresponding Service. If the workload is created on the command line, you can directly add labels. Here, the configuration is adjusted in the TKE console. Select the TKE cluster that needs to be adjusted.
Click Services and Routes > Service to enter the Service management page. Select the corresponding namespace to adjust the Service YAML configuration as shown below:
apiVersion: v1
kind: Service
metadata:
labels:# Add the corresponding labels based on the actual conditions
k8sapp: spring-mvc-demo
name: spring-mvc-demo
namespace: spring-demo
spec:
ports:
-name: 8080-8080-tcp # Corresponding `port` value in the ServiceMonitor scrape task
port:8080
protocol: TCP
targetPort:8080
selector:
k8s-app: spring-mvc-demo
qcloud-app: spring-mvc-demo
sessionAffinity: None
type: ClusterIP
Step 4. Add a scrape task
1. Log in to the TMP console and select the target TMP instance to enter the management page.
2. Click a cluster ID in the TKE cluster list to enter the Integrate with TKE page.
3. In Scrape Configuration, add a ServiceMonitor. Currently, TMP supports discovering the corresponding target instance address through labels; therefore, you can add some specific K8s labels to some services, which will be automatically identified by TMP after configuration, eliminating your need to add scrape tasks for all services one by one. The configuration information for the above sample is as follows:
Note:
Here, note that the port value is the spec/ports/name value in the Service YAML configuration file.
apiVersion: monitoring.coreos.com/v1
kind: ServiceMonitor
metadata:
name: spring-mvc-demo # Enter a unique name
namespace: cm-prometheus # The namespace is fixed. Do not change it
spec:
endpoints:
-interval: 30s
port: 8080-8080-tcp # Enter the name of the corresponding port of the Prometheus exporter in the Service YAML configuration file
path: /actuator/prometheus # Enter the value of the corresponding path of the Prometheus exporter. If it is not specified, it will be `/metrics` by default
namespaceSelector:# Select the namespace where the Service to be monitored resides
matchNames:
- spring-demo
selector:# Enter the label value of the Service to be monitored to locate the target Service
matchLabels:
k8sapp: spring-mvc-demo
Step 5. View the monitoring information
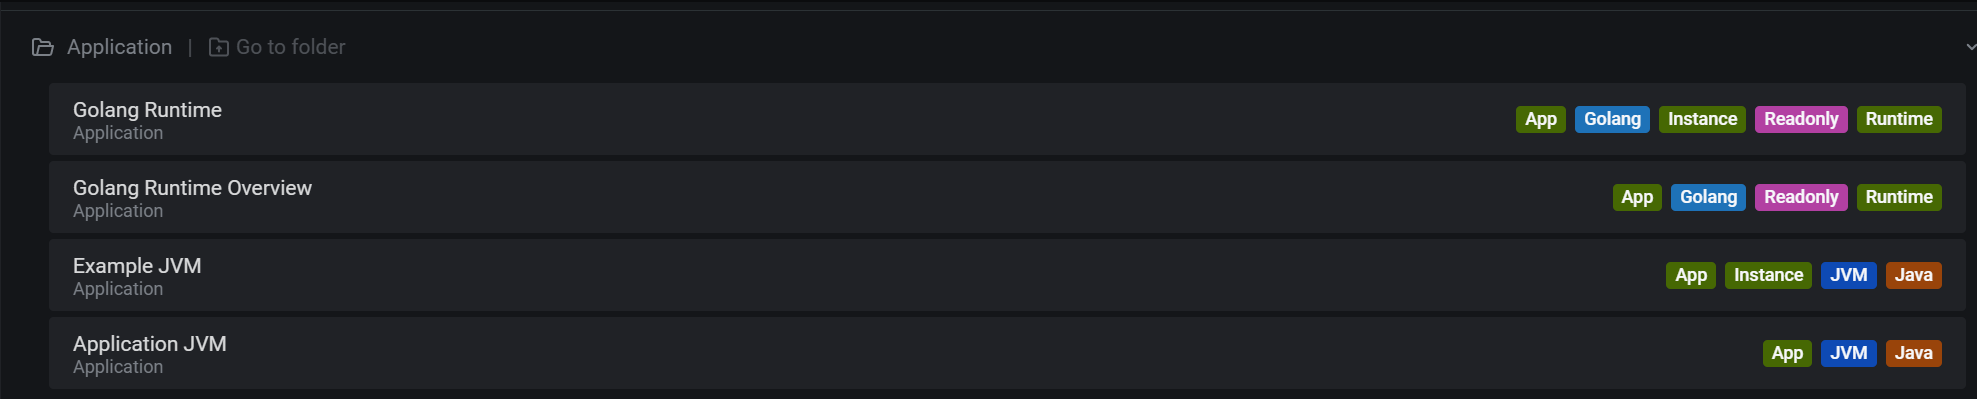
Access the Grafana address of your TMP instance to view the application monitoring dashboard in Dashboards > Manage > Application.
Spring MVC application: monitoring data of MVC status, such as the request latency, number of requests, success rate, and exception distribution.
Spring MVC API: API-level monitoring data, which supports multiple APIs to help you locate faulty APIs.
Tomcat: monitoring dashboard of internal Tomcat status, such as thread usage.
Application JVM: monitoring data of the status of all instances under an application. If you find a faulty instance, you can view its monitoring information at any time.
Instance JVM: detailed monitoring data of a single instance JVM.


 Yes
Yes
 No
No
Was this page helpful?