This guide will guide you on how to view the upload acceleration and downstream traffic statistics of VOD on EO.
Steps
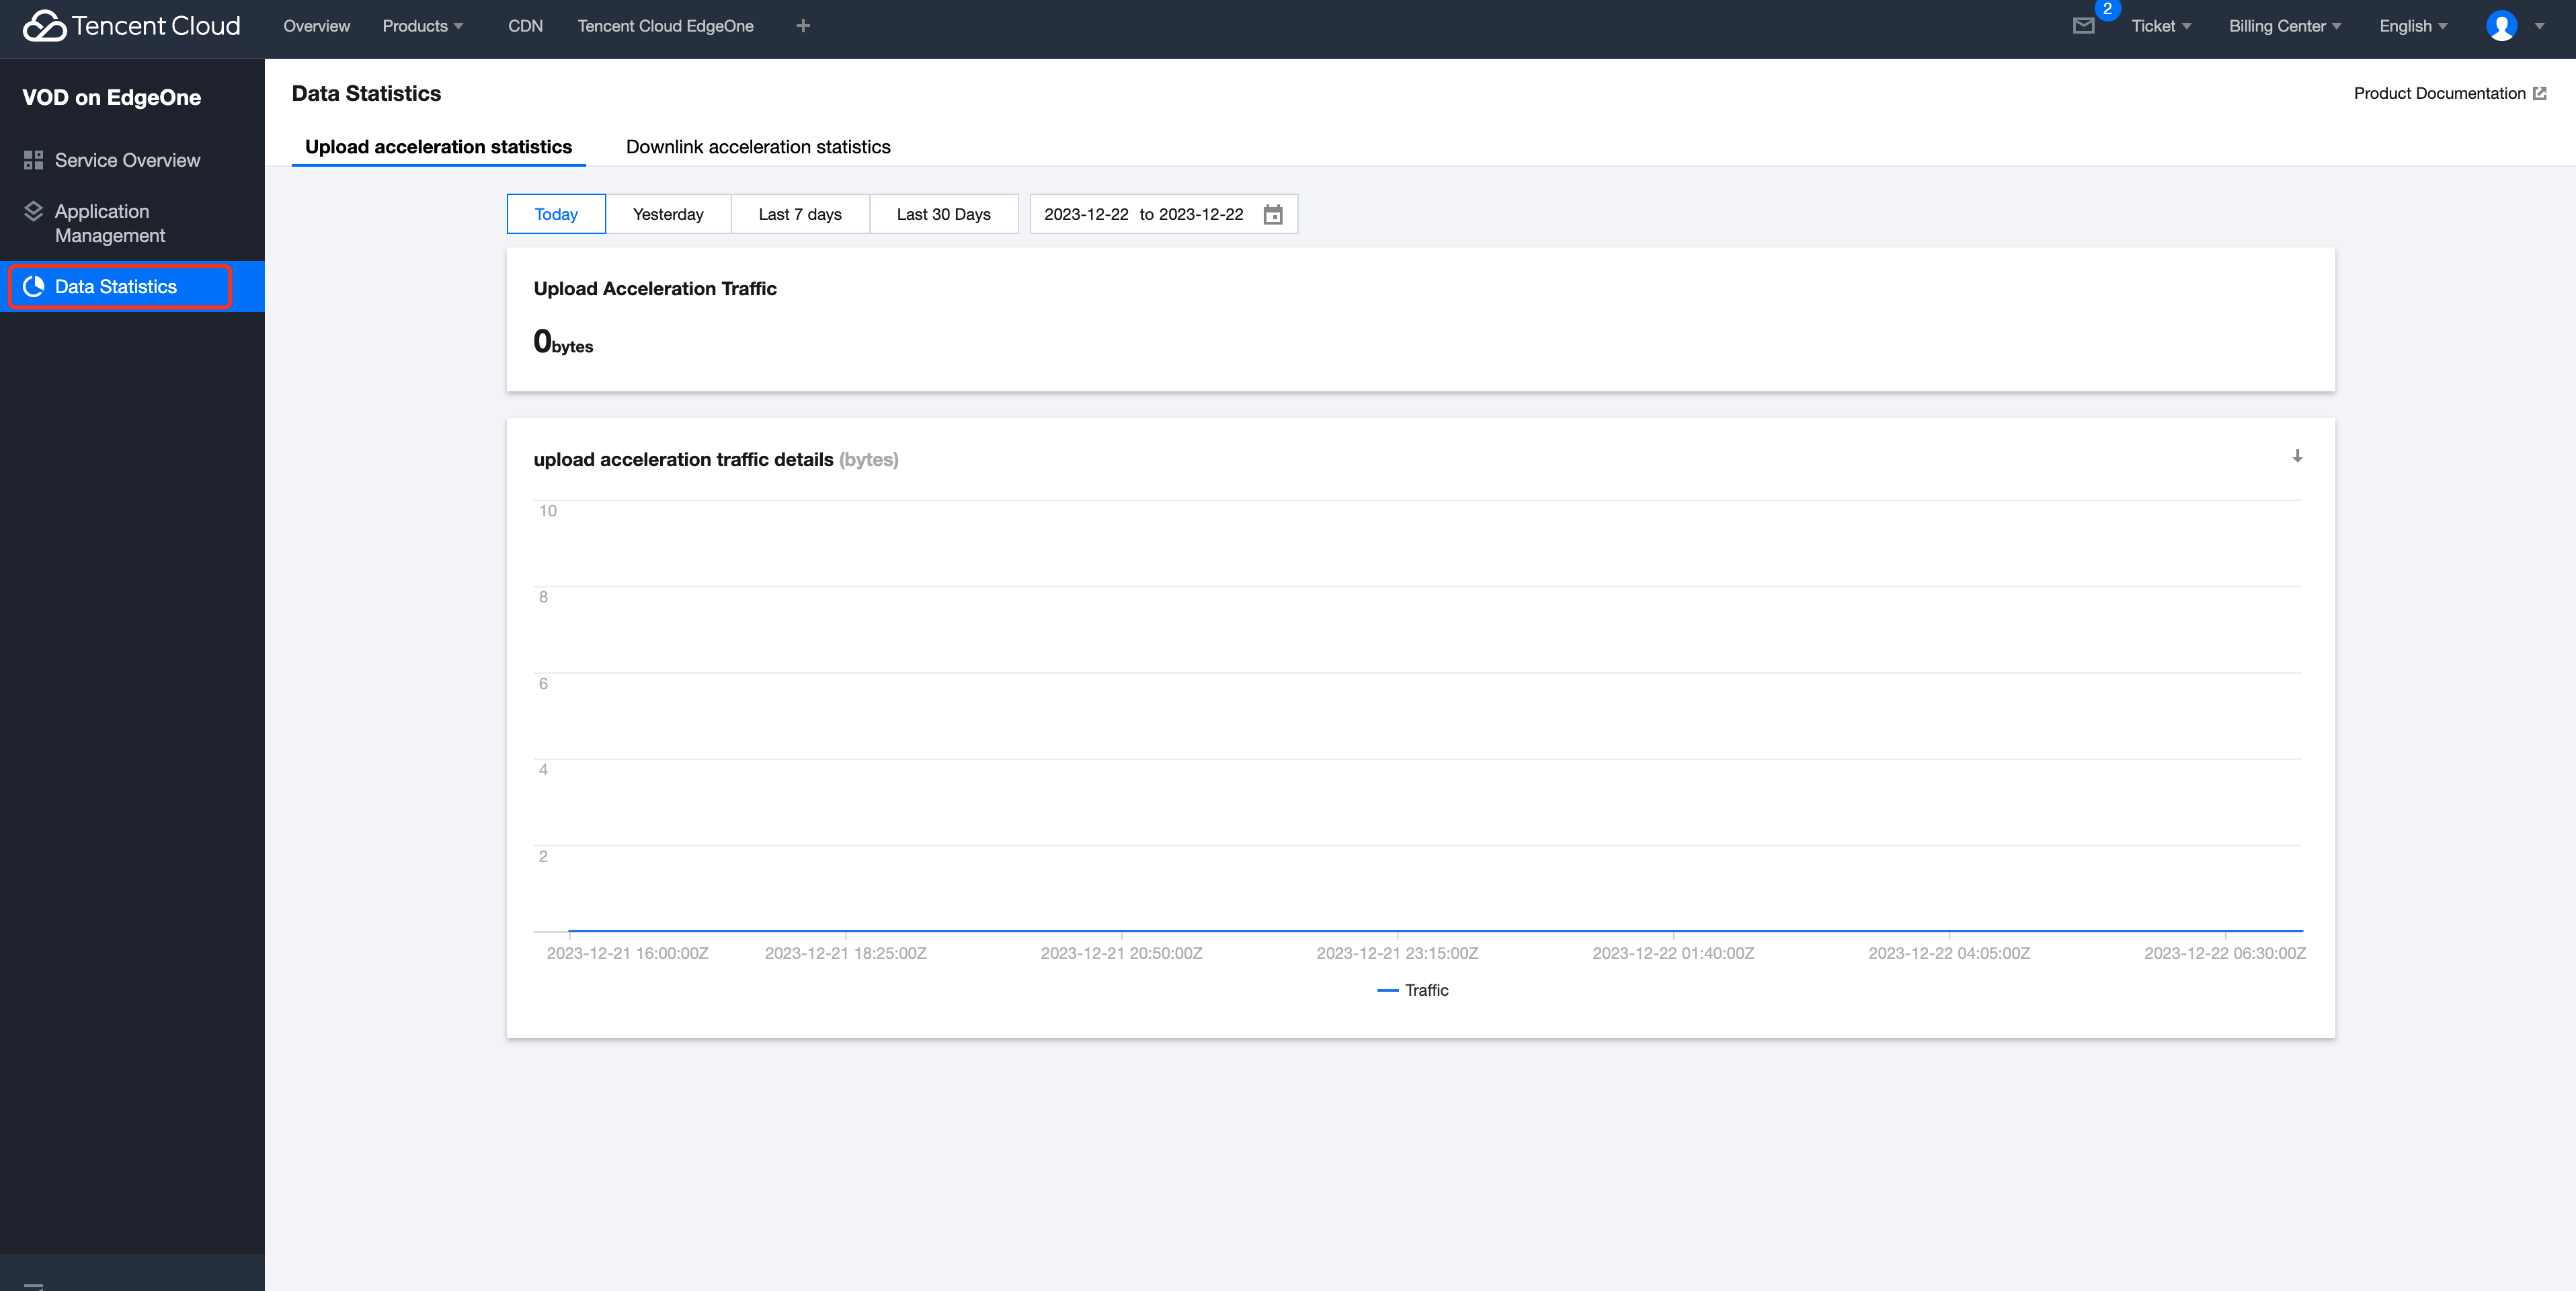
1. Log in the VOD on EO console, and click Data Statistics in the left navigation bar to access the data statistics page.
2. Data Statistics provides both media upload acceleration statistics and media accelerated distribution statistics. The Upload acceleration statistics tab is displayed by default.
Upload Acceleration Statistics
The time dimensions for upload acceleration statistics include today, yesterday, the past 7 days, the past 30 days, and any custom period within the past 6 months.
The data overview metric is Total Upload Acceleration Traffic (B).
Graphically display the details of upload acceleration statistics.
There is approximately a one-hour delay in the upload acceleration statistical data.
Downstream Traffic Statistics
The time dimensions for bandwidth/traffic statistics include today, yesterday, the past 7 days, the past 30 days, and any custom period within the past 6 months. In addition to time dimensions, bandwidth/traffic statistical data can also be filtered and calculated based on dimensions such as domain, region, and ISP.
The data overview metrics include Peak Bandwidth (bps), Total Traffic (B), and Total QUIC Requests (times) for the corresponding filter conditions and periods.
Graphically display the details of bandwidth usage and traffic usage.
There is approximately a 10-minute delay in the bandwidth/traffic statistical data.

 Yes
Yes
 No
No
Was this page helpful?