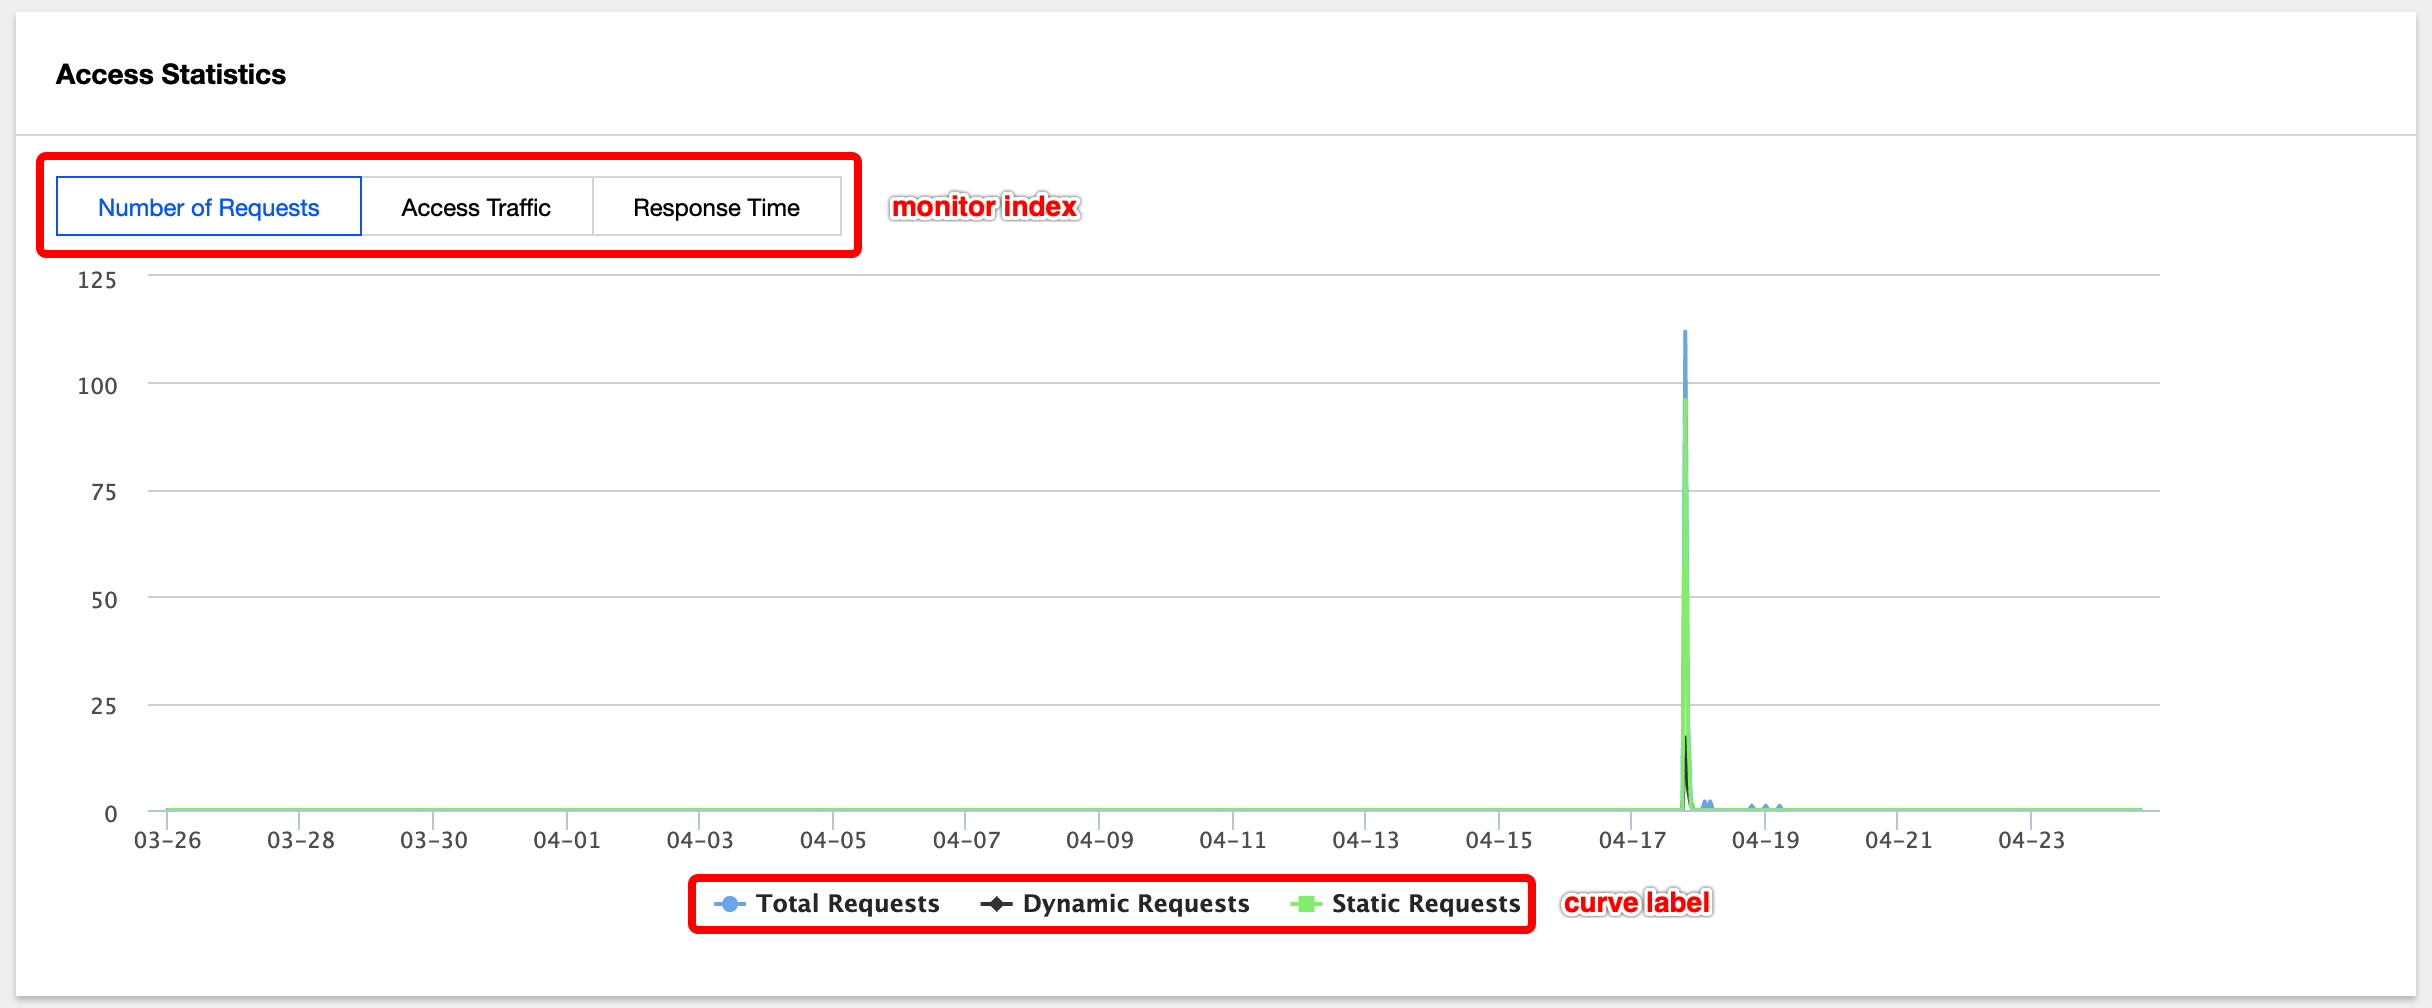
Access Statistics
Last updated: 2021-06-25 11:15:36
This document is currently invalid. Please refer to the documentation page of the product.
ECDN usage statistics allow you to query historical statistics and monitoring data. You can view metrics such as the number of requests, access traffic, and response time.
You can log in to the ECDN Console, then click Statistics on the left sidebar to enter the Usage Statistics page and try out this feature.
Query Filters
- Period: queries data in the last 12 calendar months with a maximum time span of 31 days.
- Project: queries usage by project.
- Domain Name: queries usage of the specified domain name.
- Granularity: indicates an interval in which you query data and is subject to the selected period.
- For a 1-day period, you can query data at a granularity of 5 minutes, 15 minutes, 30 minutes, 1 hour, 2 hours, 4 hours, or 24 hours.
- For a period of 2–3 days, you can query data at a granularity of 15 minutes, 30 minutes, 1 hour, 2 hours, or 4 hours.
- For a period of 4–7 days, you can query data at a granularity of 30 minutes, 1 hour, 2 hours, or 4 hours.
- For a period of 8–30 days, you can query data at a granularity of 1 hour, 2 hours, 4 hours or 24 hours.
- Region: queries usage by geographic area (regions within Mainland China or outside, or global regions).

Usage Data Display
The usage data is displayed in three statistics modules:
- Data overview: displays the total usage.
- Monitoring details: displays detailed historical usage in curves.
- Domain name statistics: displays usage of each domain name in a list.
Query profile
As shown below, the query profile page displays statistics by account. You can quickly view the total usage in the specified query period.
Access statistics
The access statistics section displays curves of historical monitoring data. You can view data of metrics in different categories.
- All domain names that were connected in the last 30 days, including deleted ones, will be included in the All Domain Names drop-down list.
- The real-time monitoring data you query will have a near 5-minute lag. If you run a query at 14:26:00, you will get the 00:00:00–14:21:00 data.
- Monitoring data is tracked over a time interval. For a 5-minute interval, a query start at 10:00:00–10:04:59 will start at the 10:00:00 sample point.
- If the time you query is longer than that of domain name connection, you will only get the connection statistics rather than those unconnected or deleted.
- To query monitoring data of multiple domain names or metrics, you can use the DescribeEcdnStatistics API.

Domain name statistics
As shown below, the list of domain name statistics displays the usage details. You can sort different metrics to view the data.

 Yes
Yes
 No
No
Was this page helpful?