You can monitor the performance of ClickHouse clusters in the following two ways:
Use the default monitoring page if you don't enable Grafana monitoring when purchasing a cluster.
Use the advanced monitoring system with cluster alarm policies if you enable Grafana monitoring when purchasing a cluster.
Grafana Monitoring Disabled
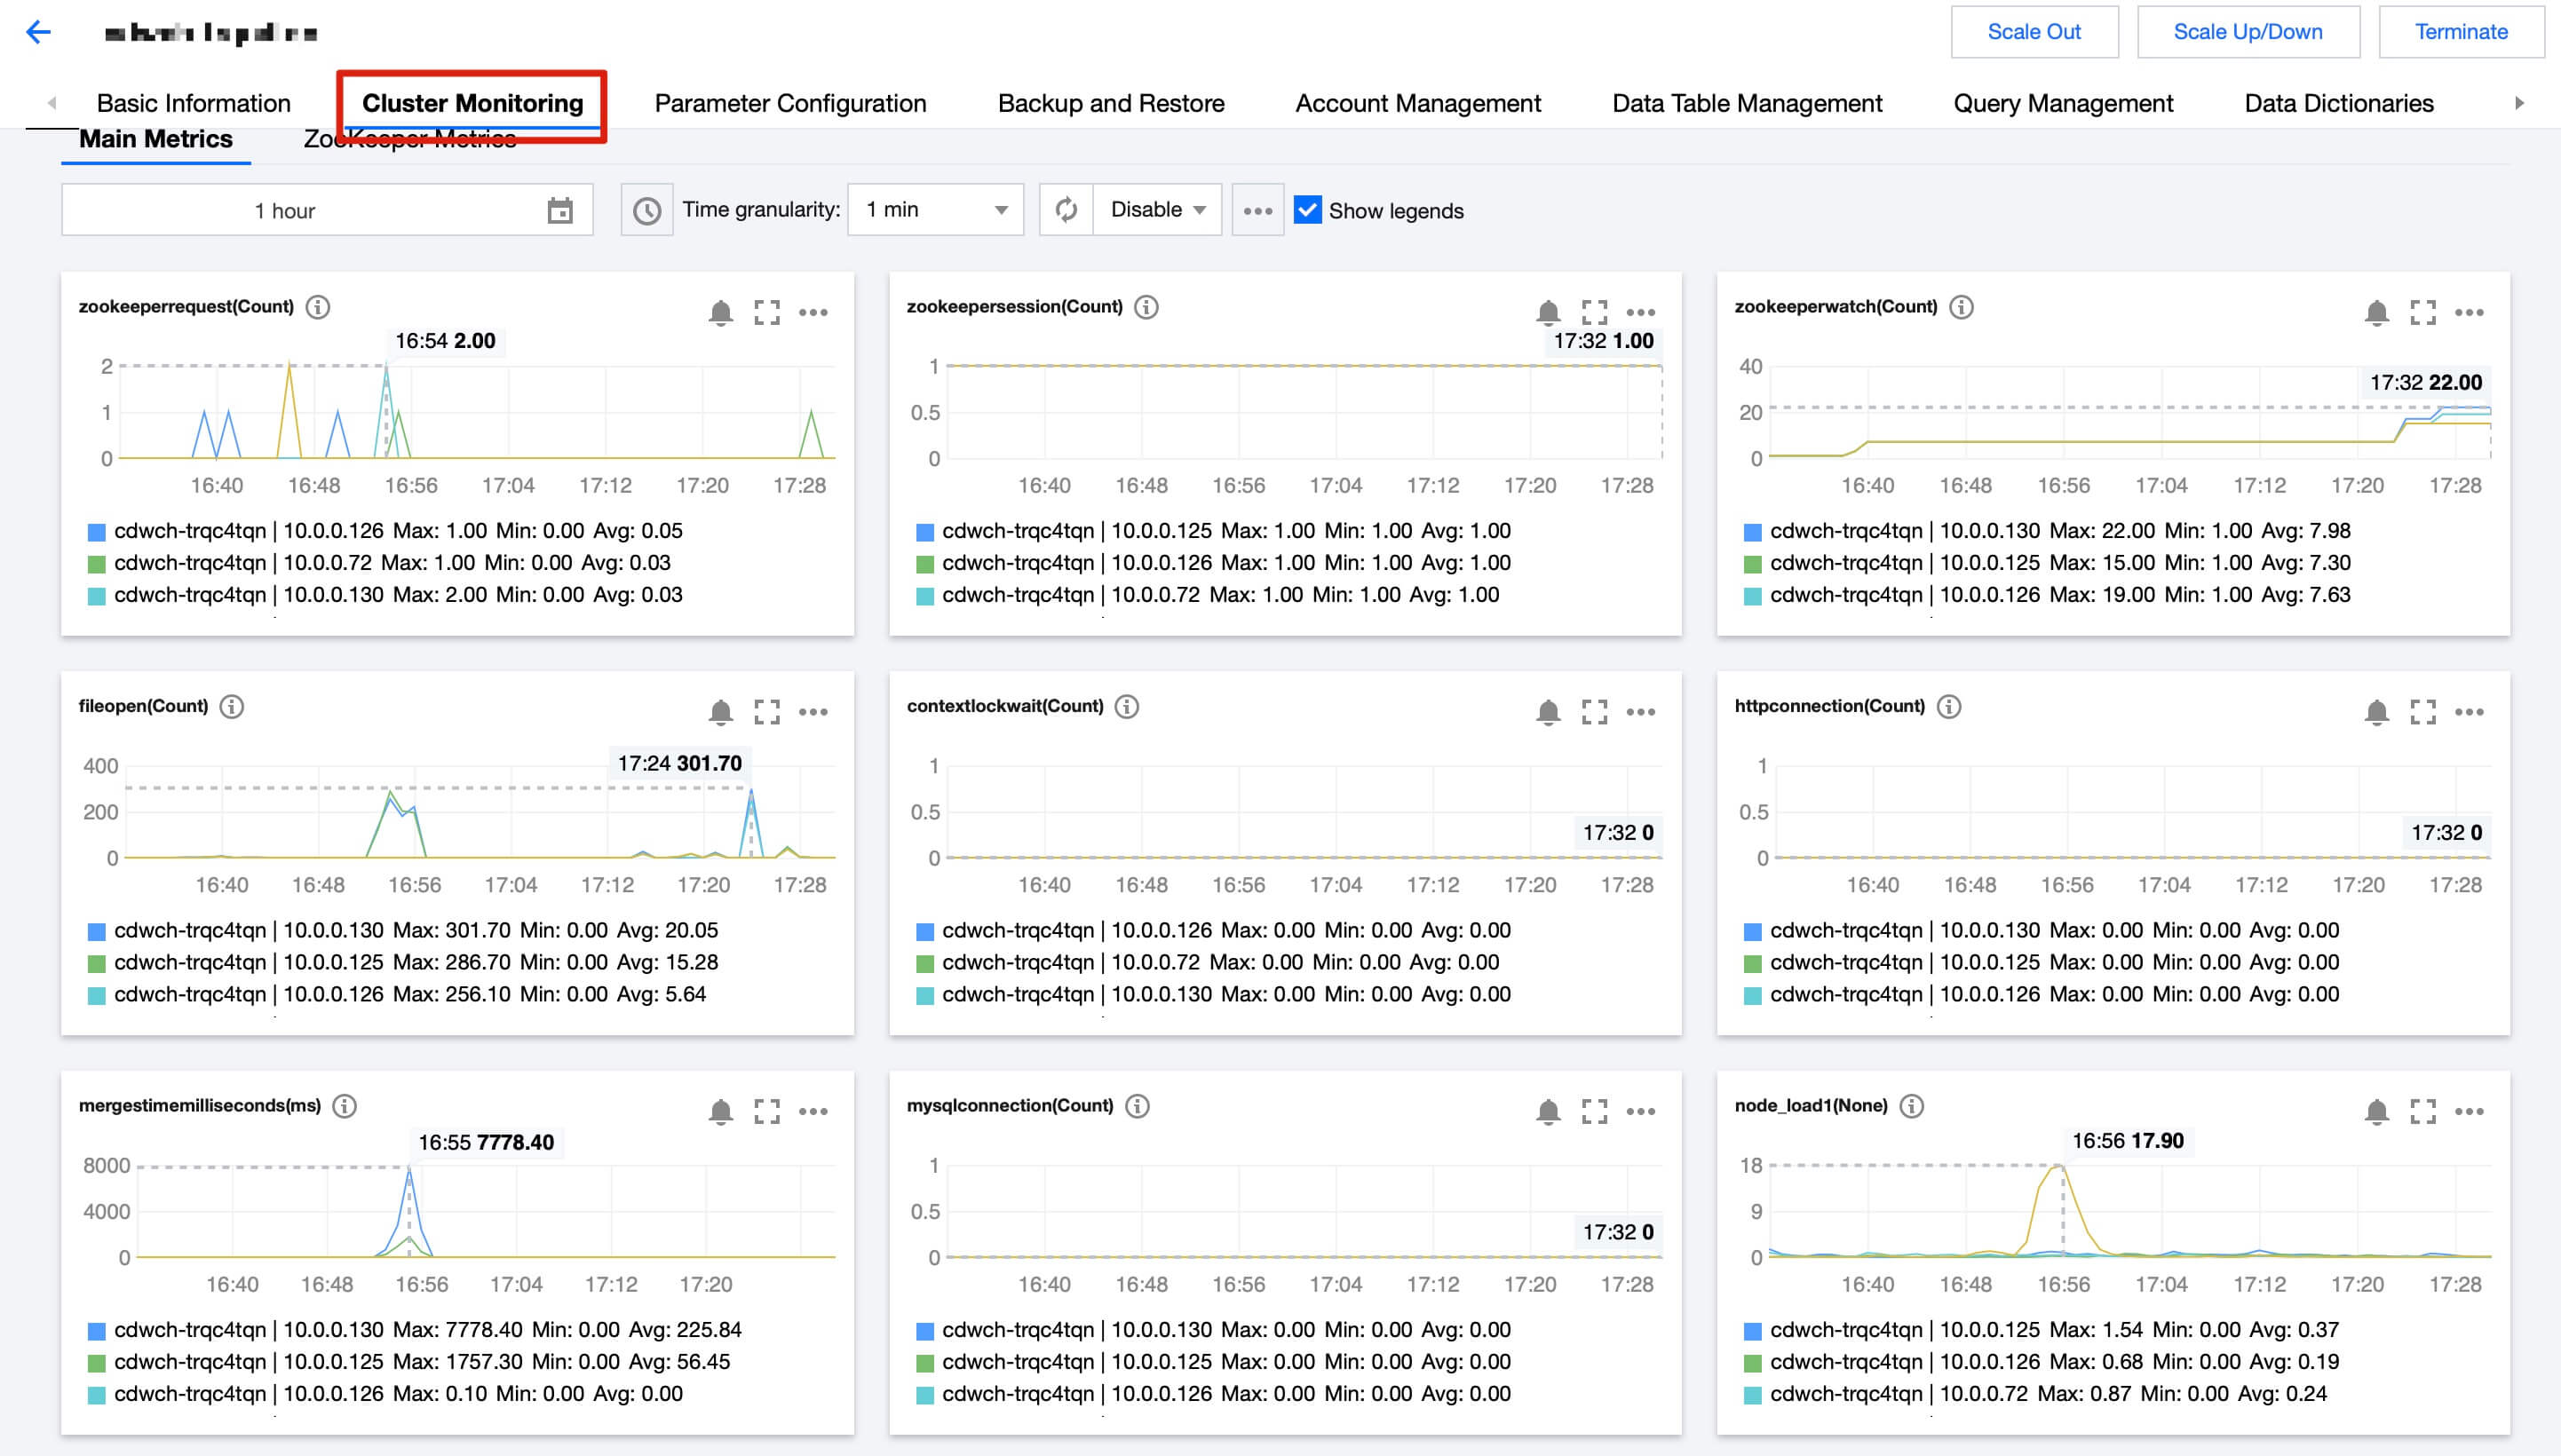
Go to the Tencent Cloud TCHouse-C console, click a Cluster ID/Name in the Cluster List to enter the cluster details page, and switch to the Cluster Monitoring tab to view performance metrics.
Metric
Description
Network connections
Total number of server connections
SELECT queries
Number of queries executed per unit of time
Total file opens
Number of file opens
Inserted rows
Number of insertions executed per unit of time
Merges executed on backend
Number of threads being merged
Total threads processing queries
Number of threads to start query processing
CPU utilization
CPU utilization of each node
1-min CPU load
CPU load in 1 minute of each node
Disk space utilization
Ratio of used disk space to the maximum available disk space * 100%
Memory utilization
Memory utilization of each node
Outbound network traffic rate
Rate of data sent by the ENI
Inbound network traffic rate
Rate of data received by the ENI
Grafana Monitoring Enabled
Monitoring dashboard
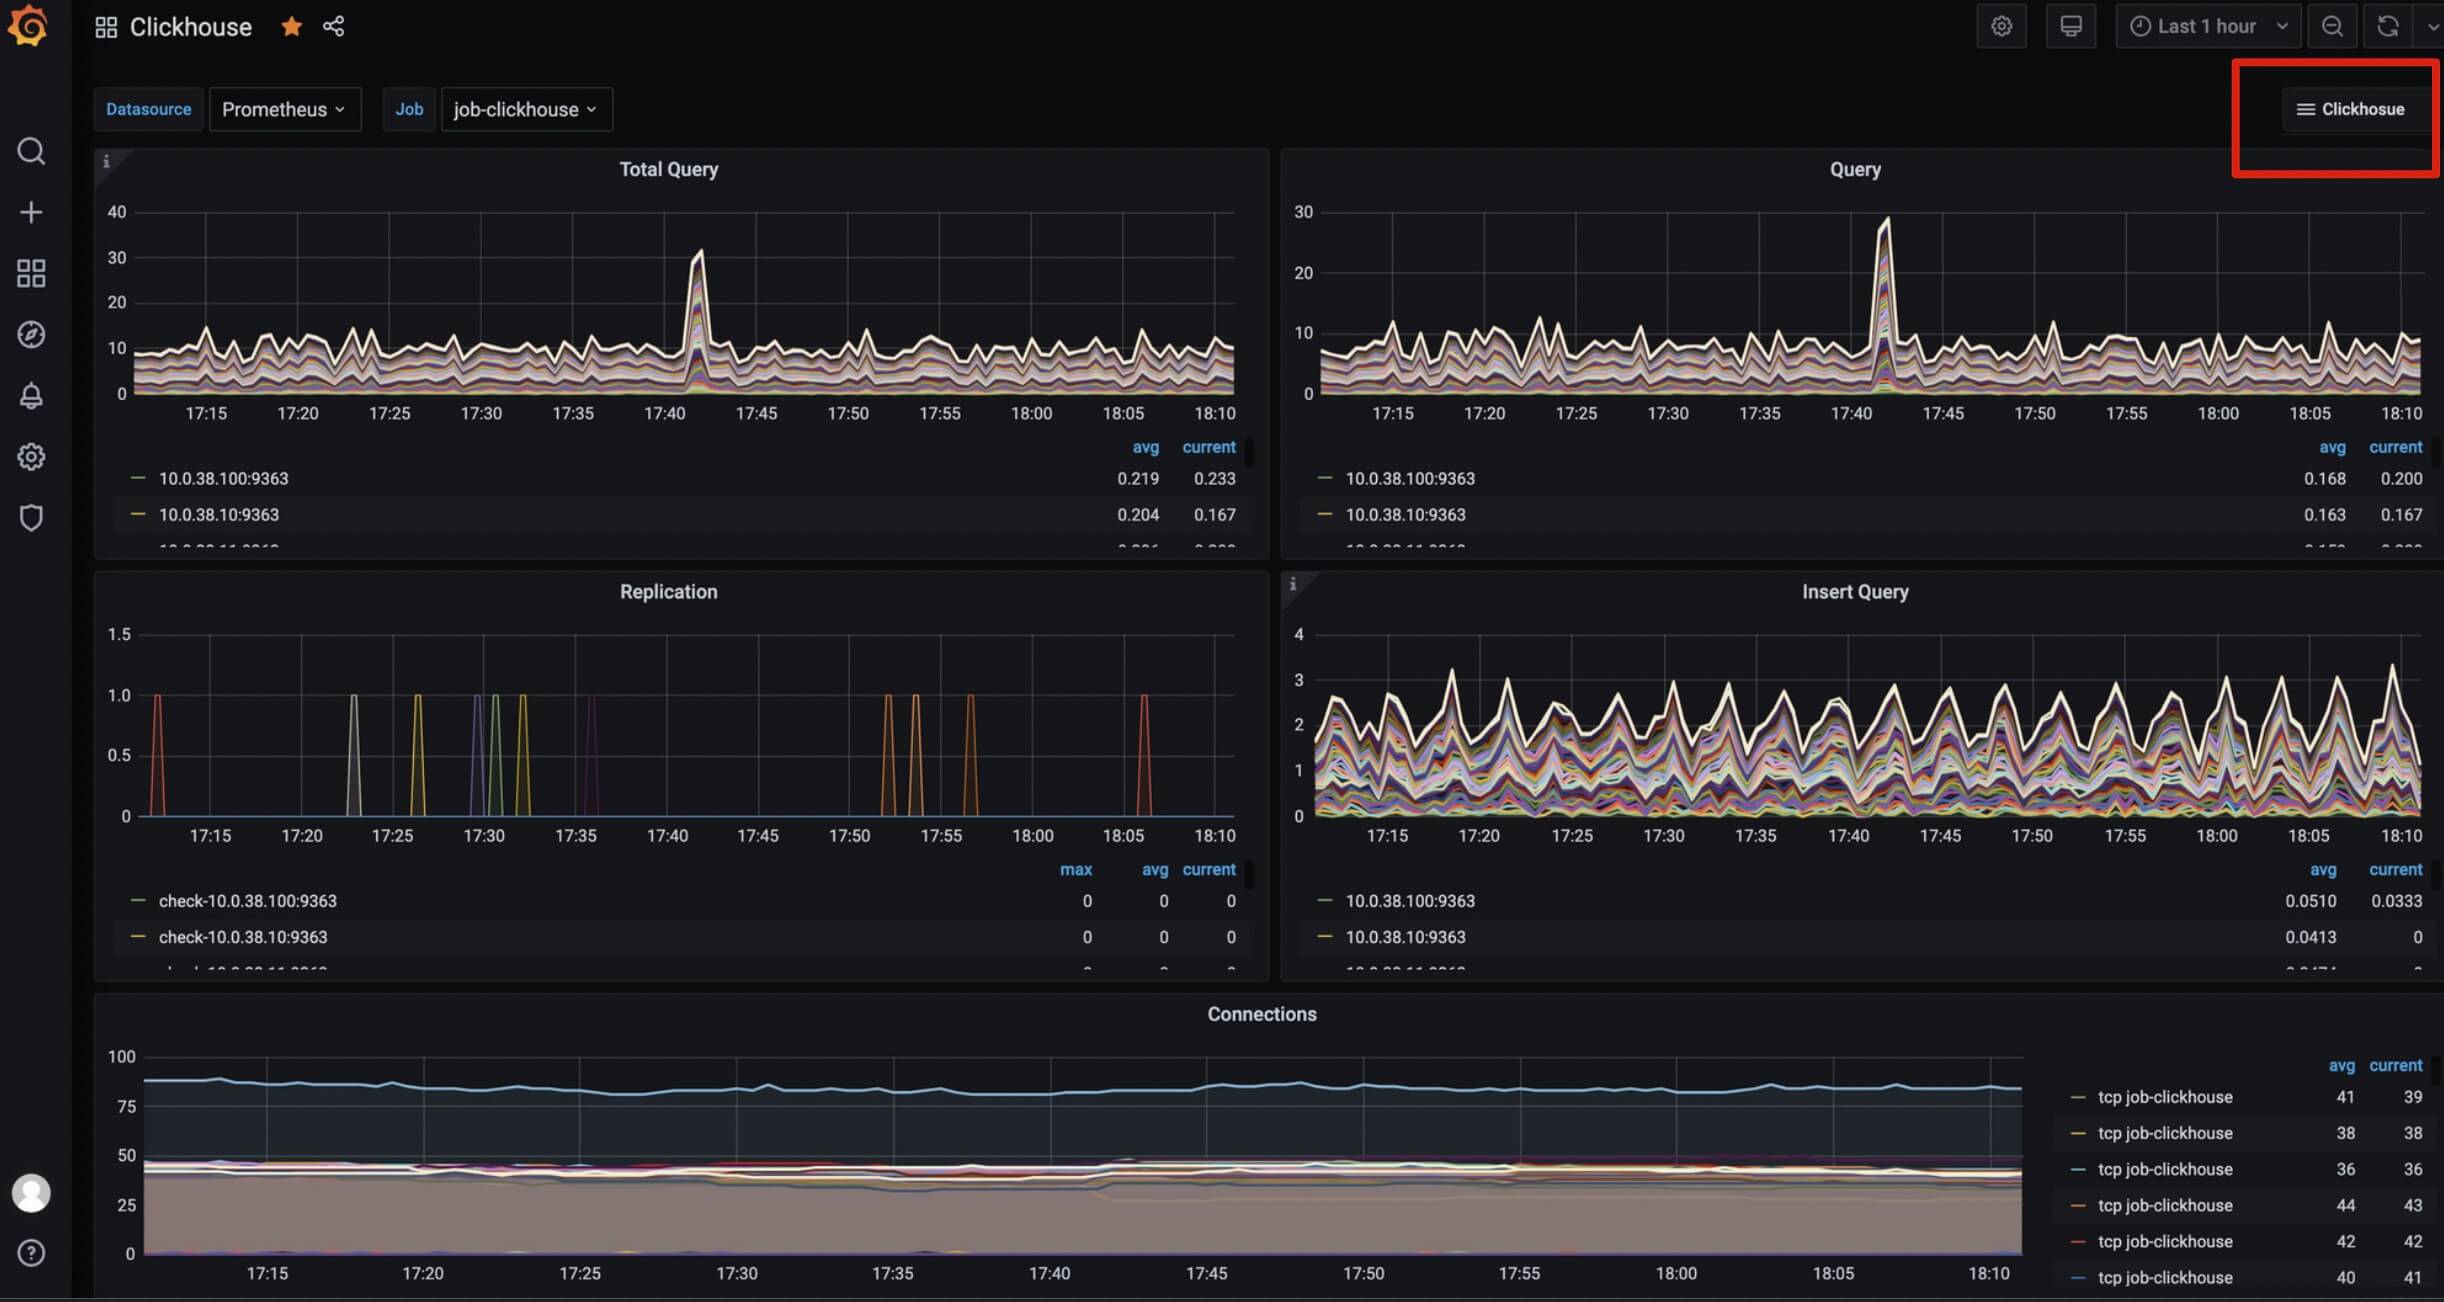
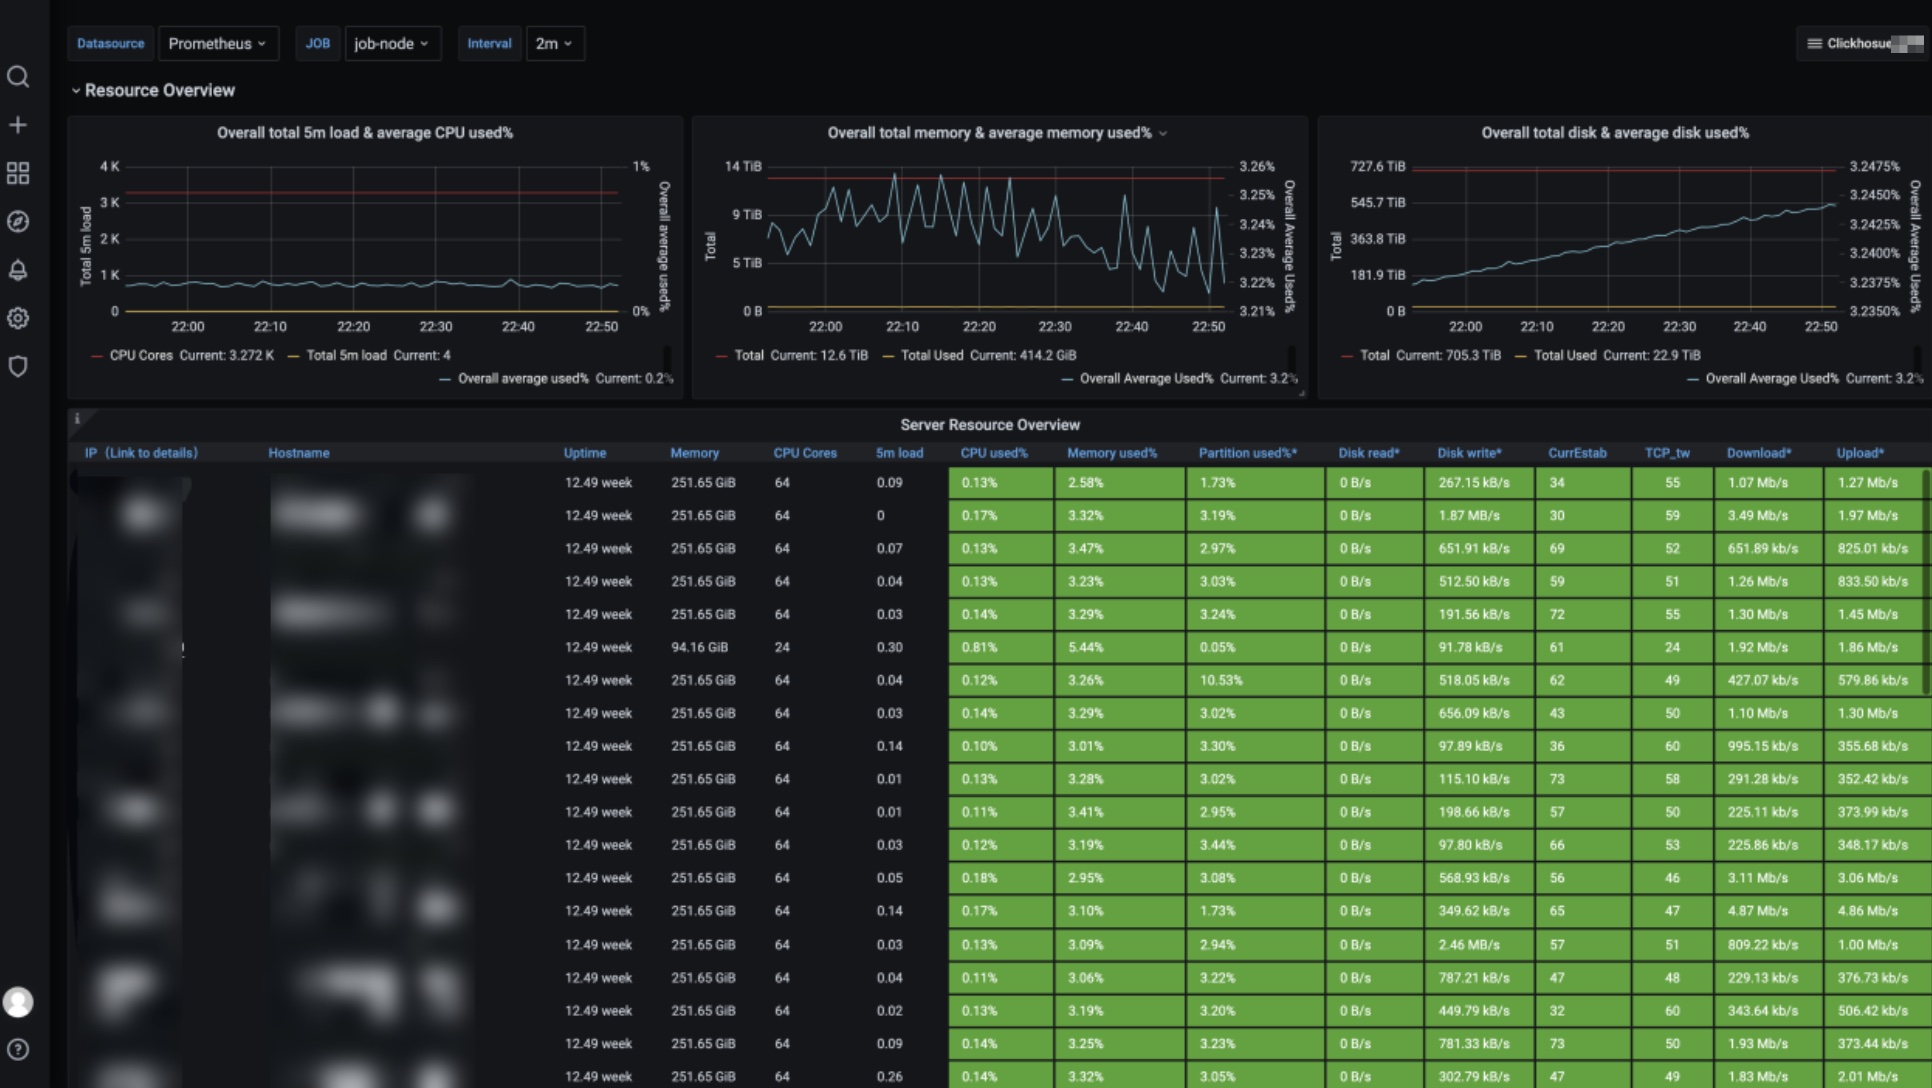
ClickHouse is preconfigured with four monitoring dashboards (ClickHouse cluster, Single-Node server, Multi-Node server, and Node overview). You can also customize dashboards as needed. The following describes the metrics and formulas for each dashboard.
Clickhouse cluster dashboard: See Metric Description for details. Click ClickHouse Monitoring in the top-right corner to switch to other dashboards.
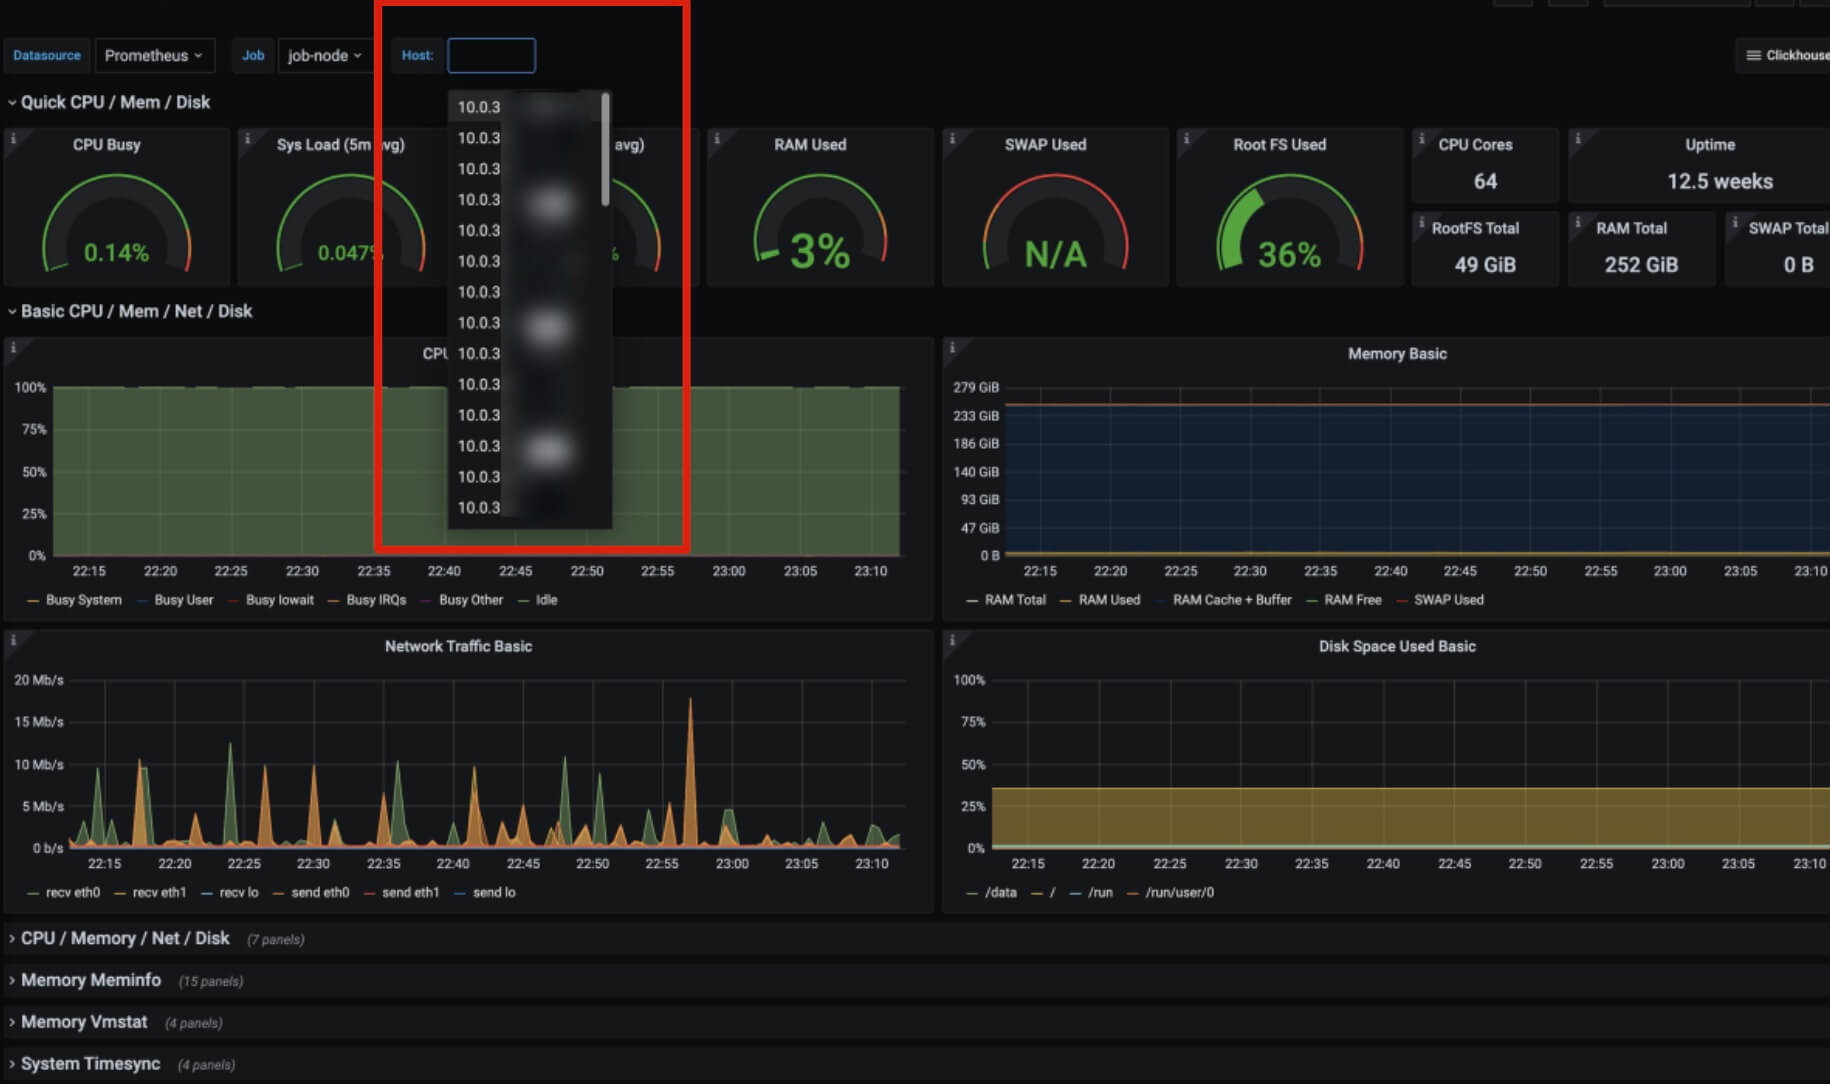
Single-node server dashboard: Details server metrics by IP.
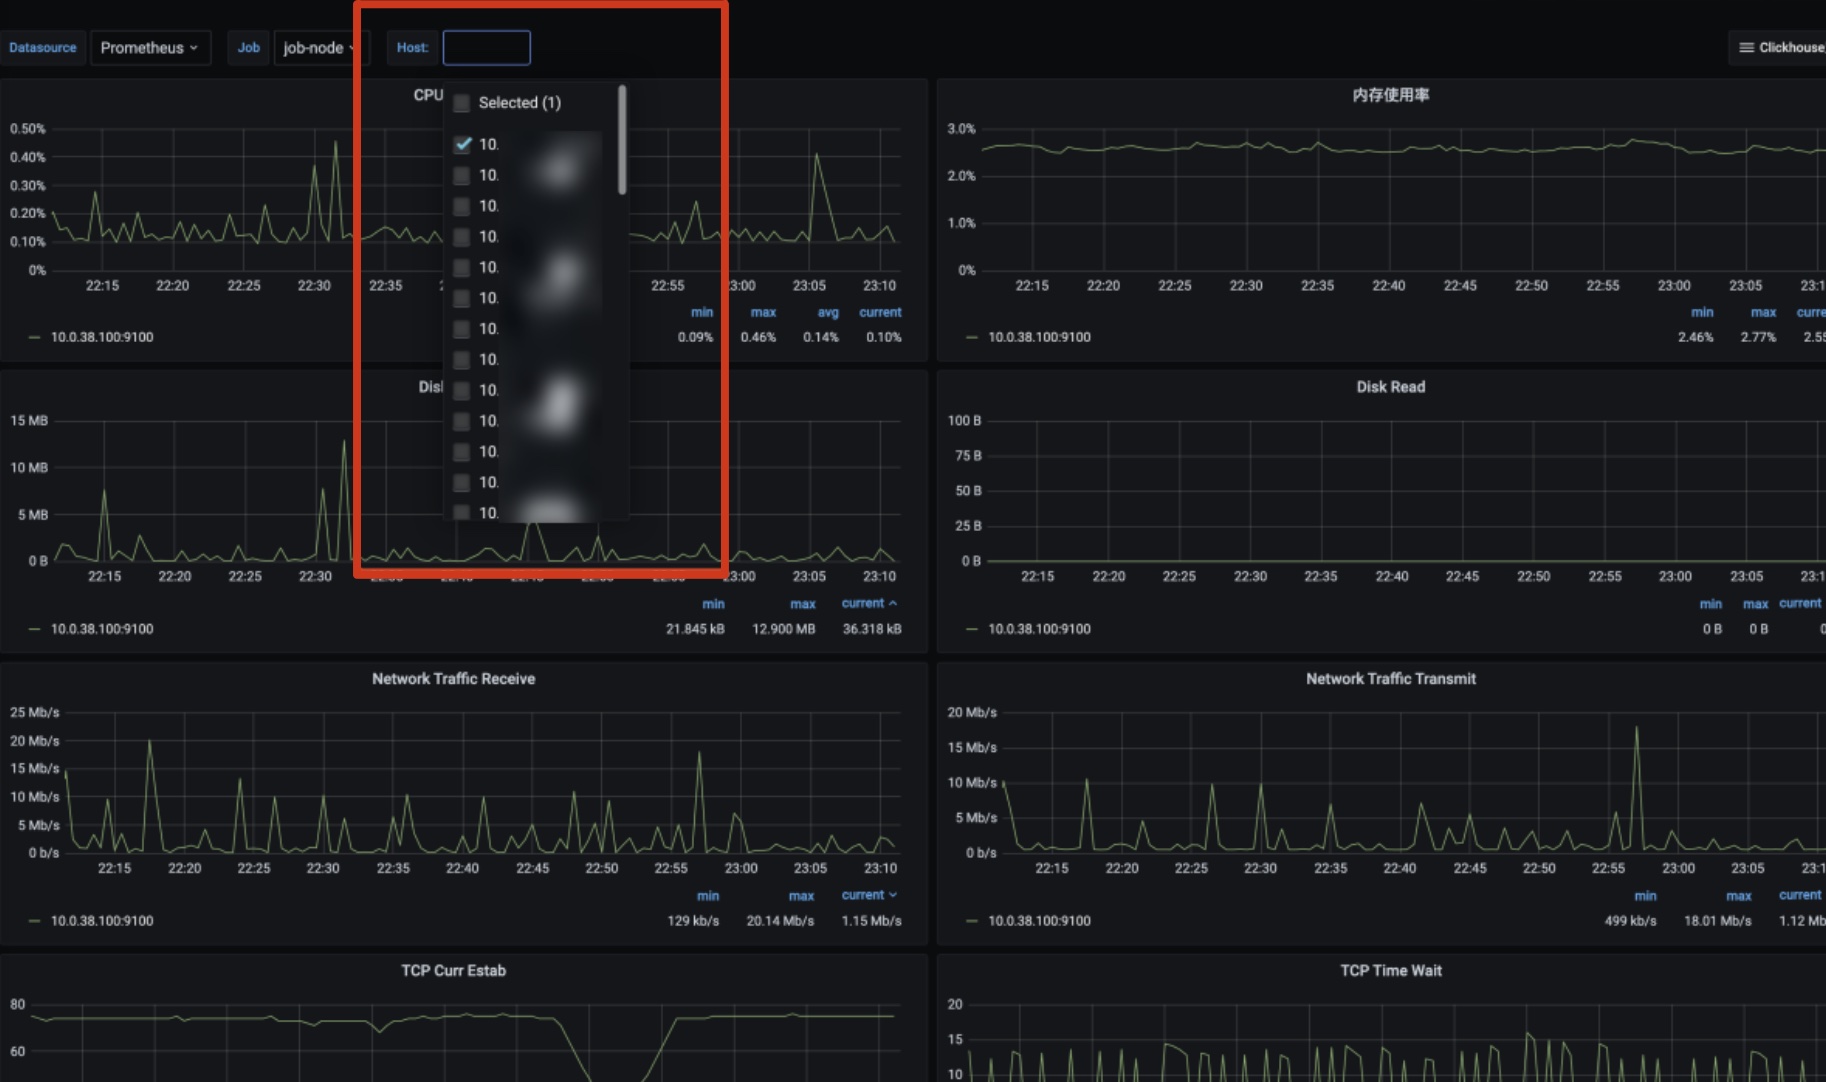
Multi-node server dashboard: Horizontally compares 8 basic server metrics by IP.
Node overview dashboard: Summarizes the basic server conditions of all nodes to offer a holistic picture of the entire cluster.
Metric calculation formula
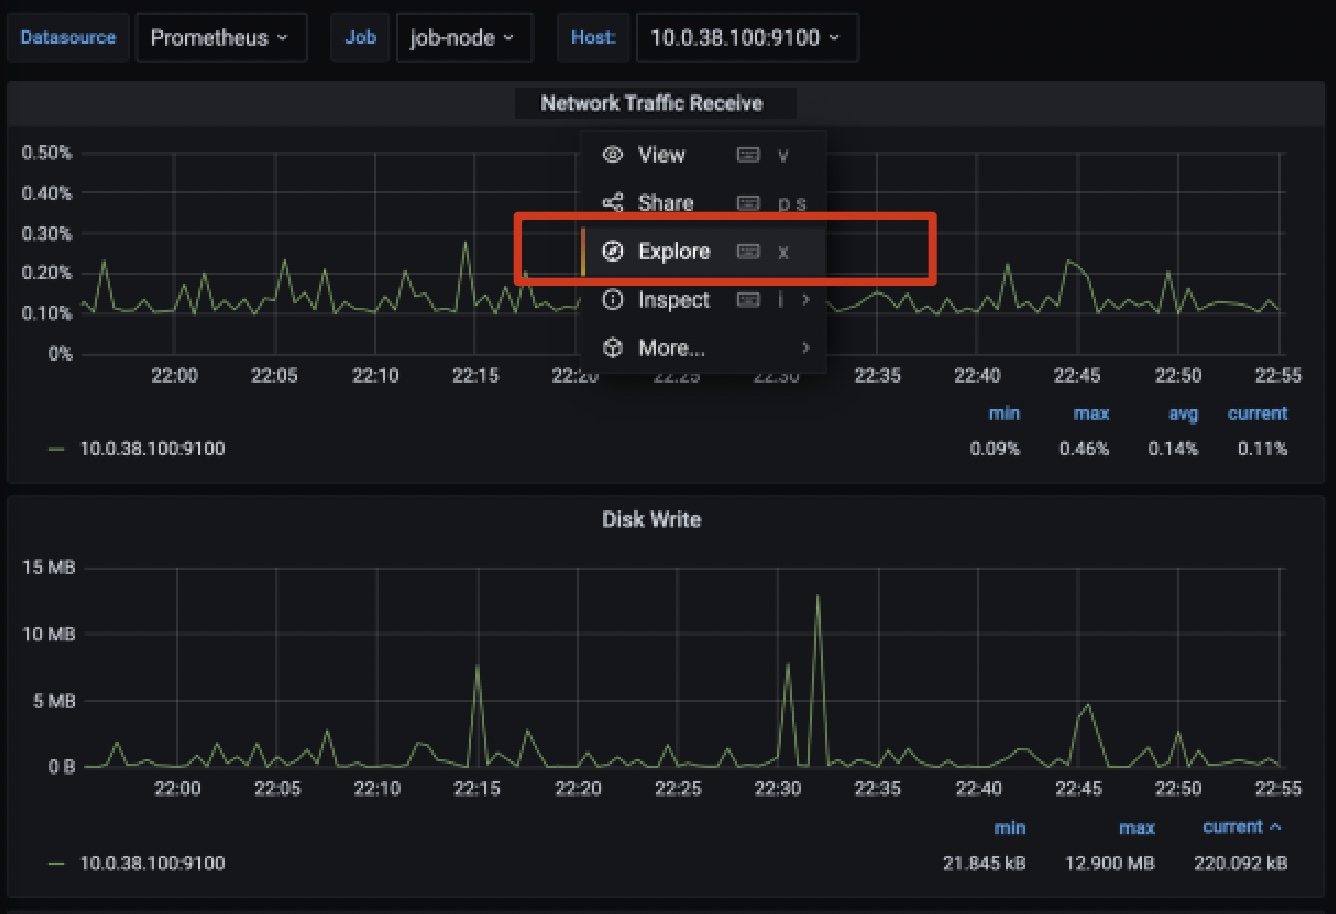
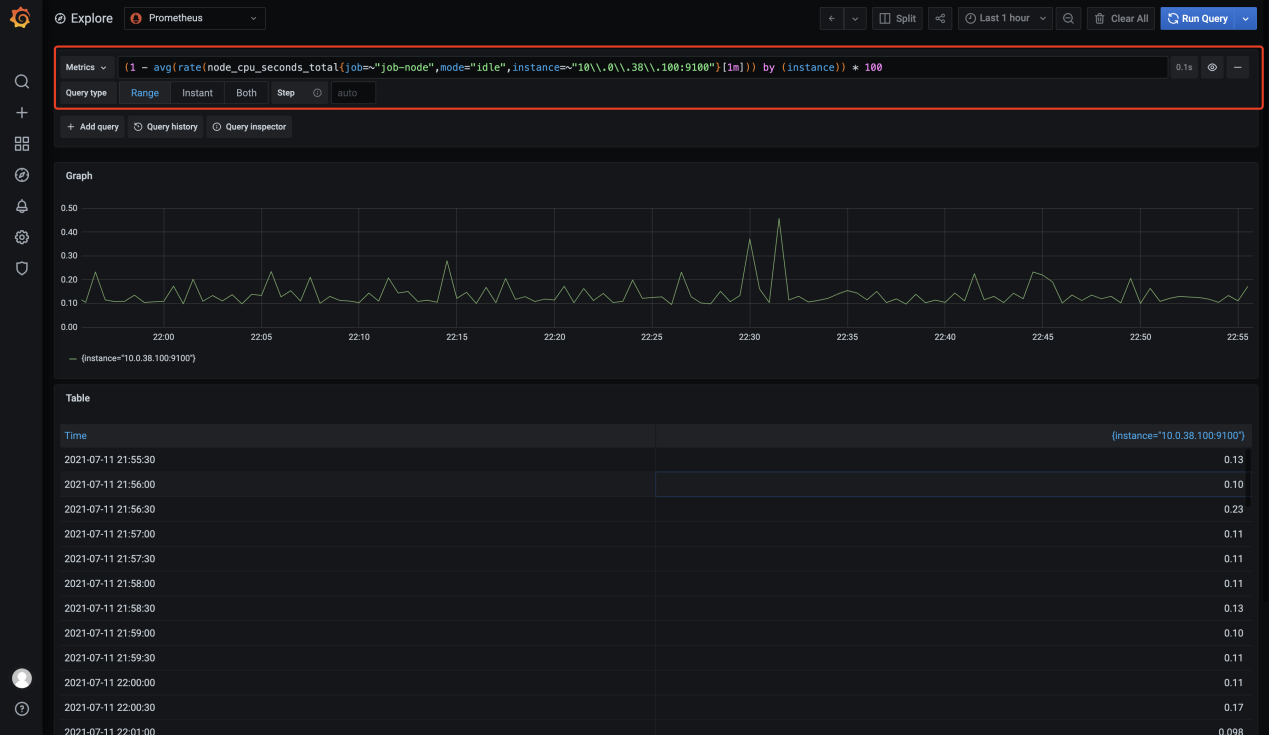
Click a dashboard name and select Explore in the drop-down list to learn the details of a metric.
In a specific calculation, node_cppu_seconds_total is the metric. For more metrics, see metrics.
Custom panel configuration
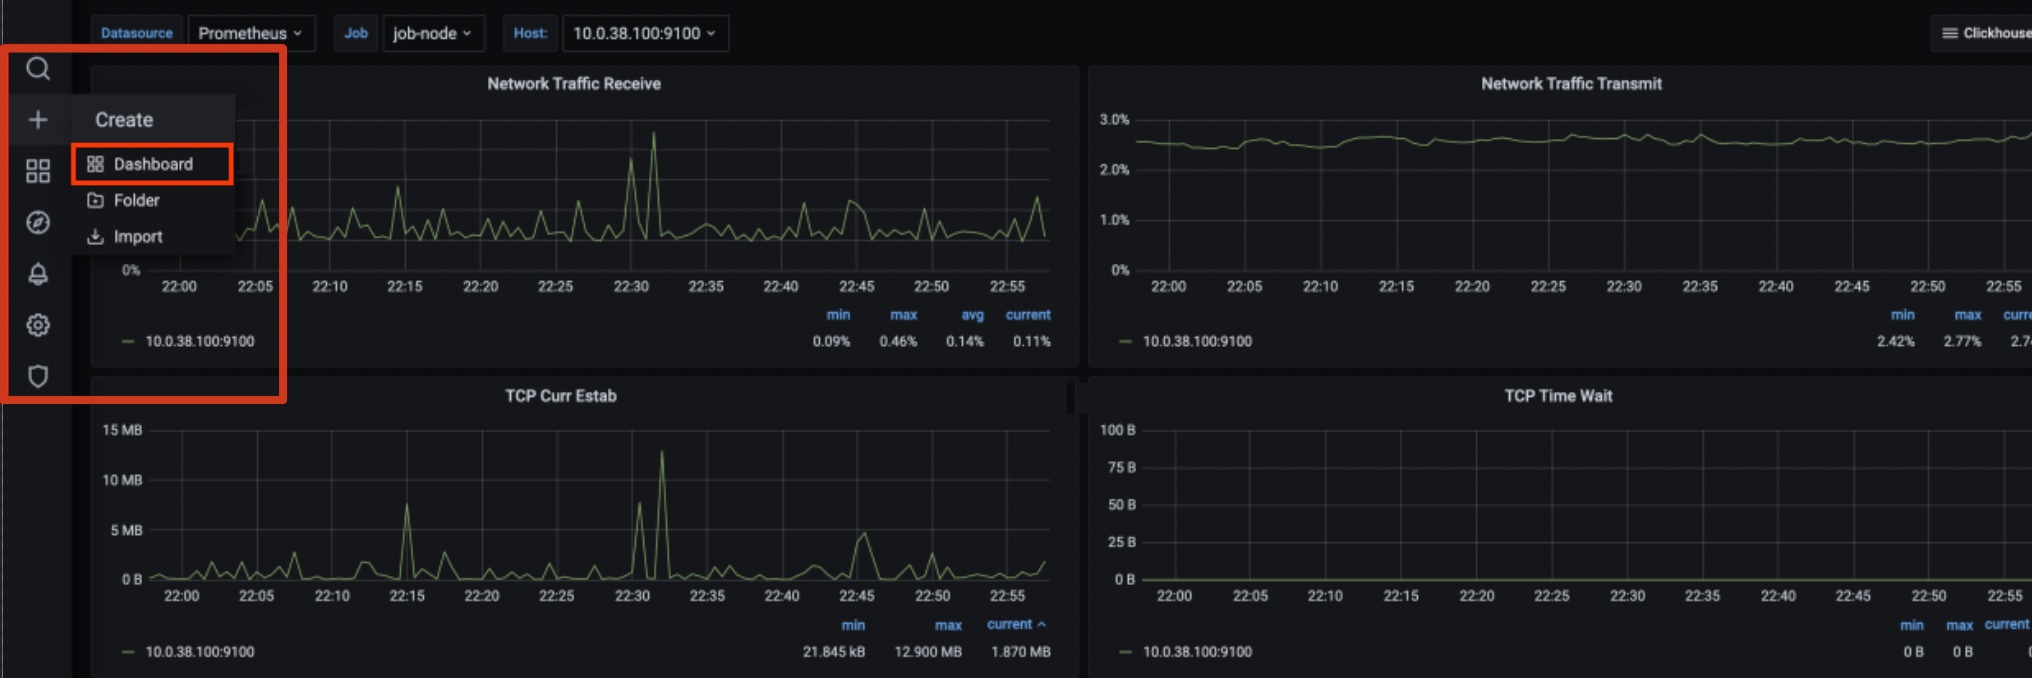
You can personalize a panel to fit your usage habits.
1. Click + on the left sidebar and select Dashboard in the drop-down list.
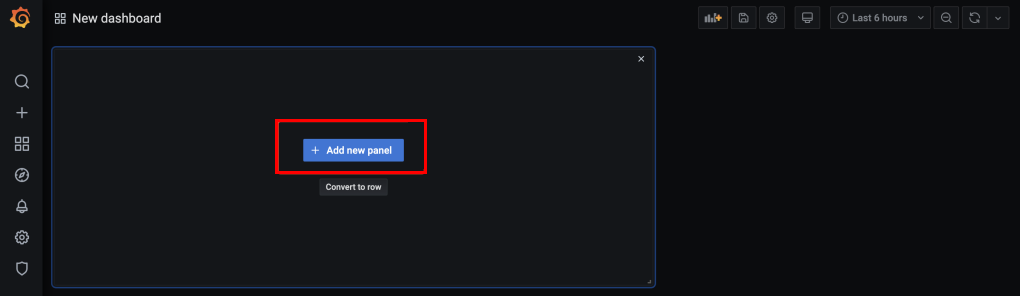
2. Click + Add new panel.
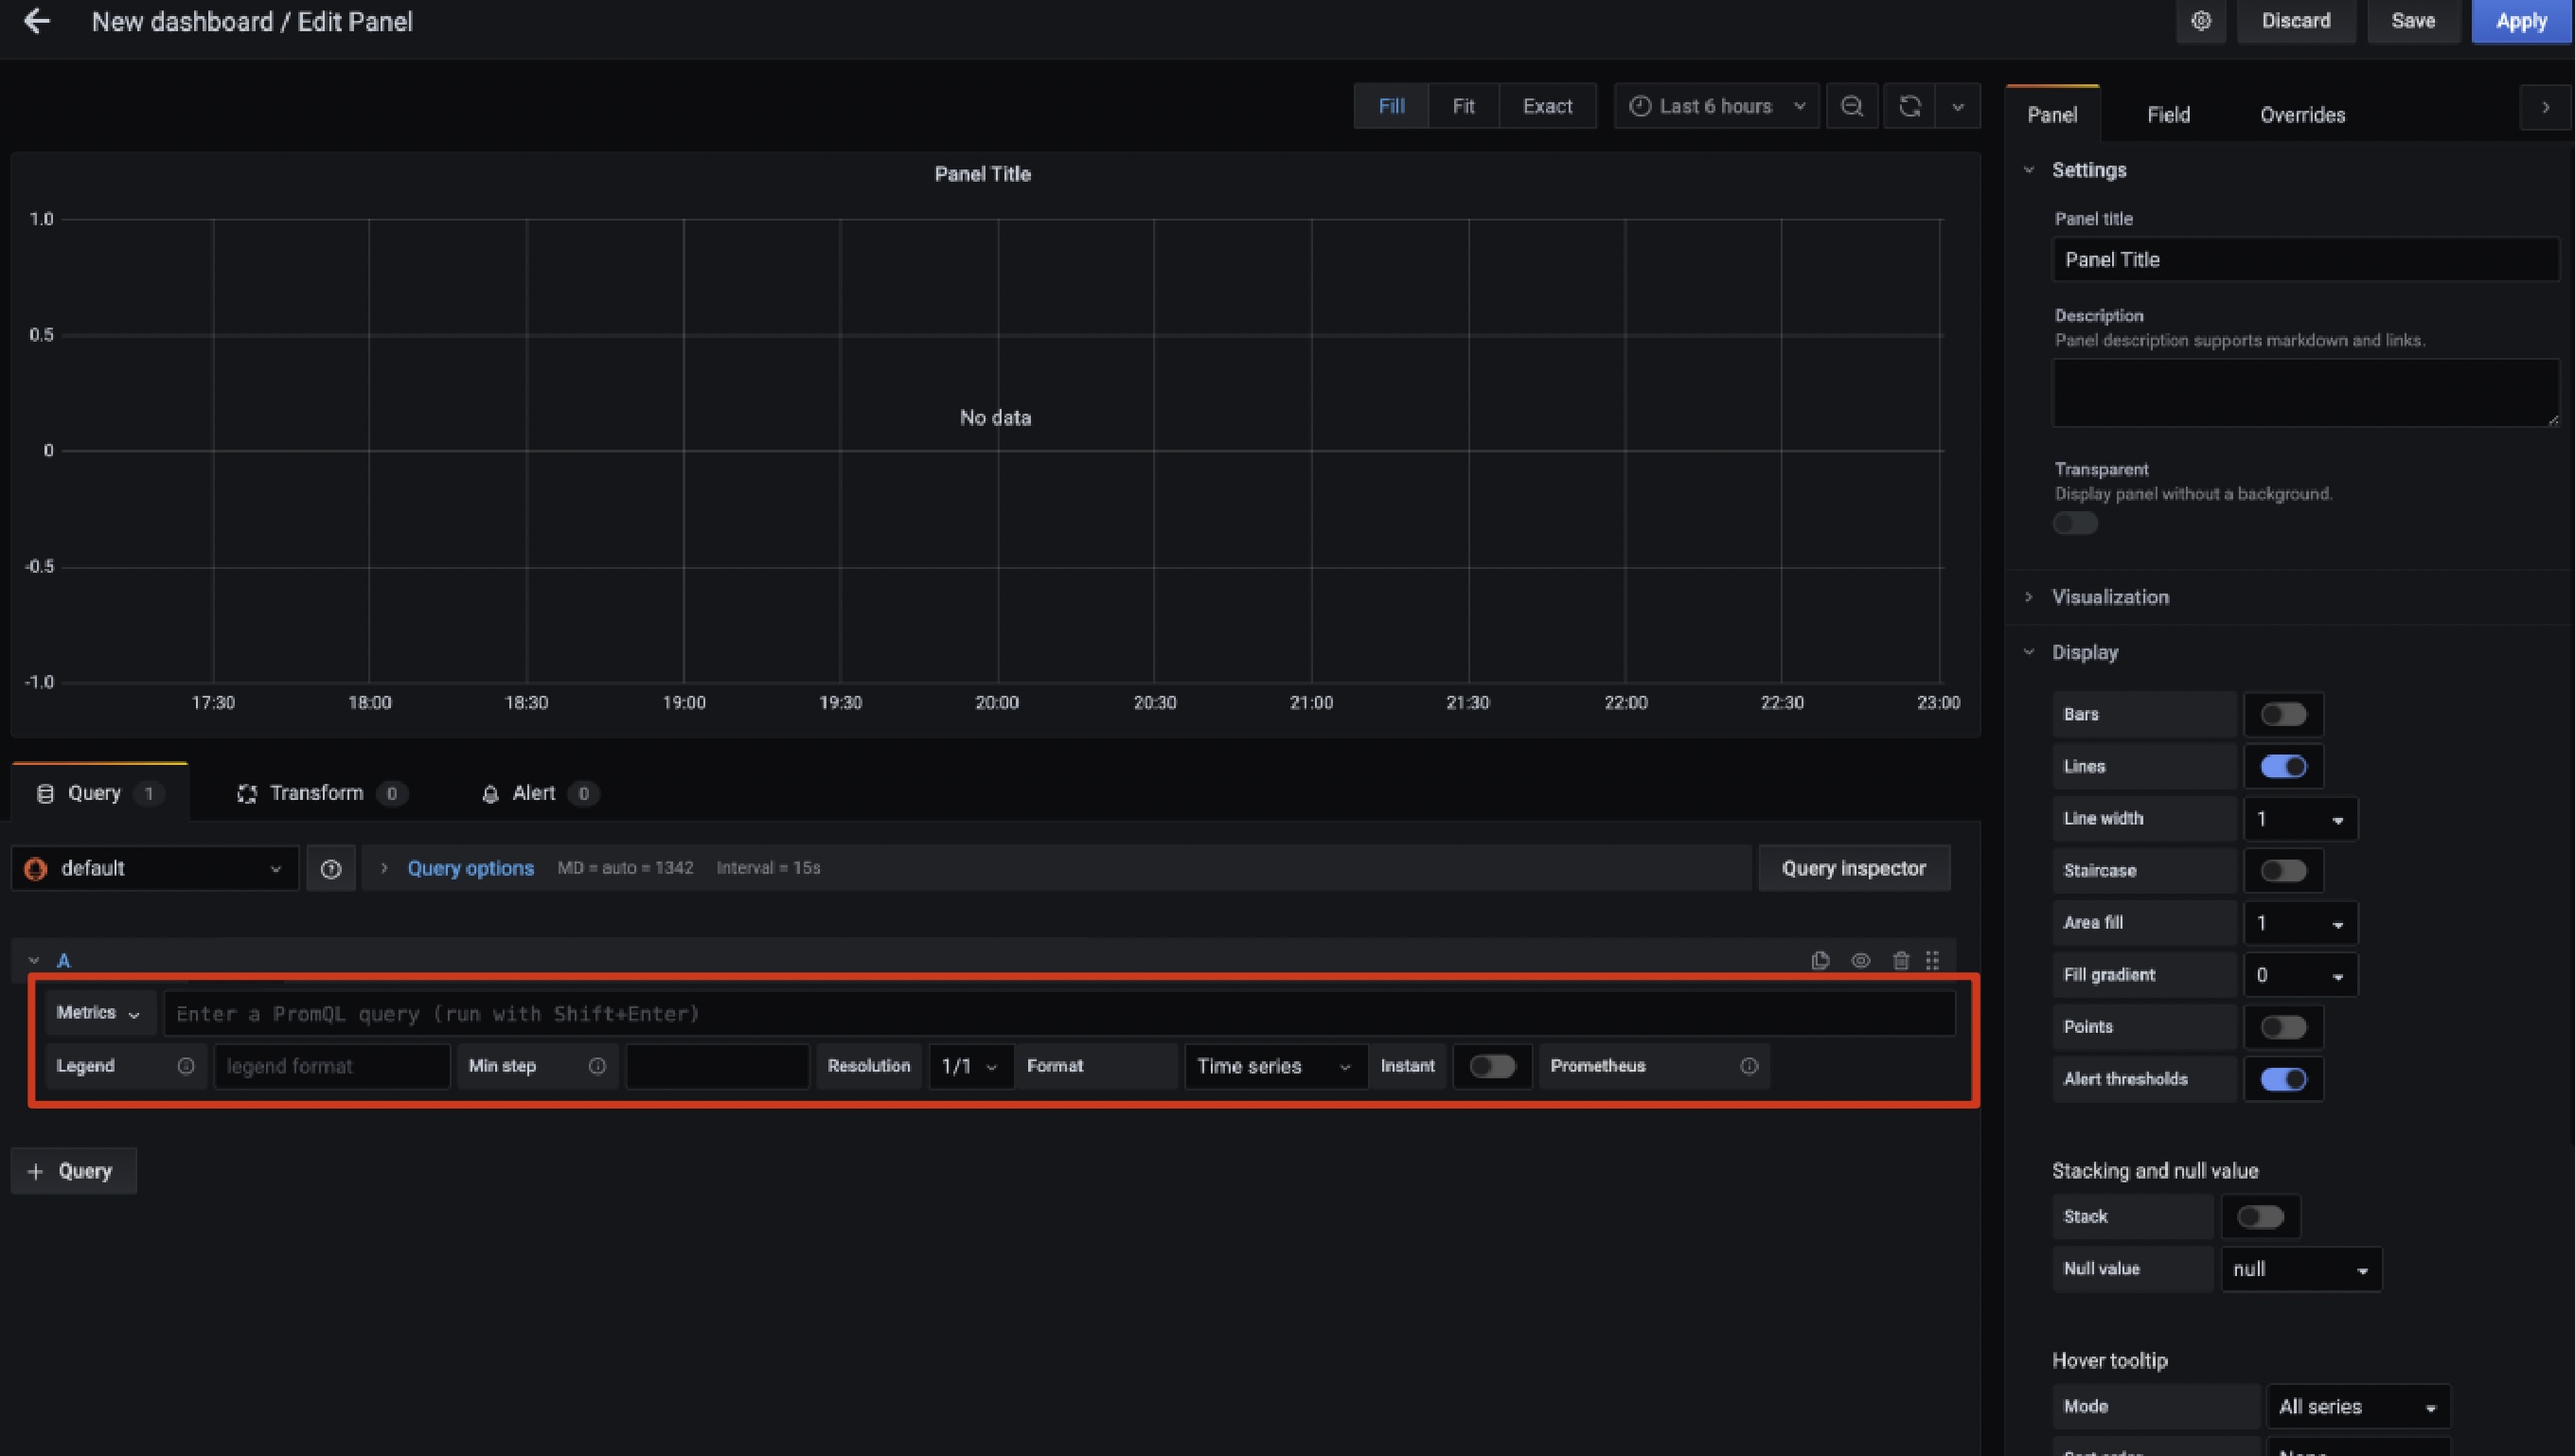
3. Enter a metric or click Metrics to view the calculated metrics.
4. You can select a display style on the right. For more information, see About Grafana panels.
5. Click Apply in the top-right corner and click Save.
Metrics
Metric
Description
Remarks
Total Query
Number of CRUD statements executed per unit of time
-
Query
Number of queries executed per unit of time
-
Replication
Sending, acquisition, and checking conditions of a single replica
-
Insert Query
Number of insertions executed per unit of time
-
Connections
Number of connections of each node
-
Read/Write Syscalls
Number of read/write system calls of each node
-
Number of Read/Write with a File Descriptor
Number of handles for file reads/writes and failed reads/writes per unit of time
-
Bytes of Read/Write with a File Descriptor
Size of files read and written per unit of time
-
Cache Rate
Cache hit rate and miss rate
Indicates repeated queries of the business
Selected Ranges
Number of index hits for a query, matching the amount of query data for a particular SQL hit
-
Selected Marks
Number of index hits for a query, matching the amount of query data for a particular SQL with a finer granularity
-
Merge1
Number of threads being merged
The number of merges should not be set too large. A high merge rate means that the amount of data imported per batch is too small, and the data is relatively concentrated and proportional to the part file directories
Merge2
Number of rows being merged
-
Merges Time
Compression and consumption time (rate)
It is related to the amount of compressed data
Parts of ReplicatedMergeTree Merged
Number of replicated parts merged per unit of time
-
Mutations
Number of replicated part mutations per unit of time
-
Pool Tasks
Number of tasks performed on the backend
-
Open Files
Number of file opens per unit of time
-
Compressed Read Buffer
Size of compressed read cache used per unit of time