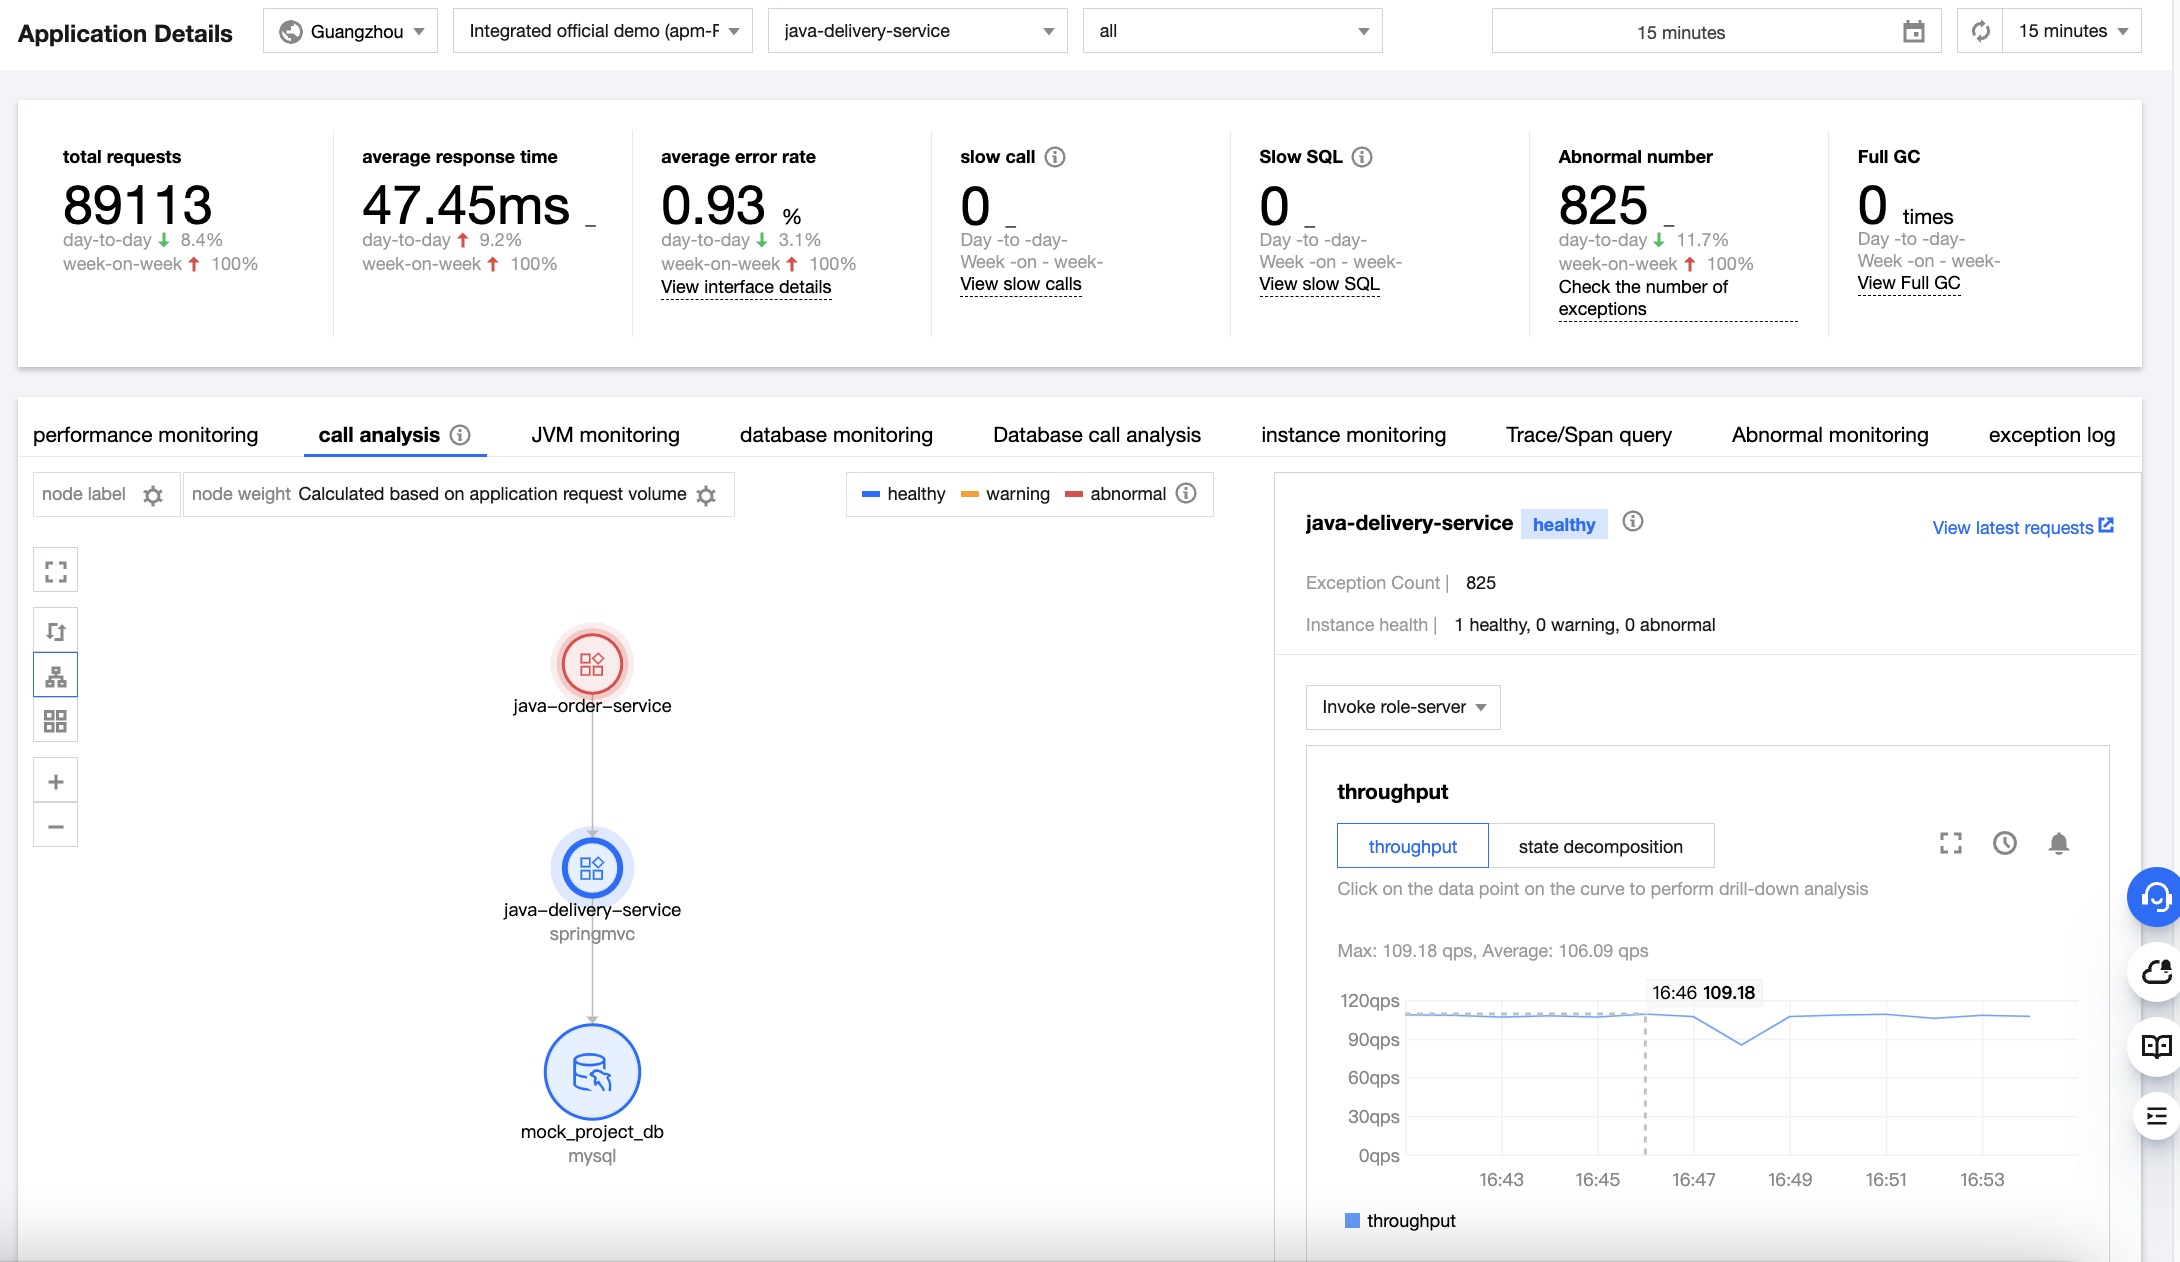
2. On the Application details page, you can view the total number of requests, average response time, average error rate, slow call, slow SQL, number of exceptions, and full GC of the service in the current time range.
Performance monitoring
This module displays the trend of the average response time, average throughput, average error rate, and Apdex of the application on the selected server or client within the specified time range. You can click the clock icon in the top-right corner of each chart to compare the data of any day in the last 30 days with the current data.
Call analysis
This module displays the upstream and downstream local topology centered on the current service. Hover over the target node to view the average throughput, response time, and error rate of the corresponding application.
APM uses topology icons in different colors for identification. Green indicates that the application is healthy, orange delayed, and red abnormal.
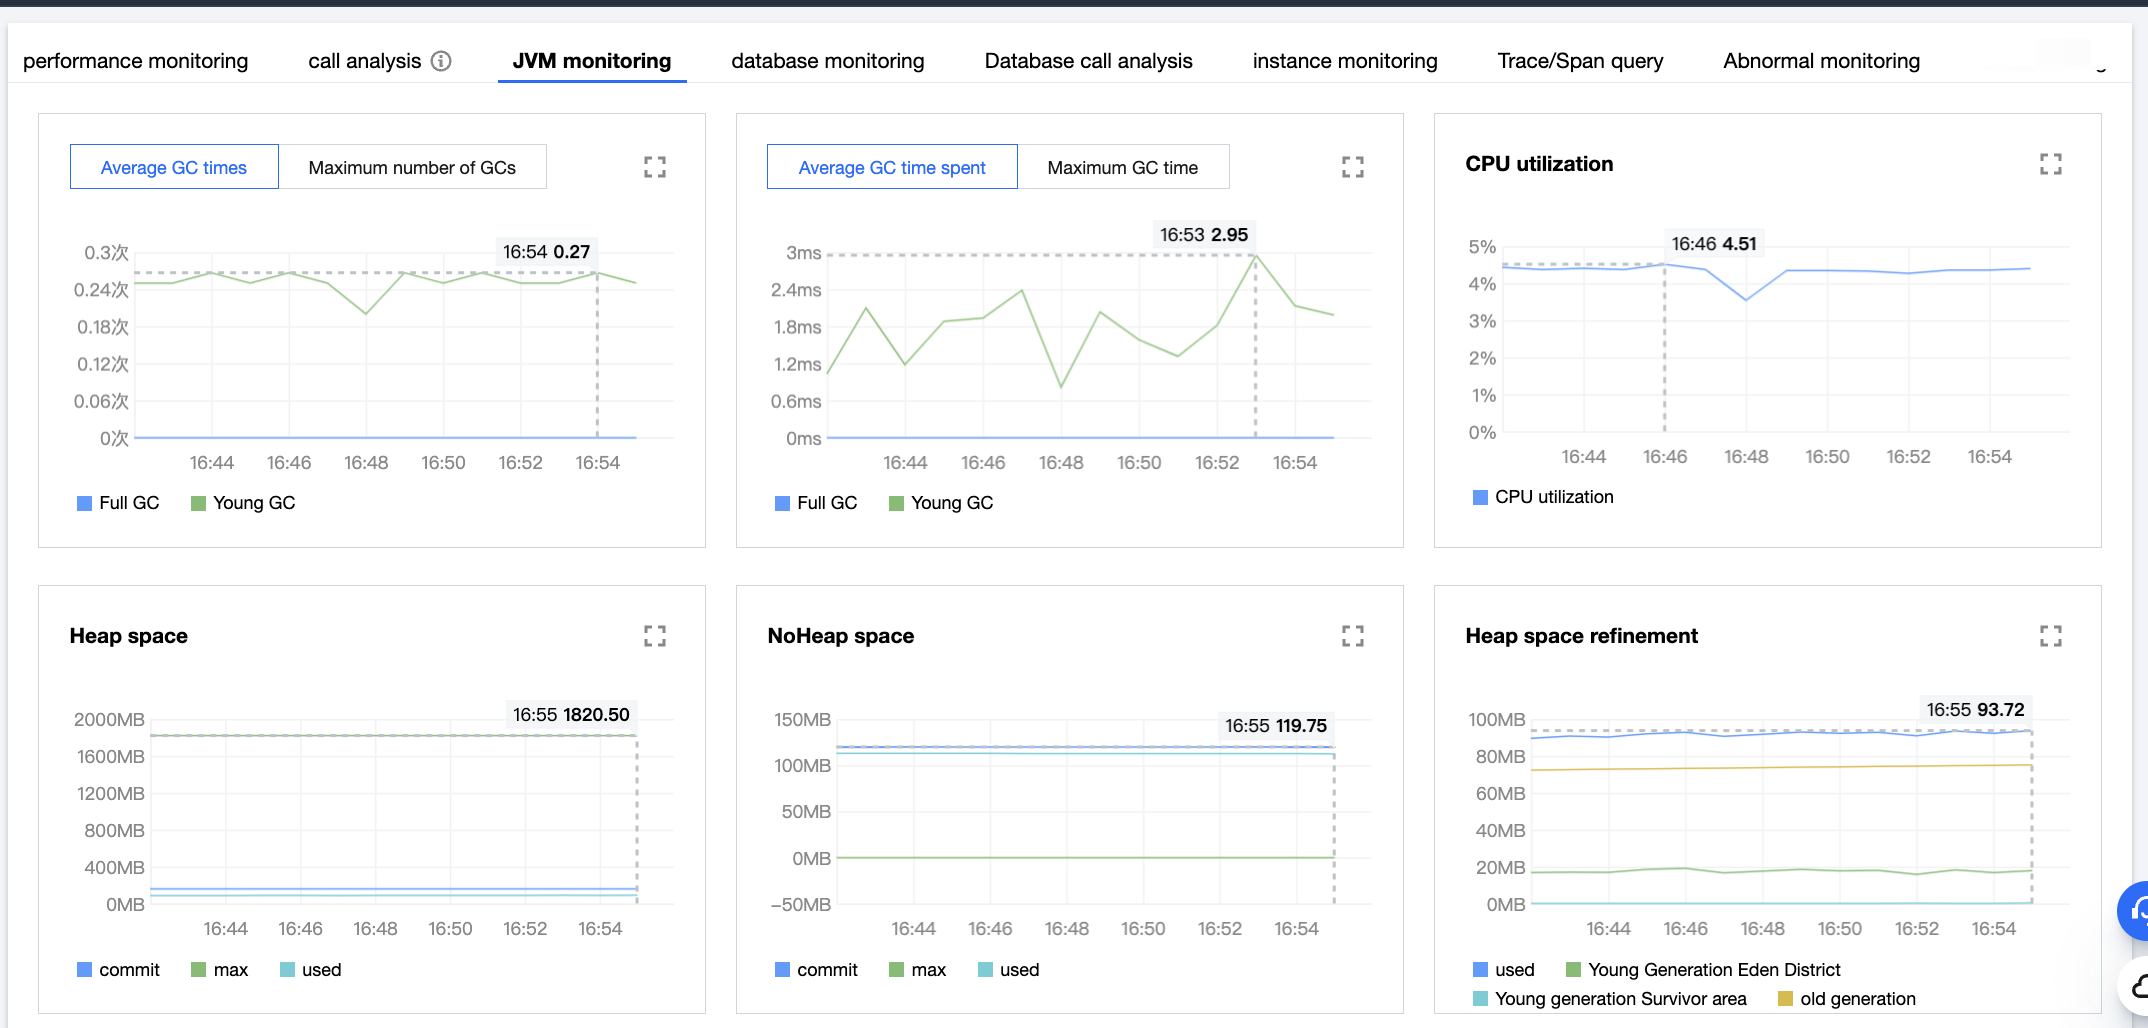
JVM monitoring
This module displays the trend of critical JVM metrics, including average/maximum garbage collection (GC) count, CPU utilization, heap space, NoHeap space, heap space refinement, and number of JVM threads.
Module
Monitoring Metric
GC count
Full GC count
Young GC count
GC time
Full GC time
Young GC time
Heap/NoHeap space
Committed
Max
Used
Heap space refinement
Used young generation
Eden space
Survivor space
Old generation
JVM threads/minute
Number of TIMED_WAITING threads
Number of WAITING threads
Number of RUNNABLE threads
Number of created threads
Number of terminated threads
Number of blocked threads
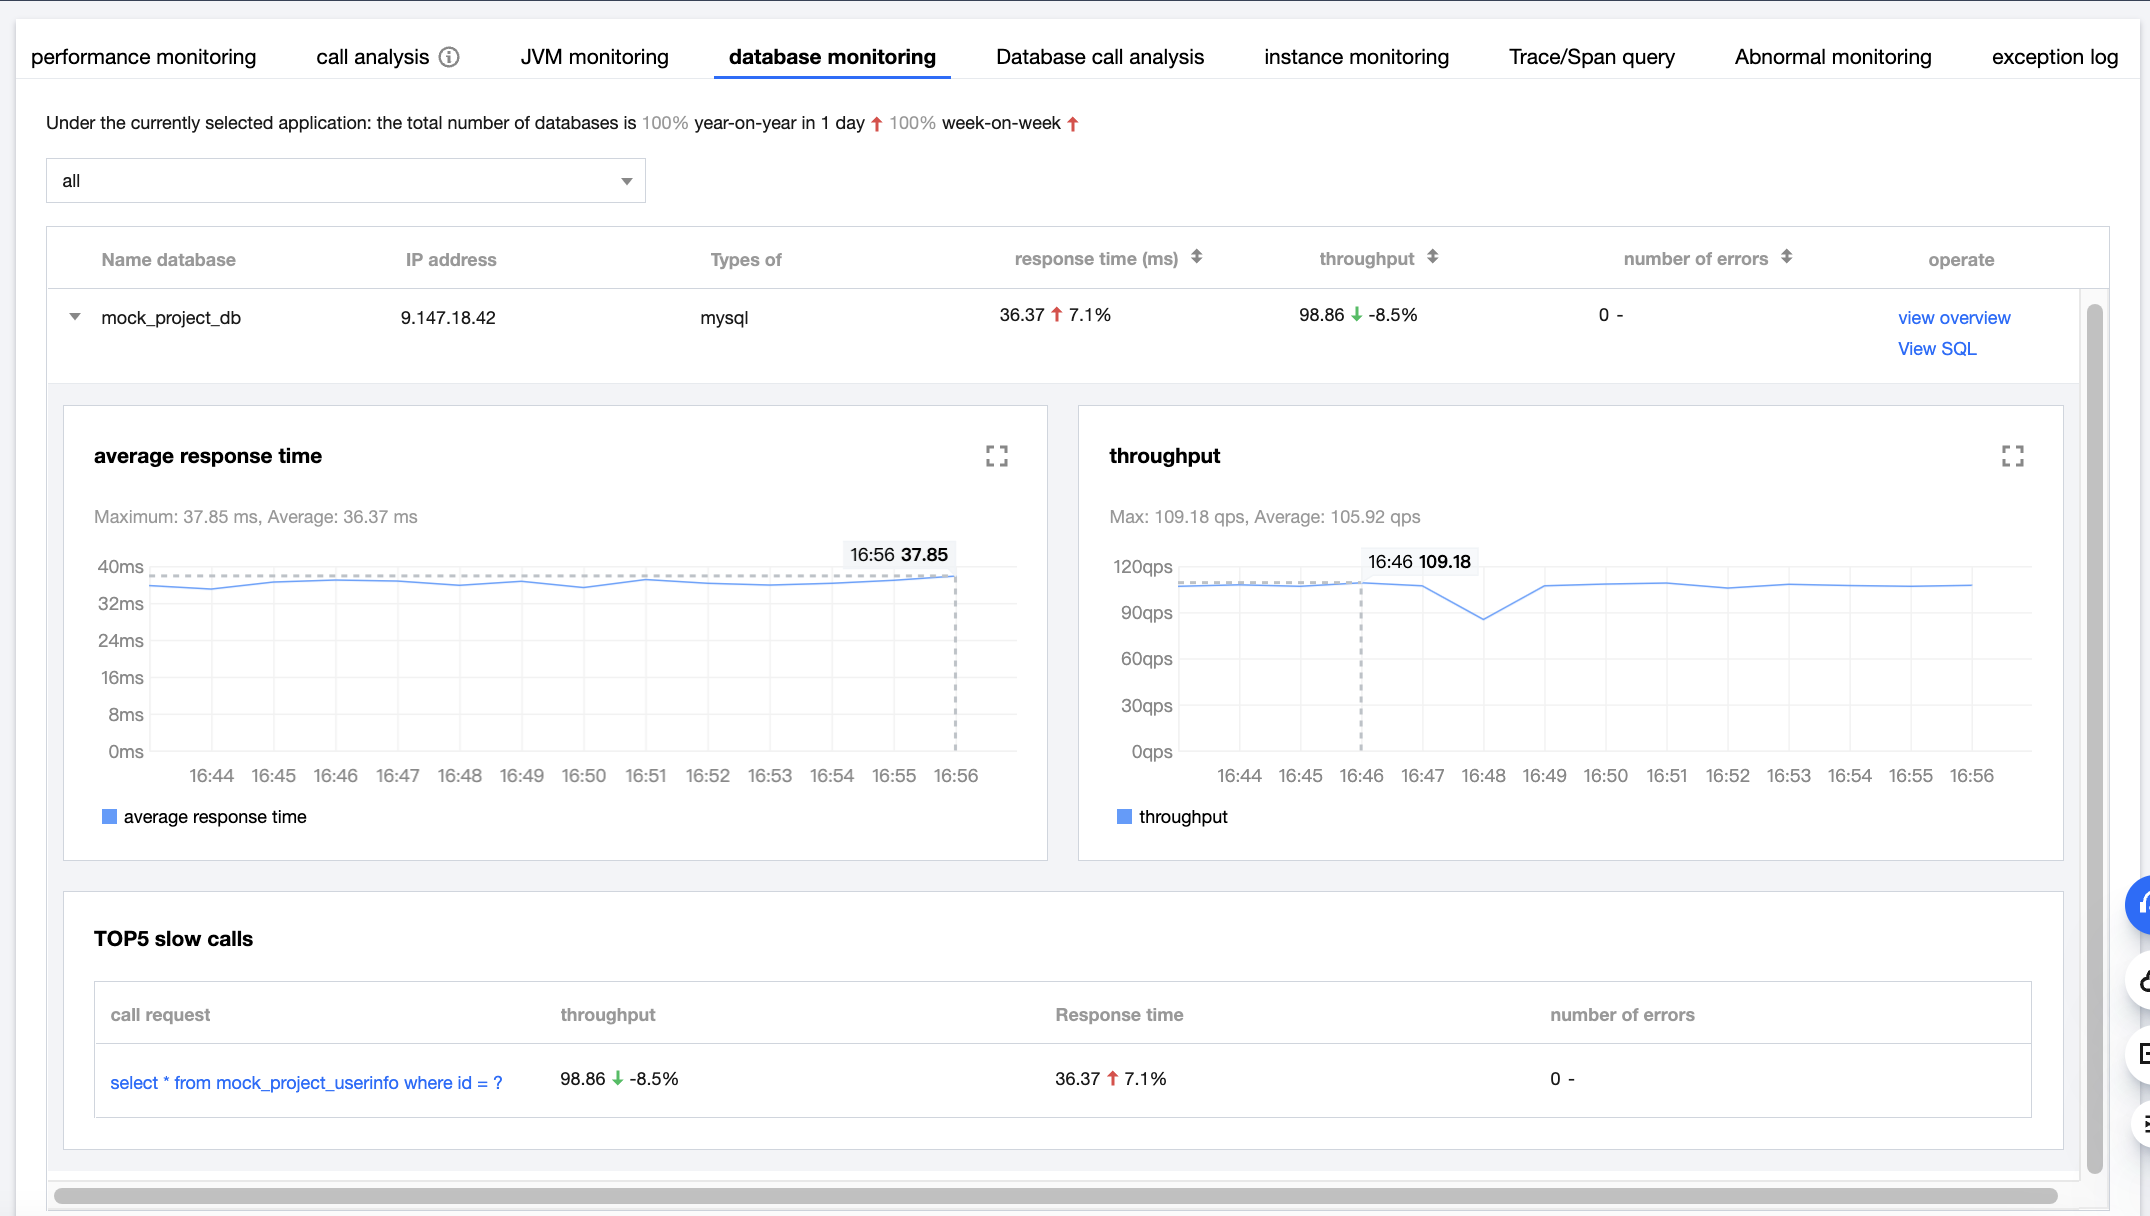
Database monitoring
This module displays the information of database calls, including the average response time, throughput, and top 5 slow calls. You can also click Overview or View SQL for more details.
Metric description
Metric
Description
Throughput
The average throughput of the current application
Throughput status breakdown
The proportions of successful and failed requests
Slow call
The API calls that took more than 500 ms to execute
Slow SQL
The SQL queries that took more than 2,000 ms to execute
Full GC
The number of full GCs performed by JVM
Avg response time
The average response time of all APIs at the 1-minute granularity among the call relationships of the selected service
Avg error rate
The average error rate of all APIs at the 1-minute granularity among the call relationships of the selected service
Top 5 slow APIs
The top 5 slow APIs at the 1-minute granularity among the call relationships of the selected service
Top 5 erroneous APIs
The top 5 erroneous APIs at the 1-minute granularity among the call relationships of the selected service
Avg GC times
The average number of GCs executed by all JVM instances per minute
Max GC times
The maximum number of GCs executed by all JVM instances per minute
Avg GC time
The average duration of GC executions by all JVM instances per minute
Max GC time
The maximum duration of GC executions by all JVM instances per minute
CPU utilization
The CPU resource utilization of running programs per minute
Heap space
The status of the heap space per minute (committed, max, or used)
NoHeap space
The status of the NoHeap space per minute (committed, max, or used)
Thread pool
The number of active threads in the thread pool per minute
Throughput (database)
The average throughput of the current database
Average response time
The average response time of all calls of the selected database and instance at the 1-minute granularity
Top 5 callers
The top 5 upstream applications/components calling the selected database most frequently