
GPU 型实例安装 RDMA 毫秒级监控组件

最后更新时间:2024-08-20 17:08:36
功能简介
高性能计算集群具备在 RDMA 网络环境下实现毫秒级监控的能力,这使得您能够实时监测和分析瞬时的网络数据,帮助您深入分析网络流量模式,进行网络优化和性能提升,为业务提供有力支持。
操作场景
本文介绍如何在腾讯云高性能计算集群环境中安装毫秒级监控组件,实现您在腾讯云 RDMA 环境中毫秒级的性能监控。腾讯云提供两种监控数据的查看方式,您可以选择在云产品监控上查看毫秒级监控的统计数据或在实例本地查看保存的监控日志。
注意:
RDMA 毫秒级监控启动后约会占用小于 0.05 个核资源,可根据业务需要判断是否使用。
操作步骤
准备环境
1. 创建 GPU 型 HCCPNV4sne、GPU 型 HCCPNV4sn 或 GPU 型 HCCPNV5v 高性能计算集群实例,镜像建议选择 TencentOS Server 2.4 (TK4)。
2. 为 GPU 型实例安装 GPU 驱动和 nvidia-fabricmanager 服务。
安装验证
1. 在 TencentOS Server 2.4 (TK4) 环境下,您可以使用以下命令安装:
# 卸载已有增强型监控软件包rpm -e rdma_monitor-1.0-1.tl2.x86_64# 下载并安装毫秒级监控组件,# 安装好软件包后,会自动注册系统服务来启动增强型监控并保活,无需手动启动wget http://mirrors.tencentyun.com/install/GPU/rdma_monitor-1.0-1.tl2.x86_64.rpm && rpm -ivh rdma_monitor-1.0-1.tl2.x86_64.rpm
2. 使用以下命令,验证是否安装成功:
ps -aux | grep monitor_server
执行命令,如果红字所示字段,代表增强型监控成功安装启动。

云产品监控查看
RDMA 毫秒级监控可在云产品监控查看统计数据,您可以在云产品监控-dashboard 中配置您需要的监控指标,操作步骤如下:
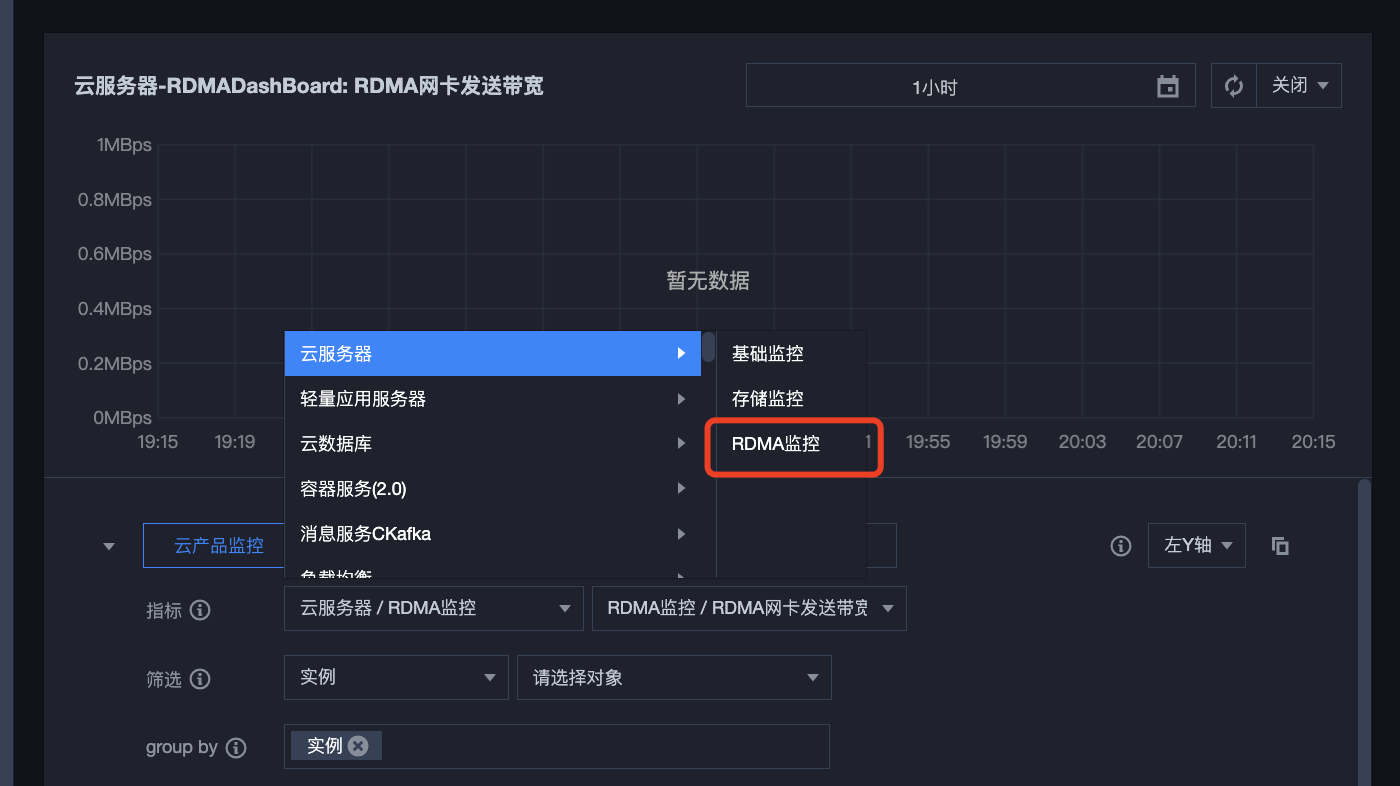
1. 新建 dashboard,指标选择 云服务器-RDMA 监控:
2. 选择您需要监控的 RDMA 毫秒级统计指标。
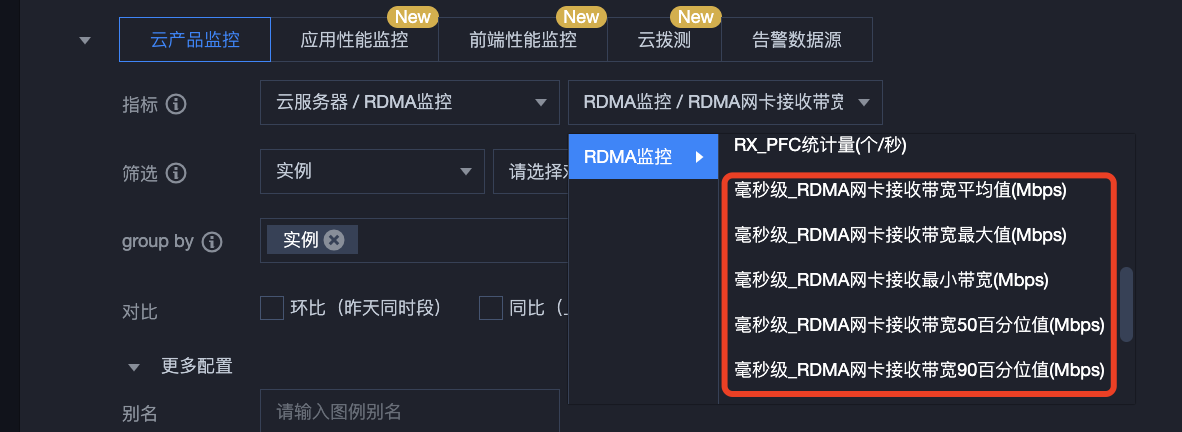
云产品监控支持查看以下统计数据,您可以根据需要在云产品监控 dashboard 配置。
指标英文名 | 指标中文名 | 指标说明(非必填) | 单位 | 维度 | 统计粒度 |
RxHpbwAvg | 毫秒级_RDMA 网卡接收带宽平均值 | 10秒内 RDMA 网卡接收带宽的毫秒级统计粒度平均值 | Mbps | InstanceId | 10s、60s、 300s、 3600s |
RxHpbwMax | 毫秒级_RDMA 网卡接收带宽最大值 | 10秒内 RDMA 网卡接收带宽的毫秒级统计粒度最大值 | Mbps | InstanceId | 10s、60s、 300s、 3600s |
RxHpbwMin | 毫秒级_RDMA 网卡接收带宽最小值 | 10秒内 RDMA 网卡接收带宽的毫秒级统计粒度最小值 | Mbps | InstanceId | 10s、60s、 300s、 3600s |
RxHpbwP50 | 毫秒级_RDMA 网卡接收带宽50百分位值 | 10秒内从小到大 RDMA 网卡接收带宽的毫秒级统计粒度前50百分位数 | Mbps | InstanceId | 10s、60s、 300s、 3600s、 86400s |
RxHpbwP90 | 毫秒级_RDMA 网卡接收带宽90百分位值 | 10秒内从小到大 RDMA 网卡接收带宽的毫秒级统计粒度前90百分位数 | Mbps | InstanceId | 10s、60s、 300s、 3600s |
TxHpbwAvg | 毫秒级_RDMA 网卡发送带宽平均值 | 10秒内 RDMA 网卡发送带宽的毫秒级统计粒度平均值 | Mbps | InstanceId | 10s、60s、 300s、 3600s |
TxHpbwMax | 毫秒级_RDMA 网卡发送带宽最大值 | 10秒内 RDMA 网卡发送带宽的毫秒级统计粒度最大值 | Mbps | InstanceId | 10s、60s、 300s、 3600s |
TxHpbwMin | 毫秒级_RDMA 网卡发送带宽最小值 | 10秒内 RDMA 网卡发送带宽的毫秒级统计粒度最小值 | Mbps | InstanceId | 10s、60s、 300s、 3600s |
TxHpbwP50 | 毫秒级_RDMA 网卡发送带宽50百分位 | 10秒内从小到大 RDMA 网卡发送带宽毫秒级统计粒度前50百分位数 | Mbps | InstanceId | 10s、60s、 300s、 3600s |
TxHpbwP90 | 毫秒级_RDMA 网卡发送带宽90百分位 | 10秒内从小到大 RDMA 网卡发送带宽毫秒级统计粒度前90百分位数 | Mbps | InstanceId | 10s、60s、 300s、 3600s |
3. 选择需要监控的高性能计算集群实例 ID。

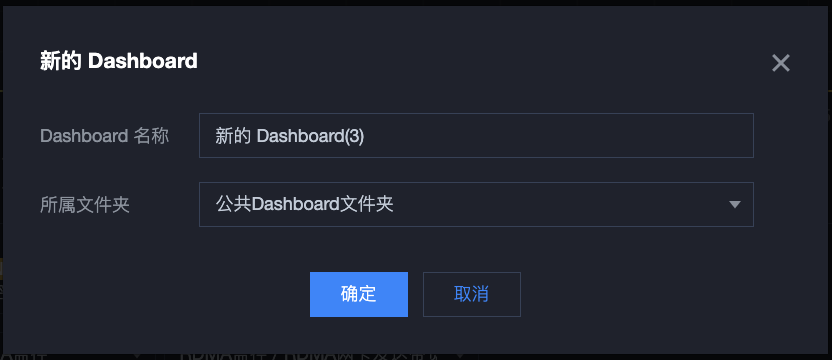
4. 单击确定即可快速创建 Dashboard。
本地监控查看
RDMA 毫秒级监控可查看最小 10ms 粒度级别的带宽数据监控,但云产品监控只支持最小粒度为10s的数据上报。如果用户想获取更精确的网卡监控数据,可以使用如下命令,保存毫秒级的数据在本地查看。
# monitor_client 随增强型监控已自动安装,/tmp/monitor.log 为自定义的数据保存路径,文件大小会持续增长,注意管理存储空间monitor_client -r -p raw > /tmp/monitor.log# -r 持续取最近10s的数据# -p 打印选择# -p summary,默认值,打印统计信息# -p raw,打印原始数据点# -p all,打印统计信息和原始数据点# 您可以使用 monitor_client -h 查看更多参数说明
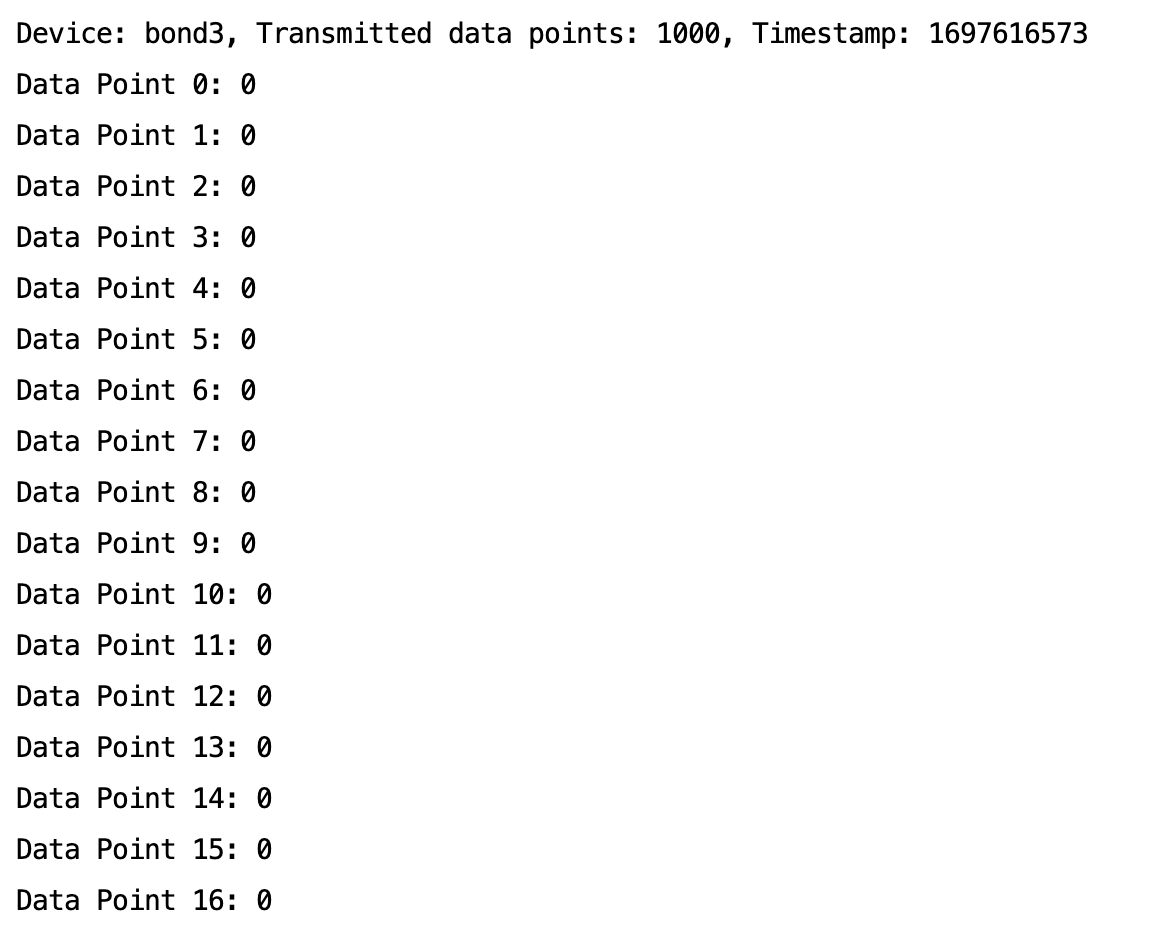
查看记录的监控数据,您可以根据需要分析监控记录,监控记录的格式如下:
说明:
图中部分参数含义解释如下:
Device:RDMA 网卡的名称。
Received data points:接收侧10s内采集到的数据点数,这里是10s内采集了1000个点,也就是每10ms采集一次数据点,每个点的数据为对应10ms的接收带宽。
Timestamp:采集时的时间戳。
Data Point n:自时间戳n*10ms后采集到的接收带宽。每个点的采样时间与前后的点均间隔10ms。
文档反馈