Product Overview
User Behavior Analytics (UEBA)
The User Behavior Analytics (UEBA) feature provides visualized auditing and monitoring of cloud user operation behaviors and TencentCloud API calls. It can detect and alarm on risky behaviors such as exceptional invocation of AKSK, high-risk API invocation, high-risk user operations, unauthorized service usage, and privilege escalation. This identifies security risks caused by exceptional user behaviors and risk API calls.
Features
Audit log connection: Through the multi-cloud multi-account feature module, you can obtain user lists corresponding to cloud accounts and external user information. By using CloudAudit logs, you can retrieve all cloud user behavior records, and identify user behavior fields. Additionally, it enables visual monitoring and real-time auditing of cloud user operations and TencentCloud API call logs.
Risk detection: Detects and alarms on risky behaviors such as AKSK exceptional invocation, high-risk API invocation, high-risk user operations, unauthorized service usage, and privilege escalation. It also supports user-defined enabling or disabling of detection rules, and custom addition of detection policies.
Security visualization: Displays risk data detected in the past 7 days from aspects such as exceptional behaviors and exceptional accounts. Customers can quickly understand risk trends through data comparison and carry out timely risk management.
User Overview
1. Log in to the CSC console. In the left sidebar, click User Behavior Analytics (UEBA) .
2. On the UEBA page, it supports behavior analytics for all of your users, including your root account, sub-accounts, and collaborators.
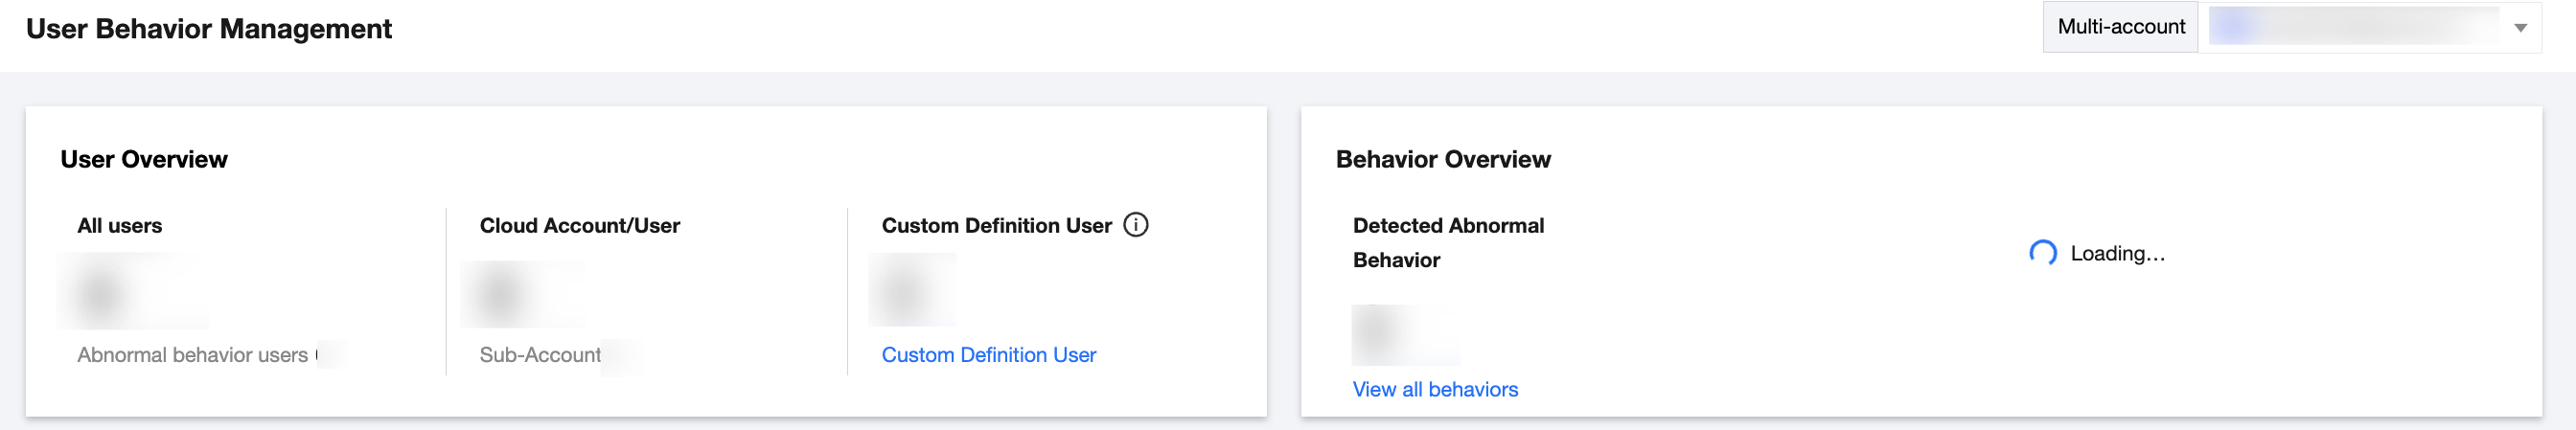
3. Click Custom Definition User, you can identify user information in third-party logs by selecting a log type.
Note:
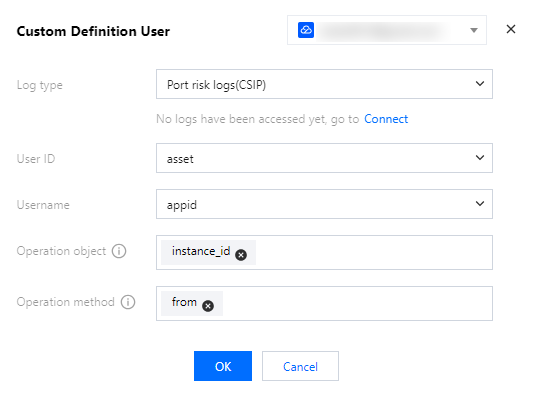
4. In the custom definition user dialog box, configure parameters such as log type and user ID.
Parameter Name | Description |
Log Type | After completing the log configuration access, users can select the custom users for whom they want to add policies in this section, to audit the required log types. Log types include CFW access control logs, operation logs, traffic logs, intrusion prevention logs, zero trust protection logs, WAF attack logs, access logs, CWPP client-side reporting logs, CSC content risk logs, risk service exposure logs, weak password risk logs, configuration risk logs, vulnerability risk logs, SaaS BH asset log-in logs, product log-in logs, or other custom logs. |
User ID | Select the field representing the user ID. |
Username | Optional. Select the field representing the username. |
Operation object | In the current log fields, select up to three fields to reflect the objects of user actions. It is recommended to select information such as service, product, resource, instance, and API. Fields can be left blank. |
Operation Method | In the current log fields, select up to three fields to reflect the method of user actions. It is recommended to select information such as key and AKSK. Fields can be left blank.
After configuration, user data in the custom user section will be refreshed based on the configuration information. |
5. Click OK. After configuration, user data in the custom user section will be refreshed based on the configuration information.
Behavior Overview
1. Log in to the CSC console. In the left sidebar, click **User Behavior Analytics (UEBA)**.
2. In the behavior overview module, before using the feature, you need to connect the logs. Click Access Now.

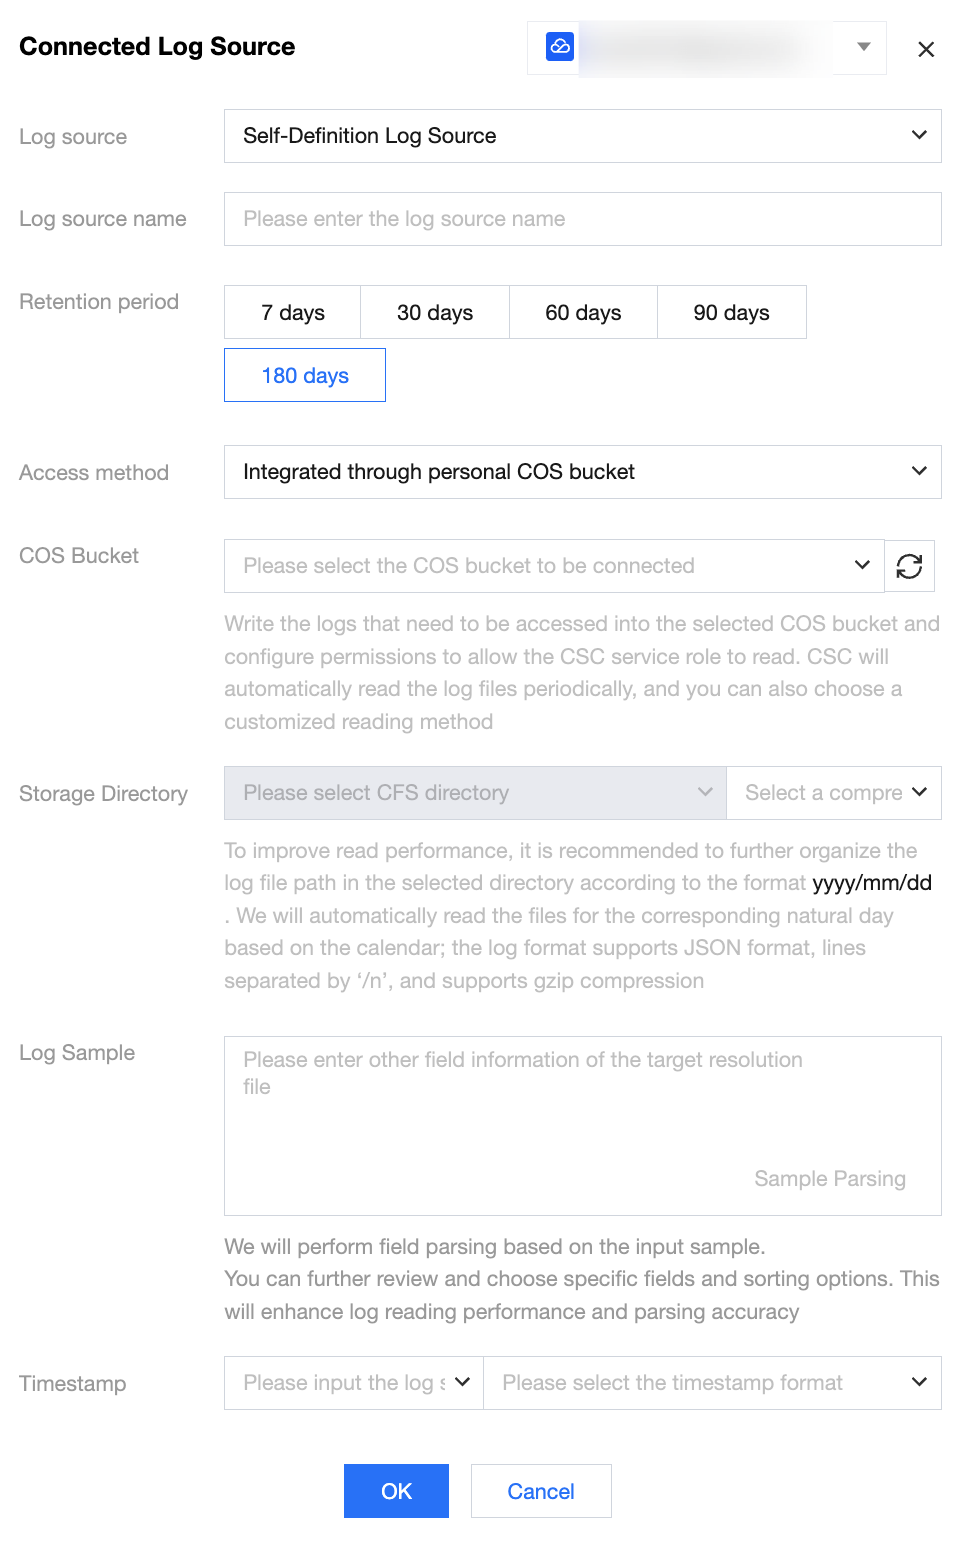
3. In the connected log source dialog box, you can select log source from operations or custom log source.
Note:
If these two types of logs are already connected in log analysis, you can skip this configuration in the UEBA feature module and directly add policies.
Log Source | Parameter Name | Description |
CloudAudit | Retention Period | The default is 180 days. You can select 7 days, 30 days, 60 days, 90 days, or 180 days. |
| Connection Method | The default method is connected through tracking set. |
| Tracking Set | Displays only the available tracking sets that are stored in COS. If disabled, go to the COS product first to enable it. |
Custom Log Source | Log Source Name | User-defined log source name required. |
| Retention Period | You can select 7 days, 30 days, 60 days, 90 days, or 180 days. |
| Connection Method | The default method is connected through your own COS bucket. |
| COS Bucket | Write the required logs into the selected COS bucket and configure privileges to allow the CSC service role to read them. CSC will automatically read log files at scheduled times. You can also submit a ticket to customize the reading method, or visit the COS product page to create a bucket. |
| Storage Directory | To enhance reading performance, it is recommended to organize log file paths under the selected directory in the format yyyy/mm/dd. We will automatically read files corresponding to the natural calendar date. The log format supports JSON with lines separated by '\\n' and supports gzip compression. |
| Log Sample | It is recommended to input log samples for the system's reference. The system will parse fields based on the input samples. You can further review and select specific fields and sorting operations, which will enhance the reading performance and accuracy of log parsing. |
| Timestamp | Select log samples and their corresponding timestamp formats. |
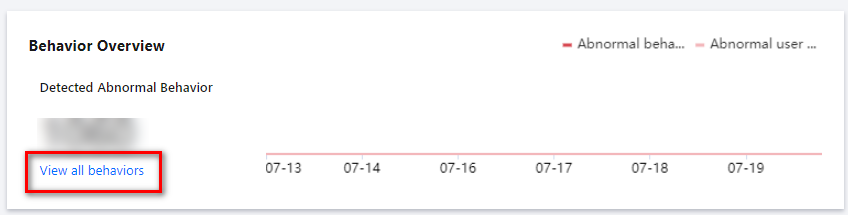
4. Click OK, and the system will complete log connection. Subsequently, system policies and user-defined policies will audit exceptional behaviors and accounts based on the real-time connected logs. If an exceptional behavior is detected, the exceptional behavior data and trend chart below will be updated. Click View all behaviors to navigate to log analysis to view log details.
Viewing Policy
1. Log in to the CSC console. In the left sidebar, click User Behavior Analytics (UEBA) .
2. In the user behavior analytics (UEBA) list, system policies are provided to detect exceptional behaviors and exceptional accounts. It can detect and alarm risky behaviors including AKSK exceptional invocations, high-risk API invocations, high-risk user operations, unauthorized service usage, and privilege escalation.
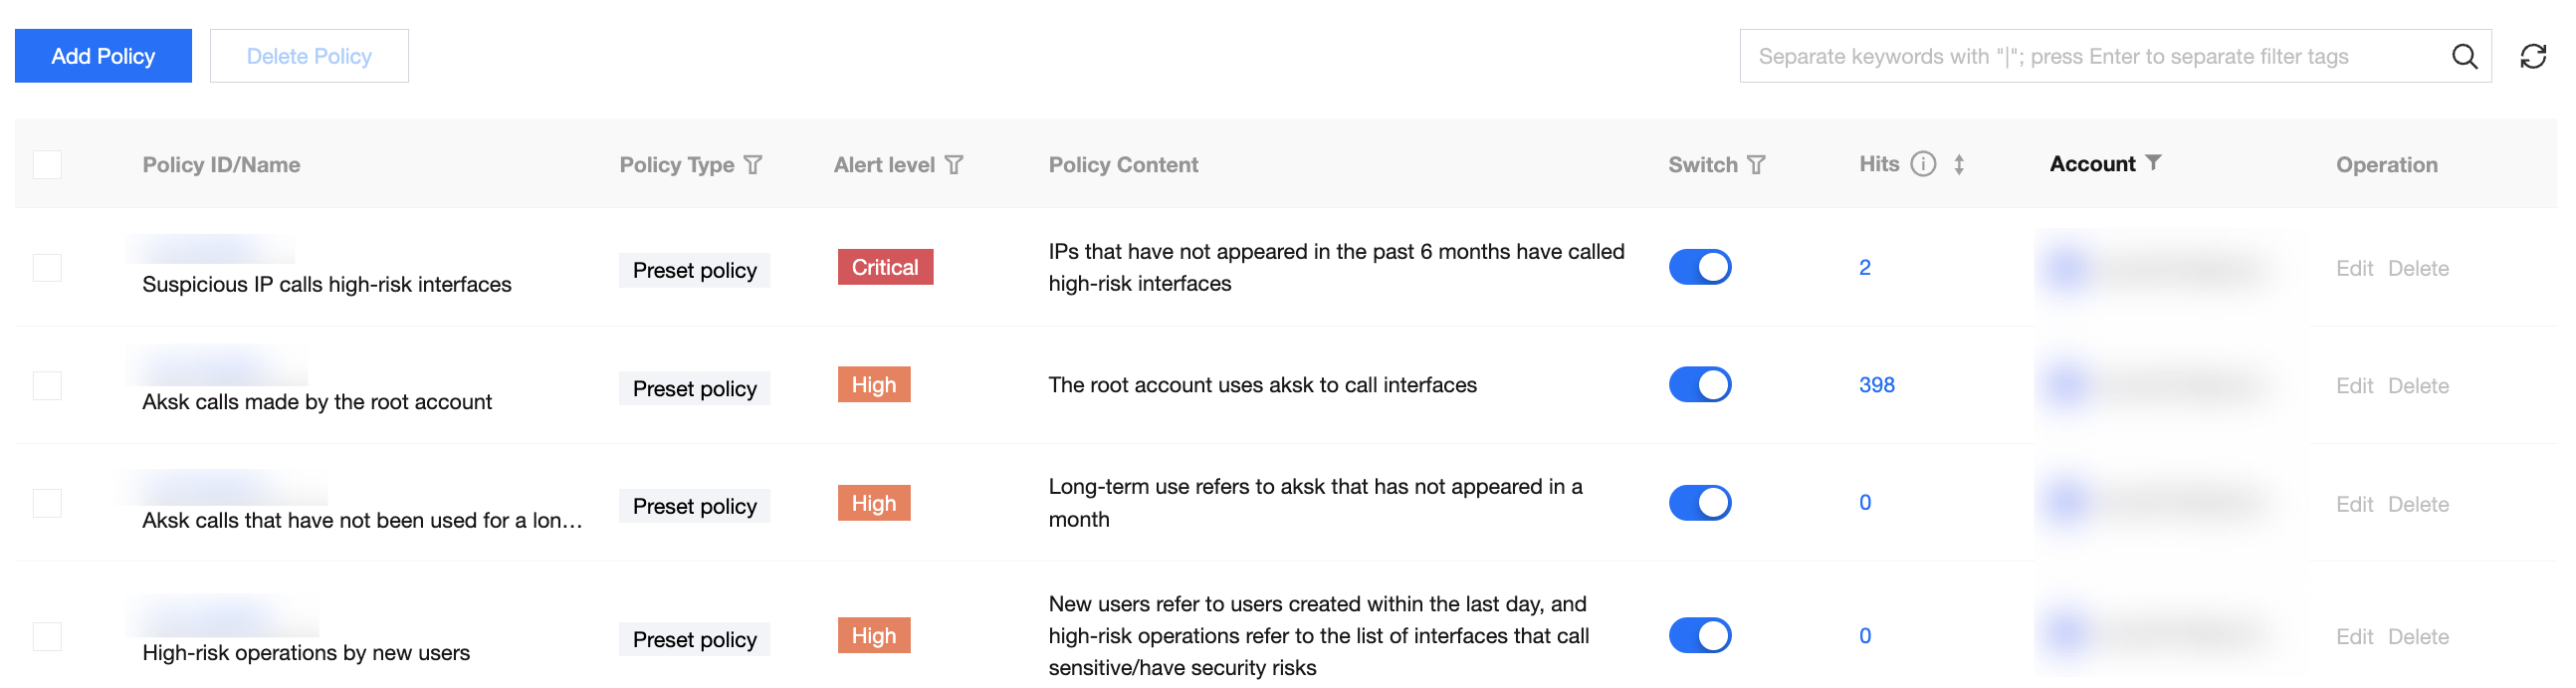
Parameter Name | Description |
Policy ID | System generated by default. |
Policy Name | System policies are defined by the product backend. User-defined policies are defined by the user. |
Policy Type | Includes system policies and user-defined policies. |
Alarm Level | Includes critical, high, medium, low, and note. |
Policy Content | Explain the detection content of the policy. |
Enabling/Disabling | Users can enable or disable this policy. |
Hits | Statistics for the last 7 days' policy hit records. Click to go to the alarm center to view alarm details. Alarm sources are the UEBA. |
Operation | System policies are not allowed to be edited or deleted. User-defined policies can be edited or deleted. |
Adding Policy
1. Log in to the CSC console. In the left sidebar, click User Behavior Analytics (UEBA) .
2. On the UEBA page, click Add Policy to customize user behavior analytics policy.
3. On the custom policy page, configure the relevant parameters and click Confirm.
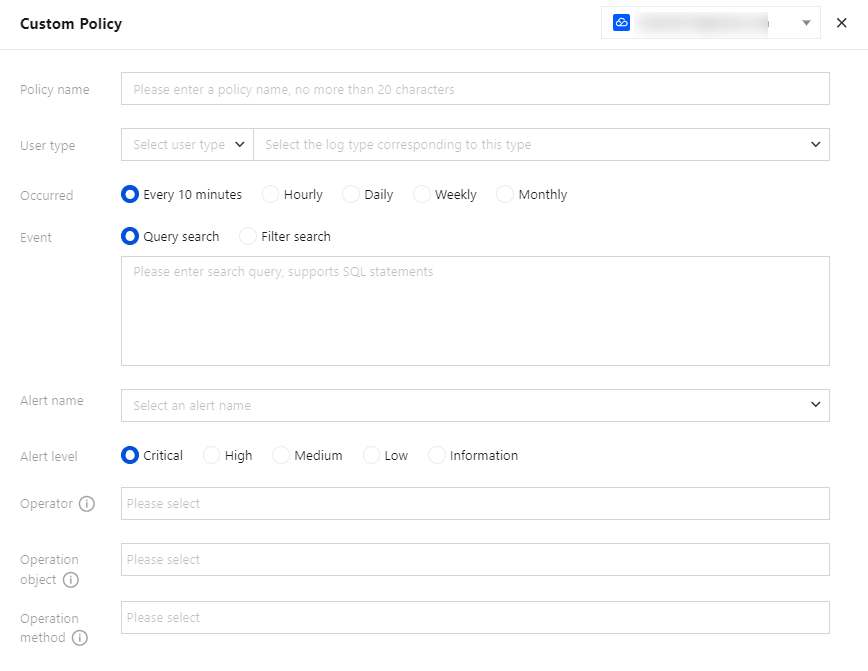
Parameter Name | Description |
Policy Name | User-defined policy name, no more than 20 characters. |
User Type | Cloud account or custom user. When users select cloud account, the log types available include CloudAudit read operation log and CloudAudit write operation log. When users select custom user, the log types available are those configured in the custom user. |
Occurrence | Options include every 10 minutes, hourly, daily, weekly, and monthly. |
Event | It can be configured by query or filter search. |
Alarm Name | Optional. User exceptional behavior. |
Alarm Level | It includes critical, high, medium, low, and note. |
Operator | In the current log fields, select up to three fields to reflect the operator's information. It is recommended to select fields related to IP, account, and users. Fields cannot be left blank. |
Operation Object | In the current log fields, select up to three fields to reflect the objects of user actions. It is recommended to select information such as service, product, resource, instance, and API. Fields can be left blank. |
Operation Method | In the current log fields, select up to three fields to reflect the methods of user actions. It is recommended to select information such as key and AKSK. Fields can be left blank. |
피드백