CTSDB is a distributed and scalable time series database that supports near-real time data search and analysis. It is compatible with components in the ELK ecosystem, so you can conveniently connect your ELK components to CTSDB.
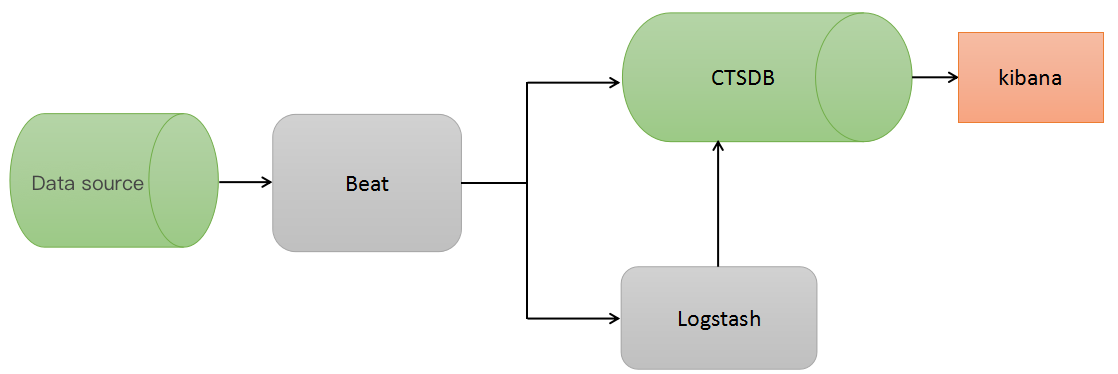
ELK ecosystem components provide a wide variety of data processing capabilities such as data collection, data cleansing, and visualized graph display. Common ELK components include Filebeat, Logstash, and Kibana. In addition, CTSDB also allows you to use Grafana as the visualized platform. A common architecture is as shown below:
Component Usage
Filebeat
Filebeat is a lightweight open-source log file data collector and is installed on servers as an agent. It reads file content, sends the content to Logstash for parsing, and then transfers the parsed content to CTSDB, or directly sends the file content to CTSDB for centralized storage and analysis.
2. Configure
Filebeat configurations are in a YAML file, including the global, input, and output configurations. The following section provides a usage example.
3. Start
When starting Filebeat, you can specify the path of the configuration file; otherwise, filebeat.yml will be used by default.
Filebeat usage example
1. First, decompress the Filebeat installation package into a directory as shown below:
2. Then, configure filebeat.yml. The following sample is for reference:
filebeat.shutdown_timeout: 5# How long filebeat waits on shutdown for the publisher to finish.
max_procs: 4# Maximum number of CPUs that can run concurrently, which is the number of available logical CPUs of the OS by default
filebeat.spool_size: 102400
filebeat.idle_timeout: 2s
processors:
drop_fields: # Fields to be dropped
fields: ["beat","input_type","source","offset"]
filebeat.prospectors:
paths: ["/data/log/filebeat-tutorial.log"]# Path of the sample data
fields:
metricname: metric1
harvester_buffer_size: 1638400
close_timeout: 0.5h
scan_frequency: 2s
paths: ["/mylog/*.log","/mylog1/*.log"]
fields:
metricname: table2
harvester_buffer_size: 1638401
close_timeout: 0.5h
scan_frequency: 2s
output.elasticsearch:
hosts: ["127.0.0.1:9200"]
index: "%{[fields.indexname]}"# Wildcard, which can be used to write different indexes for different types of data
username: "root"# For CTSDB instances that require authentication, you need to enter the username and password
password: "changeme"
worker: 2# Number of worker threads
loadbalance: true# Whether to enable load balancing
bulk_max_size: 512# Maximum number of documents in one `bulk` request
flush_interval: 2s
template:
enabled: false# Note: after start, Filebeat will put a default template. When connecting to CTSDB, you need to disable the Filebeat template
Some sample data is as shown below:
83.149.9.216 - - [04/Jan/2015:05:13:42 +0000]"GET /presentations/logstash-monitorama-2013/images/kibana-search.png HTTP/1.1"200203023"http://semicomplete.com/presentations/logstash-monitorama-2013/""Mozilla/5.0 (Macintosh; Intel Mac OS X 10_9_1) AppleWebKit/537.36 (KHTML, like Gecko) Chrome/32.0.1700.77 Safari/537.36"
83.149.9.216 - - [04/Jan/2015:05:13:42 +0000]"GET /presentations/logstash-monitorama-2013/images/kibana-dashboard3.png HTTP/1.1"200171717"http://semicomplete.com/presentations/logstash-monitorama-2013/""Mozilla/5.0 (Macintosh; Intel Mac OS X 10_9_1) AppleWebKit/537.36 (KHTML, like Gecko) Chrome/32.0.1700.77 Safari/537.36"
83.149.9.216 - - [04/Jan/2015:05:13:44 +0000]"GET /presentations/logstash-monitorama-2013/plugin/highlight/highlight.js HTTP/1.1"20026185"http://semicomplete.com/presentations/logstash-monitorama-2013/""Mozilla/5.0 (Macintosh; Intel Mac OS X 10_9_1) AppleWebKit/537.36 (KHTML, like Gecko) Chrome/32.0.1700.77 Safari/537.36"
3. Start Filebeat and observe the data in the corresponding CTSDB metric:
nohup ./filebeat &
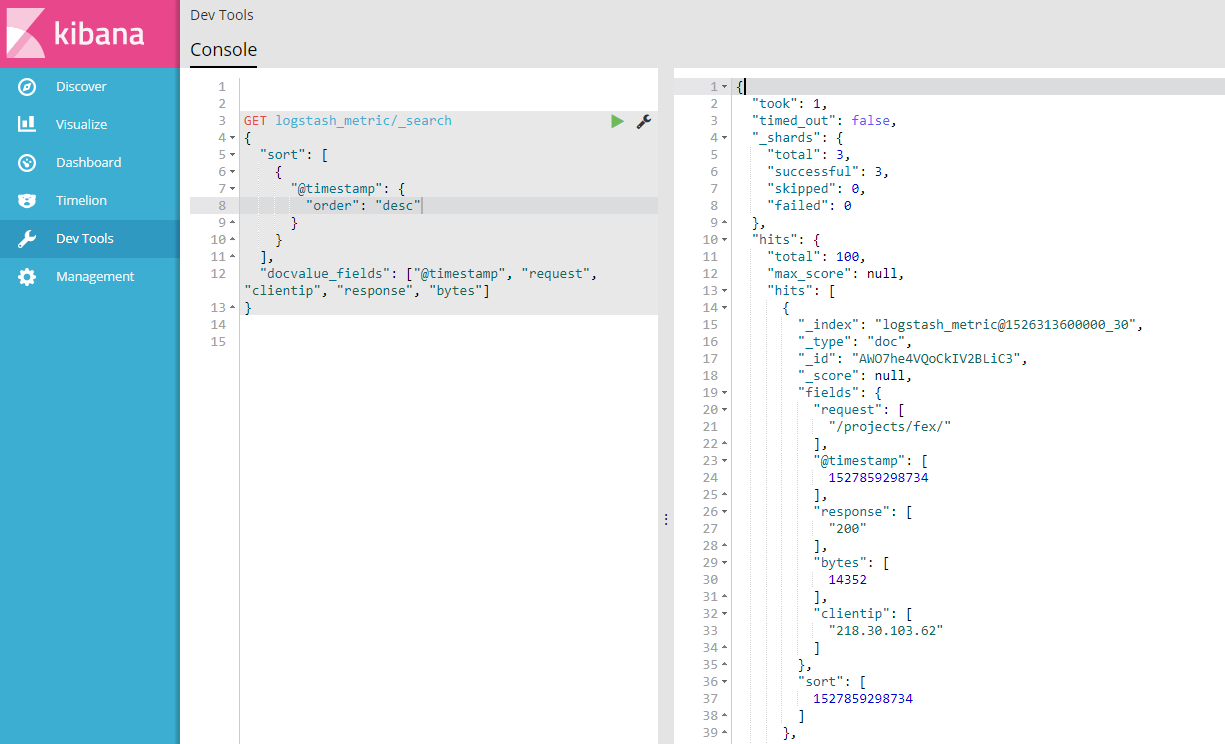
less logs/filebeat # View certain logs. Through the log `libbeat.es.published_and_acked_events=100`, you can see that all 100 logs have been successfully written into Elasticsearch
2018-05-25T14:32:24+08:00 INFO Non-zero metrics in the last 30s: filebeat.harvester.open_files=1 filebeat.harvester.running=1 filebeat.harvester.started=1 libbeat.es.call_count.PublishEvents=1 libbeat.es.publish.read_bytes=1535 libbeat.es.publish.write_bytes=40172 libbeat.es.published_and_acked_events=100 libbeat.publisher.published_events=100 publish.events=101 registrar.states.current=1 registrar.states.update=101 registrar.writes=2
# Check whether there is data written into `metric1` through Kibana or curl
# As the content is too much, it is omitted here. In `hits.total`, you can see that the query hit 100 documents, indicating that all the 100 logs have been successfully written into CTSDB
The above sample directly uses Filebeat to write the original log data into CTSDB without parsing the fields. The following section describes how to use Logstash to parse data and then write parsed data into CTSDB.
Logstash
Logstash is an open-source data collection engine that can parse data in real time. It can collect data from various sources, filter, analyze, and format the data, and then store the data into CTSDB.
Logstash directions
1. Install
For more information on how to install Logstash, please see Installing Logstash.
2. Configure
Logstash configurations mainly include three modules: data source input, data parsing rule, and data output. The following section provides a usage example.
3. Start
When starting Logstash, you can specify the configuration file; otherwise, logstash.yml will be used as the configuration by default, and configuration in pipelines.yml will be used as the parsing rule by default.
Logstash usage example
1. First, decompress the Logstash installation package into a directory as shown below:
2. Then, create a configuration file. You can also configure in logstash.yml and pipelines.yml. In this example, create a configuration file named first-pipeline.conf and configure it as follows:
# Input source
input {
beats {
port =>"5044"
}
}
# Parse and filter
filter {
grok {
match =>{
"message"=>"%{COMBINEDAPACHELOG}"
}
}
}
# Output
output {
elasticsearch {
action =>"index"
hosts =>["localhost:9200"]
index =>"logstash_metric"# Name of the metric created in CTSDB
document_type =>"doc"
user =>"root"# For CTSDB instances that require authentication, you need to specify the username and password
password =>"changeme"
}
}
The Grok filter plugin is available in Logstash by default and can parse unstructured data into structured data. For more information on how to use it, please see Grok filter plugin.
3. Start Logstash and Filebeat and observe the data in the corresponding CTSDB metric:
# Here, you should note that the Filebeat output is Logstash; therefore, you need to modify the Filebeat output configuration item as follows:
output.logstash:
hosts: ["localhost:5044"]
# Clear the `data` directory of Filebeat and start Filebeat
# Here, you can see that the result is empty, indicating that there is no data written into CTSDB. View Logstash logs:
[2018-05-25T21:00:07,081][ERROR][logstash.outputs.elasticsearch] Encountered a retryable error. Will Retry with exponential backoff {:code=>403, :url=>"http://127.0.0.1:9200/_bulk"}
[2018-05-25T21:00:07,081][ERROR][logstash.outputs.elasticsearch] Encountered a retryable error. Will Retry with exponential backoff {:code=>403, :url=>"http://127.0.0.1:9200/_bulk"}
# `bulk` processing was exceptional, and permission error 403 was returned. However, a careful check of the username and password found no problem. Continue to check the Elasticsearch logs:
[2018-05-25T20:59:27,545][WARN ][o.e.p.o.OPackActionFilter][1505480279000001609] process index failed: Invalid format: "2018-05-25T12:51:18.905Z"
[2018-05-25T20:59:27,547][WARN ][o.e.p.o.OPackActionFilter][1505480279000001609] process index failed: Invalid format: "2018-05-25T12:51:18.905Z"
# The Elasticsearch logs show that an error occurred whiling parsing the time format, and the cause is that the time field format was not specified during metric creation. The default time format in CTSDB is `epoch_millis`, therefore, you need to change the time format:
POST /_metric/logstash_metric/update?pretty
{
"time":{
"name":"@timestamp",
"format":"strict_date_optional_time"
}
}
# Restart Logstash and Filebeat, write data again, and check CTSDB:
# As the content is too much, it is omitted here. In `hits.total`, you can see that the query hit 100 documents, indicating that all the 100 logs have been successfully written into CTSDB
As can be seen from the above sample, logs are collected by Filebeat into Logstash, parsed by Logstash into multiple fields, and then written into CTSDB.
Kibana
Kibana is an open-source analysis and visualization platform designed for Elasticsearch. You can use it to search, view, and interact with the data stored in CTSDB metrics. Its diverse features such as graphs, forms, and curves help you visualize and analyze data easily.
Kibana directions
1. Install
Download a Kibana version matching Elasticseach and decompress it into a directory.
2. Configure
Kibana configuration is simple, and a sample will be provided in the following section. For descriptions of the configuration items, please see Configure Kibana.
3. Run
When Kibana runs, config/kibana.yml is used as the configuration by default.
Kibana usage example
1. First, decompress the Kibana installation package into a directory as shown below:
2. Then, modify the configuration file under config as follows:
# config/kibana.yml
# Port on which the Kibana server listens
server.port: 5601
# IP of the server to which the Kibana server is bound
server.host: 127.0.0.1
# URL of the CTSDB instance to be connected to
elasticsearch.url: "http://127.0.0.1:9200"
# For CTSDB instances that require authentication, you need to enter the username and password
elasticsearch.username: "root"
elasticsearch.password: "changeme"
Start Kibana and access it in a browser
nohup bin/kibana &
Access the Kibana server through IP:port or the domain name as shown below:
You can use the development tool to conveniently access CTSDB as shown below:
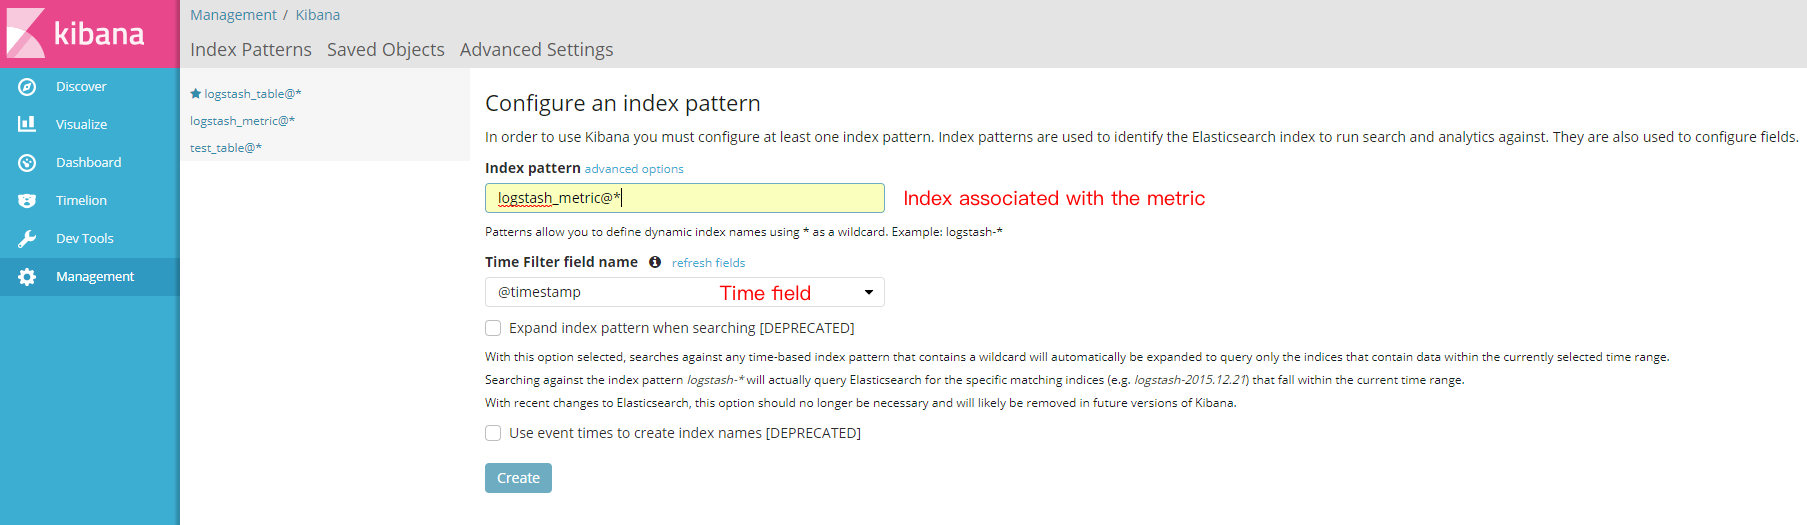
Create the index to be accessed on the management page as shown below:
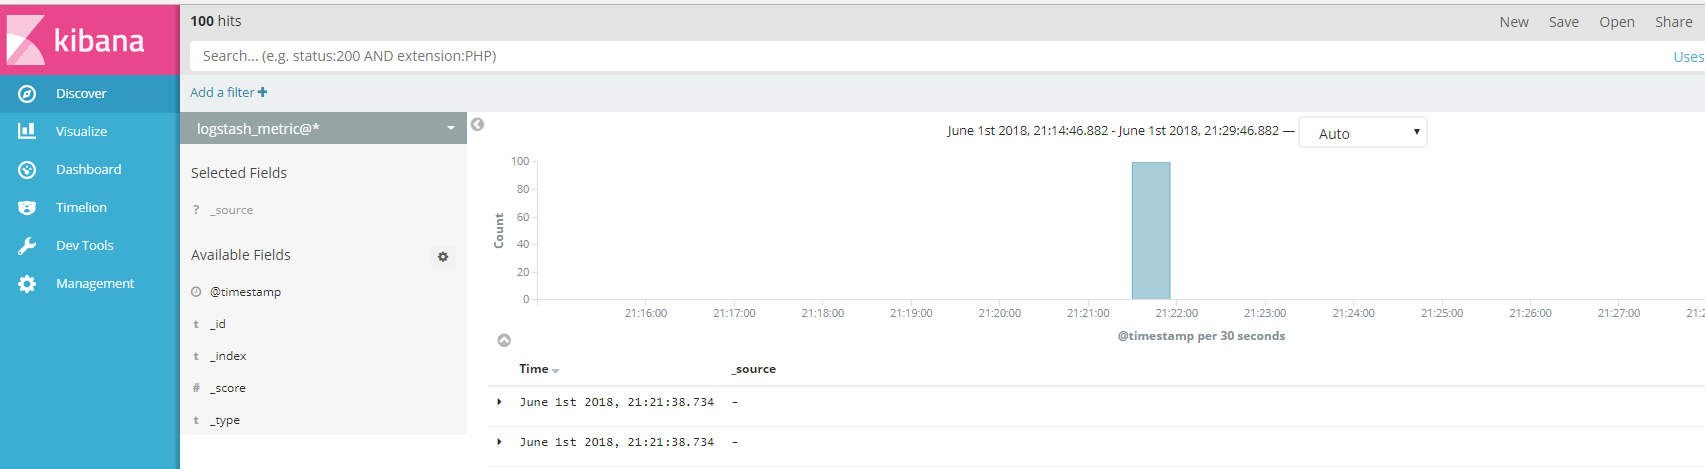
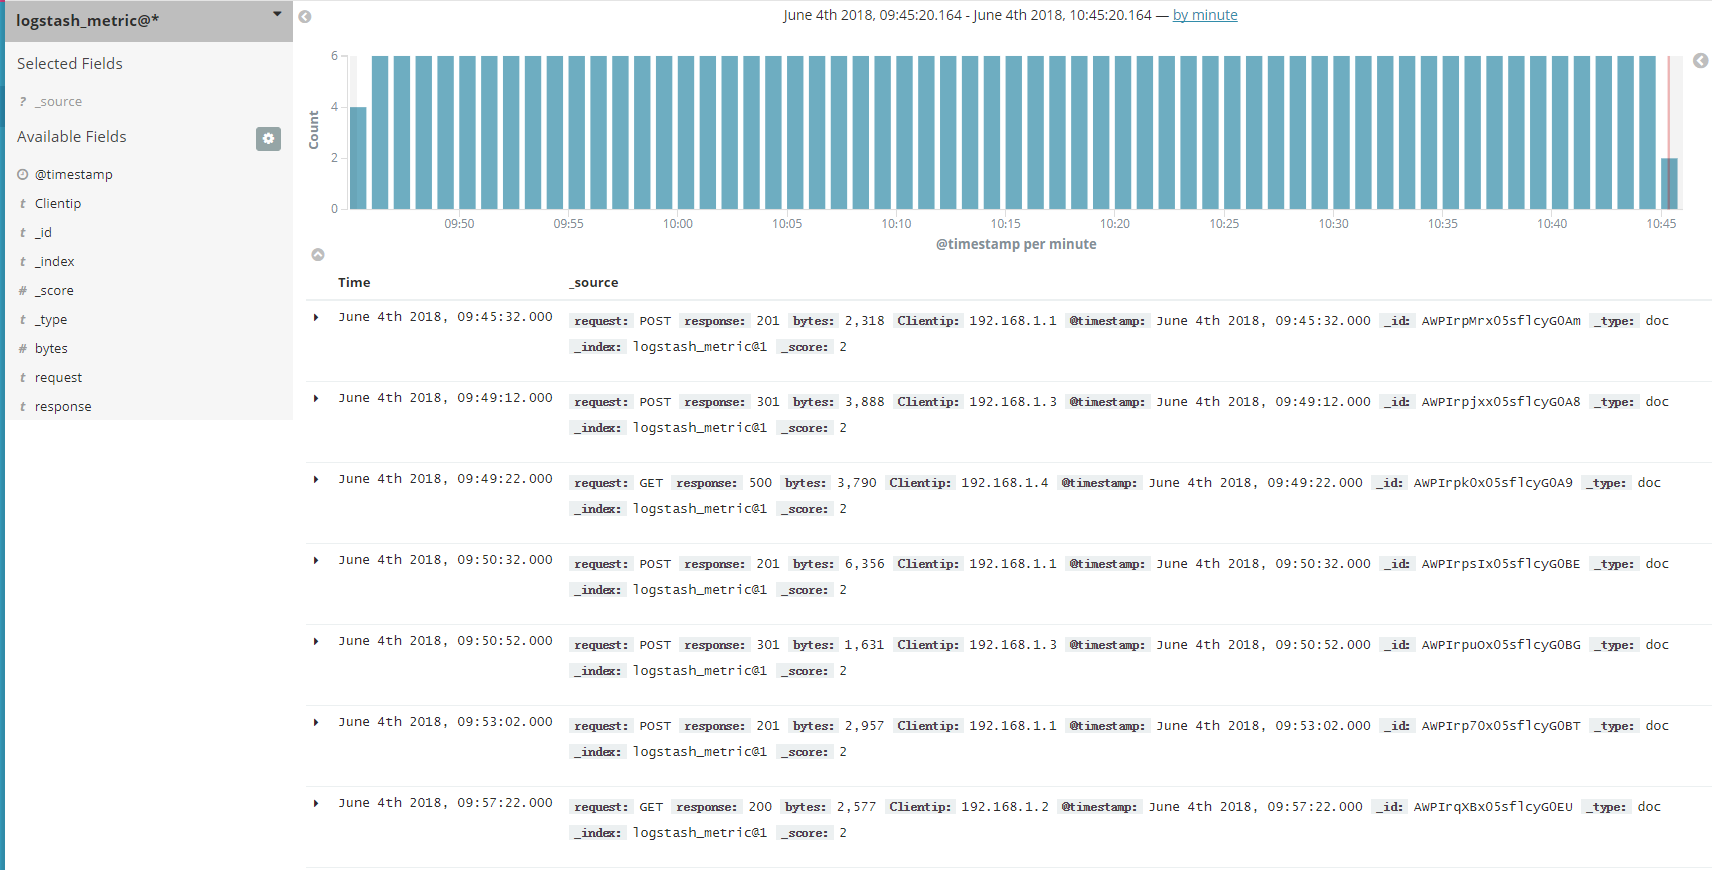
If you need to search for logs, you may use the search feature as shown below:
You can see that the search results show nothing but time. This is because the source feature is disabled by default in CTSDB to save storage space. If you need to search for logs, please contact us to enable the source feature. The effect after the feature is enabled is as shown below:
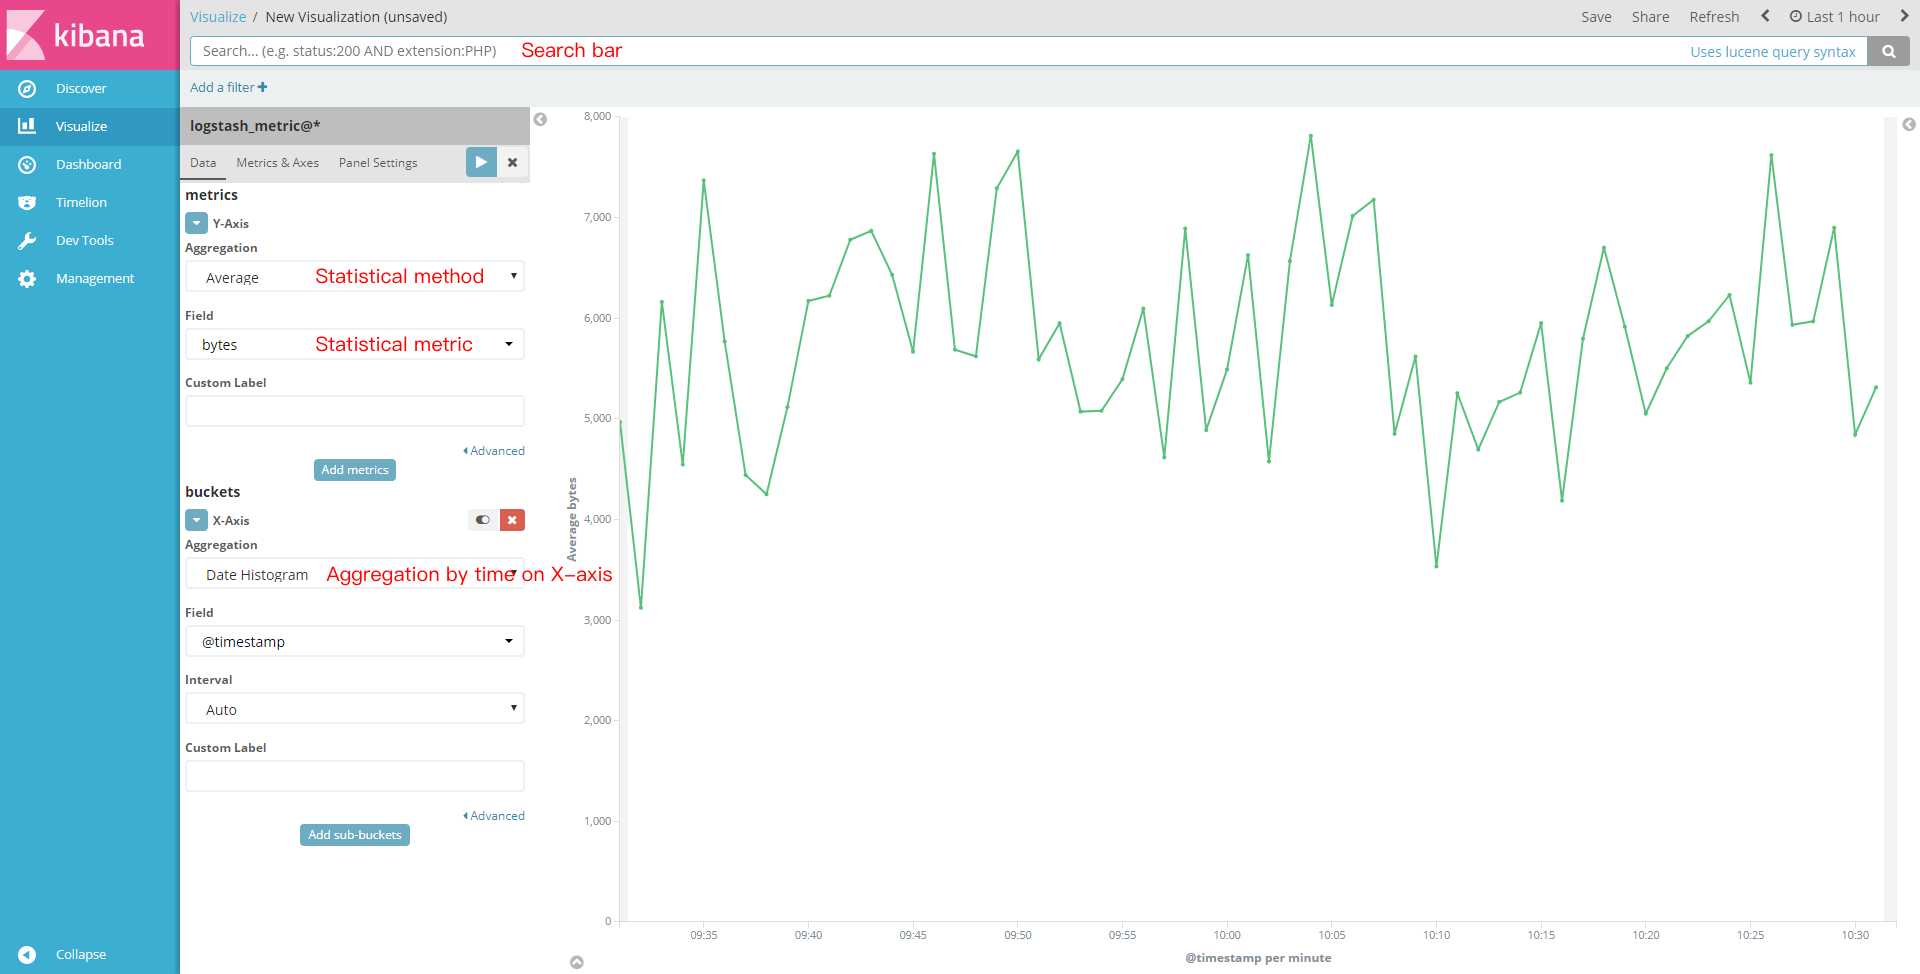
By using visualization, you can create various graphs. Here, a line chart is used as an example to show the Kibana graph effect:
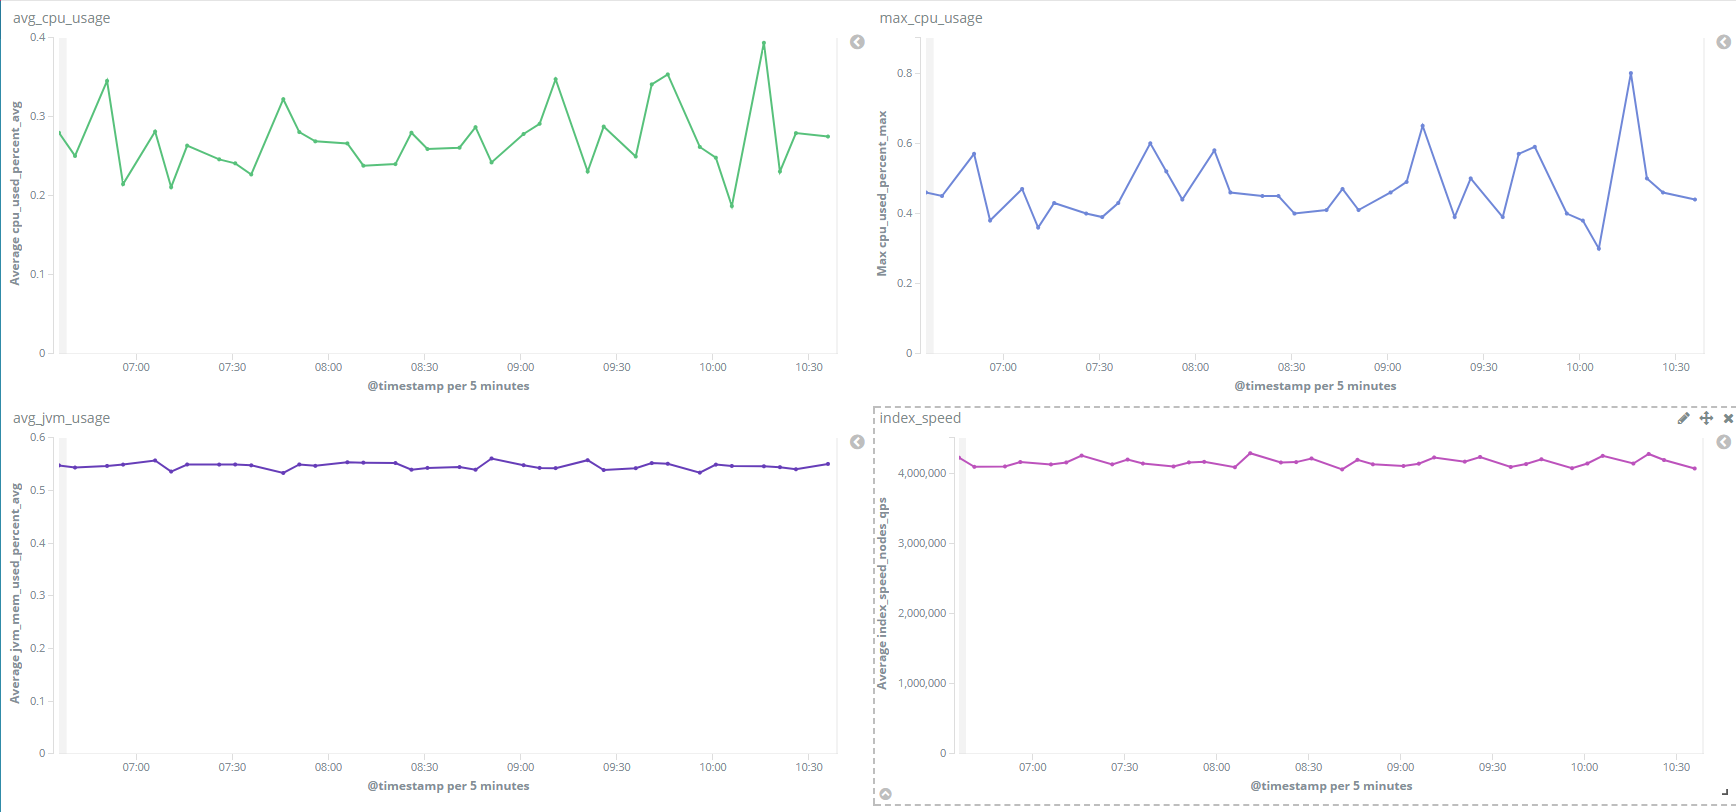
Kibana not only provides a rich set of visual graph features but also uses dashboards to display the saved visual graphs on the same page in a unified manner, so that you can easily check the changes of multiple metrics. Below is a sample dashboard view of the monitoring data for demonstrating the display effect:
Grafana
Grafana is an open-source dashboard tool that provides various graph features just like Kibana. With its fine-grained display effects, you can effectively analyze data. Grafana supports more data sources than Kibana, including InfluxDB, OpenTSDB, and Elasticsearch. The following example shows how to use it to analyze CTSDB data in a visualized way.
Grafana
1. Install
For more information on how to install Grafana, please see Install Grafana.
2. Configure
Grafana has many configuration items. You can use the default configuration. For more information, please see Configuration.
3. Run
When Grafana runs, it uses /etc/grafana/grafana.ini as its configuration by default.
Grafana usage example
1. First, start the Grafana service.
sudoservice grafana-server start
2. Then, access the Grafana service in a browser:
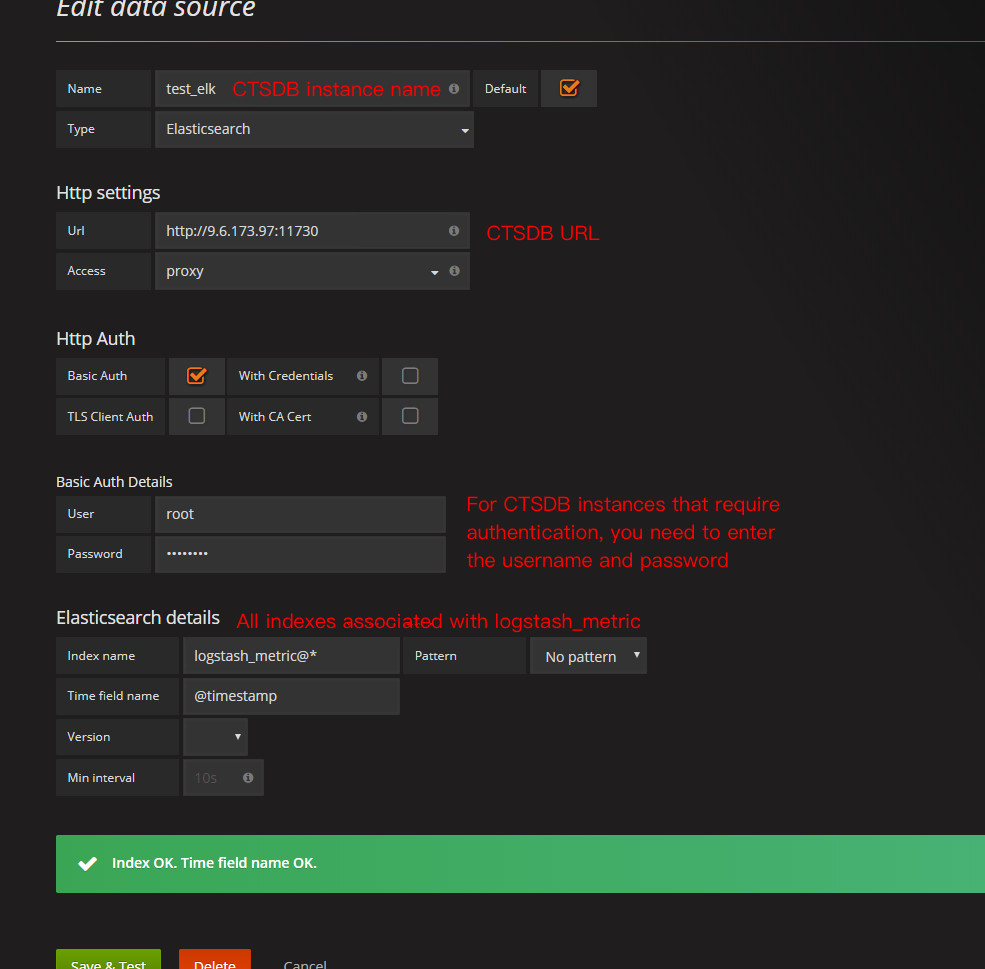
3. Create a data source and dashboard as shown below:
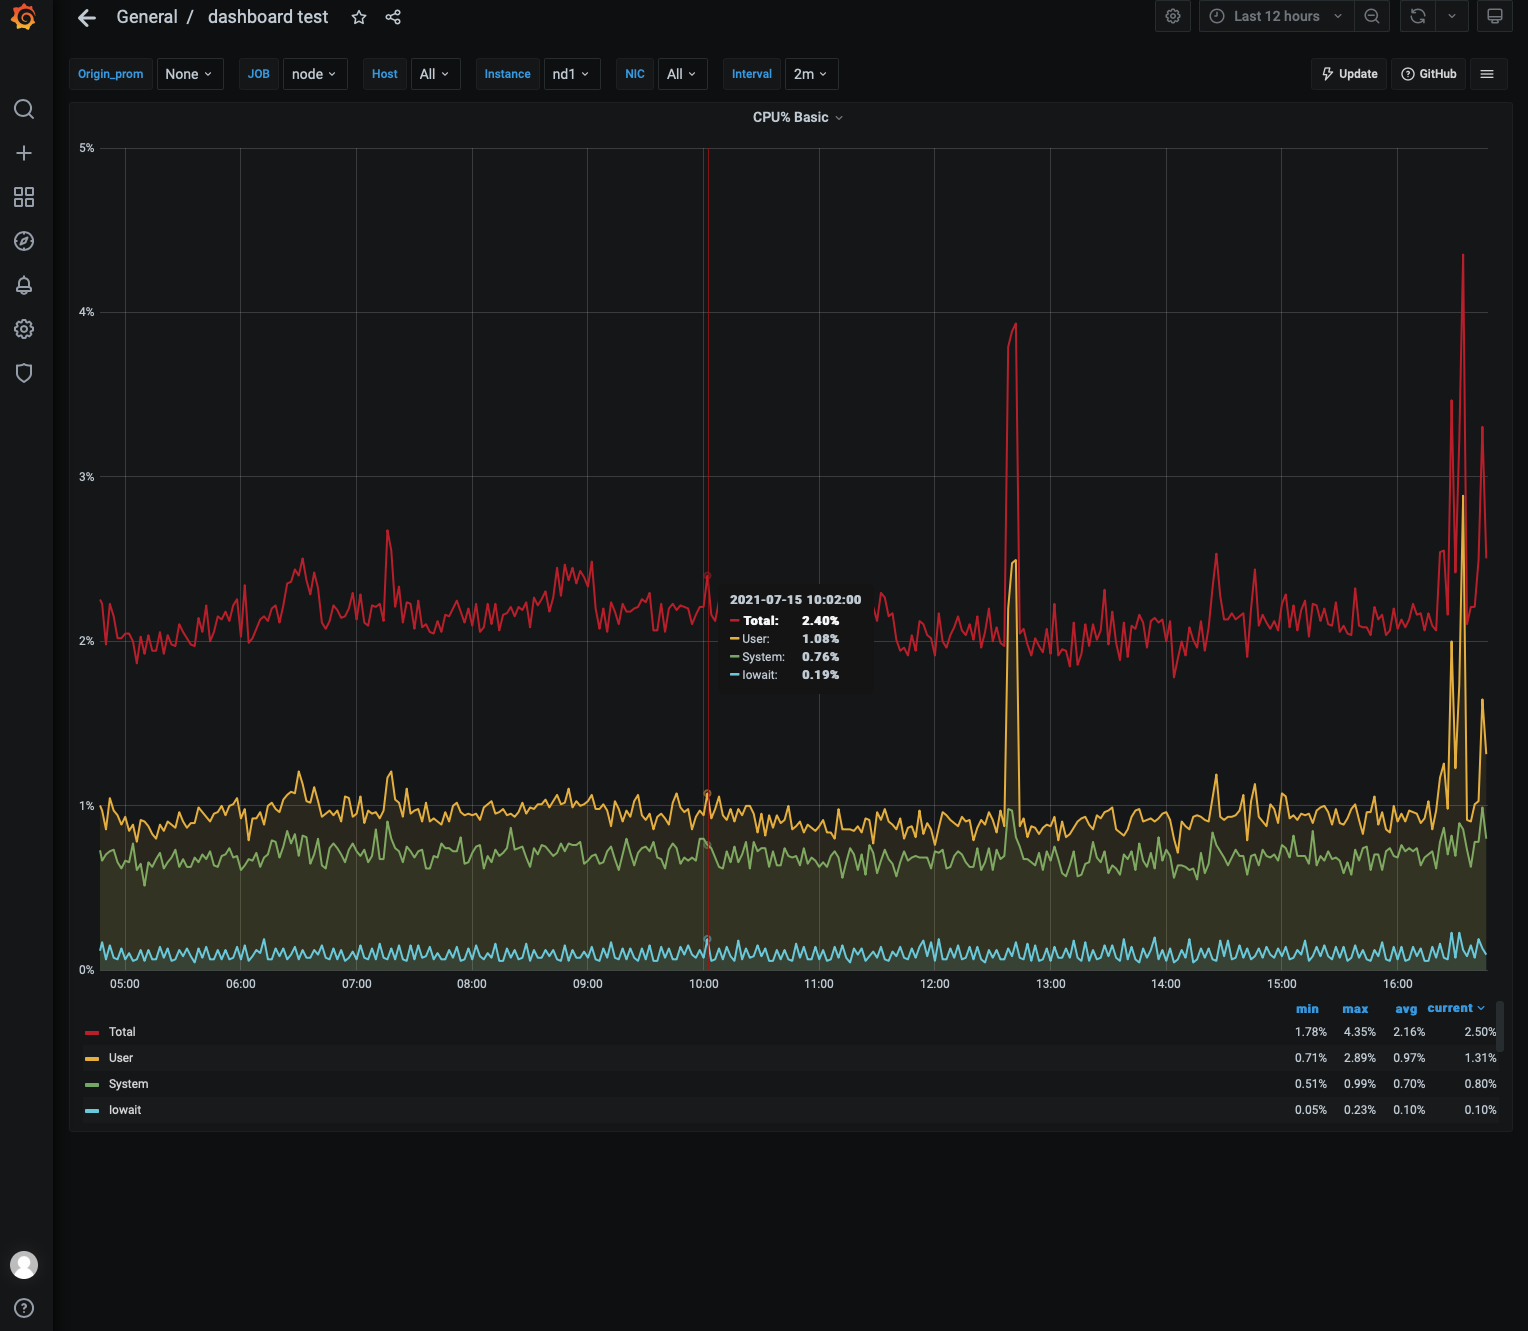
4. Use the dashboard to create a visual graph as shown below:
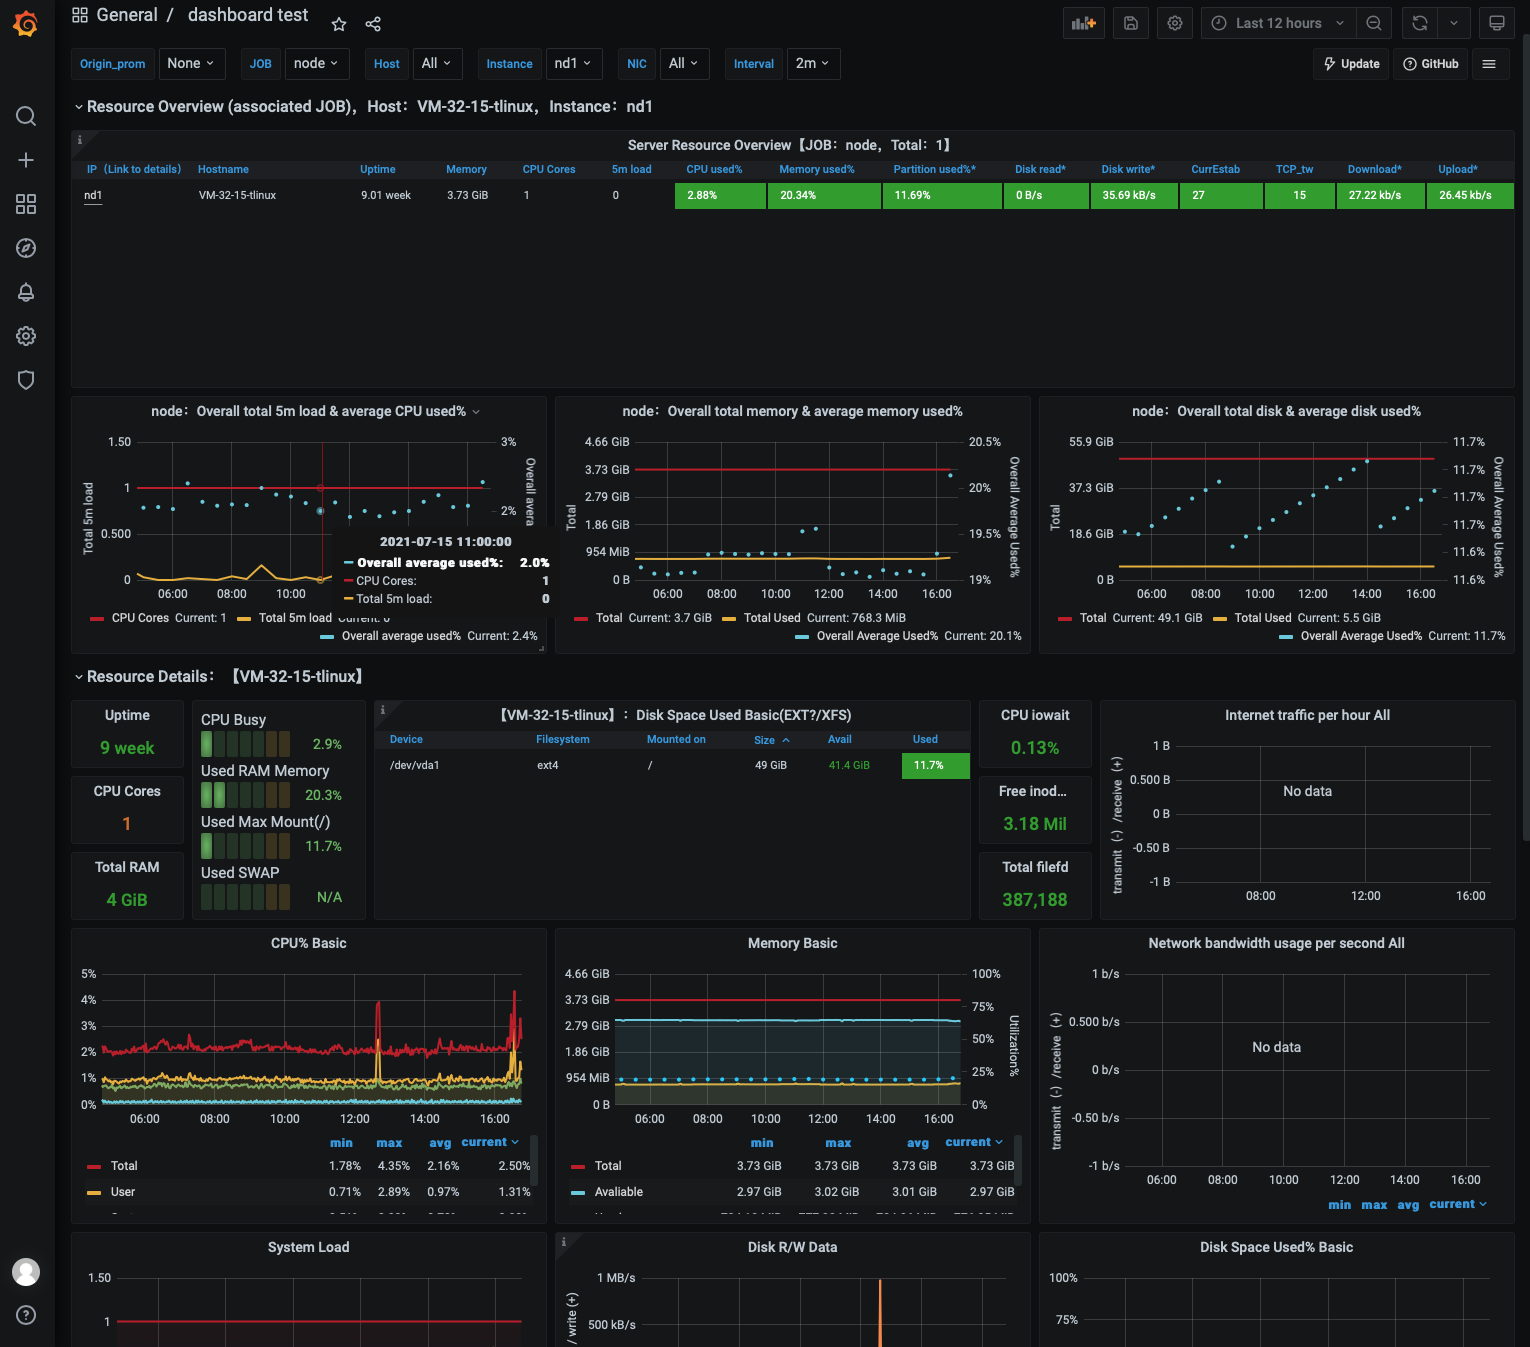
5. As shown above, the graph display effect of Grafana is slightly different from that of Kibana, but their features are essentially the same, so you can choose either one of them based on your use habits and preferences. Similarly, Grafana dashboard can also display multiple visual graphs as shown below:
Summary
This document describes how to connect ELK ecosystem components and Grafana to CTSDB in detail. If you have any questions during use, please submit a ticket for assistance.