In today's cloud computing and microservice architecture, Kubernetes has become the actual standard for container orchestration and management. It not only provides efficient container management capabilities but also supports advanced features like auto-scaling, service discovery, and load balancing, greatly simplifying the deployment and Ops of cloud-native applications. However, as the complexity of applications increases, ensuring high availability and stability of the system becomes crucial. Chaos Engineering, a practice method of testing system stability by actively introducing faults, is essential for enhancing the robustness of Kubernetes clusters.
This document introduces how to conduct fault simulation for CPU, memory, and disk resources in a Tencent Cloud Standard Cluster environment to help development and Ops teams better understand and prepare for potential system faults.
Experiment Execution
Step 1: Experiment Preparation
Prepare a TKE container instance and deploy a test Pod.
Enter the Agent Management page to install the agent for the TKE container. For specific installation steps, see Agent Management.
Note:
Since the fault injection process and fault behavior are consistent between Serverless clusters and standard clusters, you can refer to the standard cluster fault practices in this document.
3. Select Container as the resource type, select Standard Cluster Pod as the resource object, and then Add Instance.
4. To add an experiment action, click Add Now, and configure fault action parameters.
Configuring High CPU utilization Action
Note:
CPU Utilization: Specify CPU load percentage, which is 0 to 100.
Duration: Duration of a fault action, upon lapse of which, the agent will automatically recover the fault.
Scheduling Priority: It affects process priority in CPU scheduling. A lower nice value makes it more likely that the process would have a CPU time slice so that its execution priority can be improved. It is effective only if utilization is 100%.
Container Selection Mode: Select the fault range and inject faults into some or all containers under the Pod.
Configuring High memory utilization Action
Note:
Memory Utilization: Specify a memory load percentage that is 0 to 100.
Duration: Duration of a fault action, upon lapse of which, the agent will automatically recover the fault.
Enable OOM Protection: If it is enabled, the possibility of fault process OOM-KILL will be reduced, and business processes will be killed first.
Memory Occupation Rate: Memory usage increase per second.
Configuring High disk usage Action
Note:
Disk Directory: A disk directory to be populated, i.e., a directory where files are written.
File Size: Size of a file populated.
Disk utilization: Learn disk usage through staf commands, and calculate the file size required for specified utilization.
Reserved Space: Size of remaining space.
Duration: Duration of a fault action, upon lapse of which, the agent will automatically recover the fault.
If there are file size, disk utilization, and reserved space parameters, the priority calculation logic is disk utilization > reserved space > file size.
Configuring High disk IO load Action
Note:
Disk Directory: Specify a directory to enhance disk IO, which will apply to the disk it resides on.
Mode: Provide both read and write modes to execute high loads.
Block Size: Specify block size for every read or write.
Number of Blocks: Specify number of blocks to be copied.
Duration: Duration of a fault action, upon lapse of which, the agent will automatically recover the fault.
5. After action parameter configuration, click Next. Configure Guardrail Policy and Monitoring Metrics considering actual situations. After all configurations are completed, click submit to complete experiment creation.
Step 3: Execute the Experiment
1. Click Execute to start the experiment with the high CPU utilization action, and observe the monitoring metrics.
2. Execute the high memory utilization action and observe the monitoring metrics.
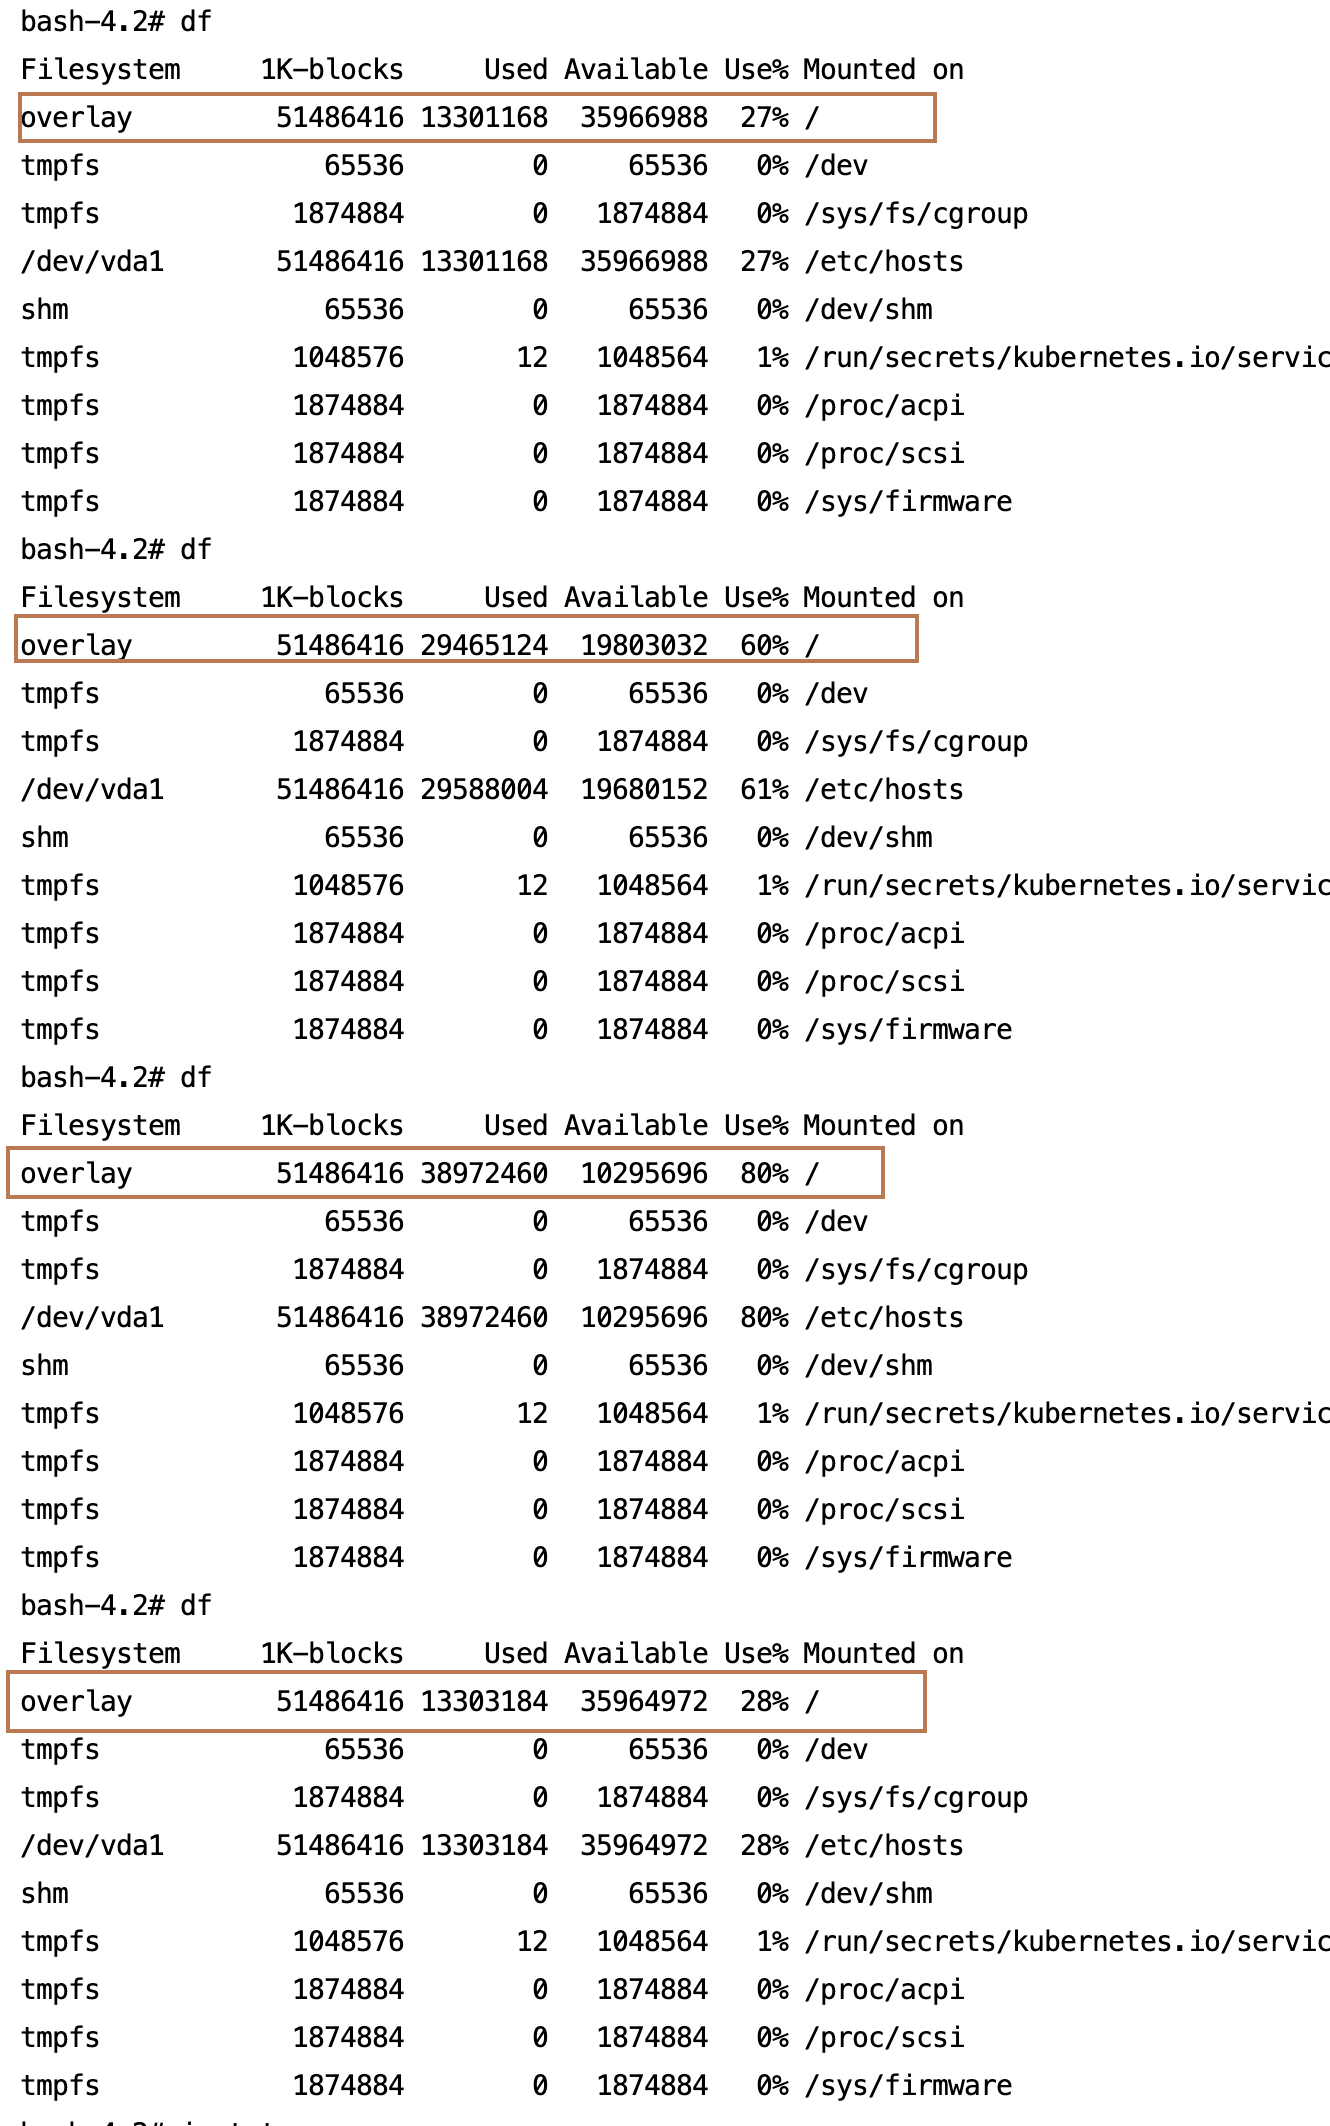
3. Execute the high disk utilization action, log into the container, and use the df command to observe the gradual increase in disk load until it reaches the specified utilization. After the rollback action is executed, it will recover to normal.
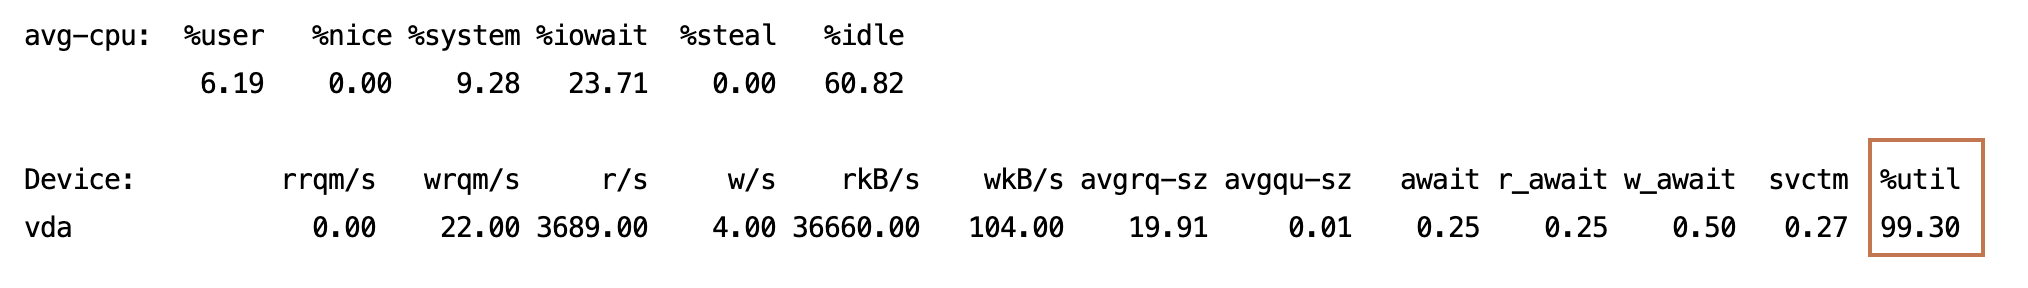
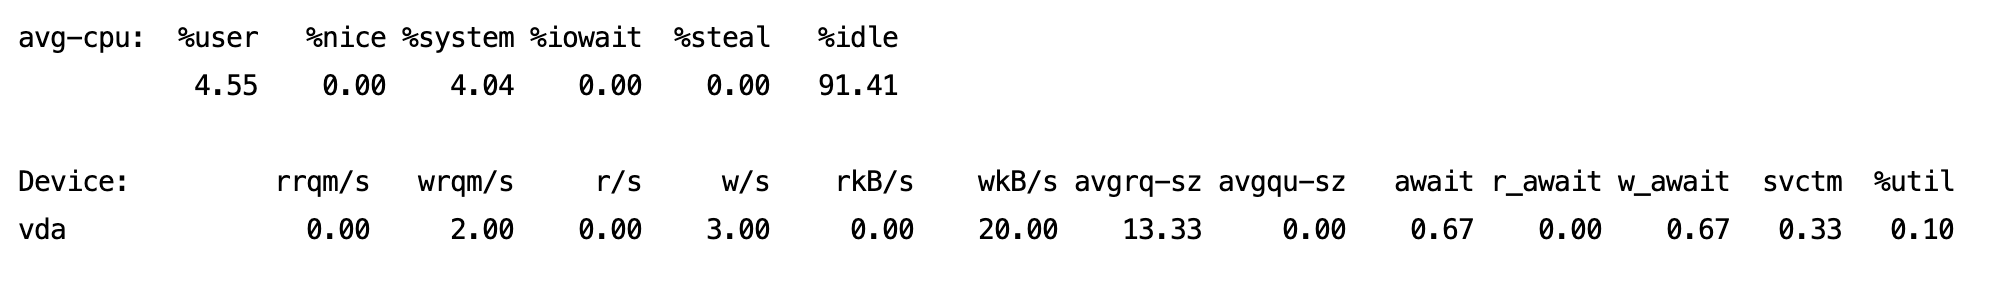
4. Execute the high disk I/O load action, log into the container, and observe using the iostat command.