
Golang 应用接入

最后更新时间:2025-03-17 10:53:43
Prometheus 提供了 官方版 Golang 库 用于采集并暴露监控数据,本文为您介绍如何使用官方版 Golang 库来暴露 Golang runtime 相关的数据,以及其它一些基本简单的示例,并使用 Prometheus 监控服务来采集指标展示数据等。
说明:
安装
通过
go get 命令来安装相关依赖,示例如下:go get github.com/prometheus/client_golang/prometheusgo get github.com/prometheus/client_golang/prometheus/promautogo get github.com/prometheus/client_golang/prometheus/promhttp
开始(运行时指标)
1. 准备一个 HTTP 服务,路径通常使用
/metrics。可以直接使用 prometheus/promhttp 里提供的 Handler 函数。
如下是一个简单的示例应用,通过 http://localhost:2112/metrics 暴露 Golang 应用的一些默认指标数据(包括运行时指标、进程相关指标以及构建相关的指标)。package mainimport ("net/http""github.com/prometheus/client_golang/prometheus/promhttp")func main() {http.Handle("/metrics", promhttp.Handler())http.ListenAndServe(":2112", nil)}
2. 执行以下命令启动应用。
go run main.go
3. 执行以下命令,访问基础内置指标数据。
curl http://localhost:2112/metrics
应用层面指标
1. 上述示例仅仅暴露了一些基础的内置指标。应用层面的指标还需要额外添加(后续我们将提供一些 SDK 方便接入)。如下示例暴露了一个名为
myapp_processed_ops_total 的 计数类型 指标,用于对目前已经完成的操作进行计数。如下每两秒操作一次,同时计数器加1。package mainimport ("net/http""time""github.com/prometheus/client_golang/prometheus""github.com/prometheus/client_golang/prometheus/promauto""github.com/prometheus/client_golang/prometheus/promhttp")func recordMetrics() {go func() {for {opsProcessed.Inc()time.Sleep(2 * time.Second)}}()}var (opsProcessed = promauto.NewCounter(prometheus.CounterOpts{Name: "myapp_processed_ops_total",Help: "The total number of processed events",}))func main() {recordMetrics()http.Handle("/metrics", promhttp.Handler())http.ListenAndServe(":2112", nil)}
2. 执行以下命令启动应用。
go run main.go
3. 执行以下命令,访问暴露的指标。
curl http://localhost:2112/metrics
从输出结果我们可以看到
myapp_processed_ops_total计数器相关的信息,包括帮助文档、类型信息、指标名和当前值,如下所示。# HELP myapp_processed_ops_total The total number of processed events# TYPE myapp_processed_ops_total countermyapp_processed_ops_total 666
使用 Prometheus 监控服务
上述我们提供了两个示例展示如何使用 Prometheus Golang 库来暴露应用的指标数据,但暴露的监控指标数据为文本类型,需要搭建维护额外的 Prometheus 服务来抓取指标,可能还需要额外的 Grafana 来对数据进行可视化展示。
通过使用 Prometheus 监控服务可以直接省去如上步骤,只需简单的单击操作即可使用。详情请参见快速使用指南。
打包部署应用
1. Golang 应用一般可以使用如下形式的 Dockerfile(按需修改)。
FROM golang:alpine AS builderRUN apk add --no-cache ca-certificates \\make \\gitCOPY . /go-buildRUN cd /go-build && \\export GO111MODULE=on && \\export GOPROXY=https://goproxy.io && \\go build -o 'golang-exe' path/to/main/FROM alpineRUN apk add --no-cache tzdataCOPY --from=builder /etc/ssl/certs/ca-certificates.crt /etc/ssl/certsCOPY --from=builder /go-build/golang-exe /usr/bin/golang-exeENV TZ Asia/ShanghaiCMD ["golang-exe"]
2. 镜像可以使用 腾讯云的镜像仓库,或者使用其它公有或者自有镜像仓库。
3. 需要根据应用类型定义一个 Kubernetes 的资源,这里我们使用 Deployment,示例如下。
apiVersion: apps/v1kind: Deploymentmetadata:name: golang-app-demolabels:app: golang-app-demospec:replicas: 3selector:matchLabels:app: golang-app-demotemplate:metadata:labels:app: golang-app-demospec:containers:- name: golang-exe-demo:v1image: nginx:1.14.2ports:- containerPort: 80
4. 同时需要 Kubernetes Service 做服务发现和负载均衡。
apiVersion: v1kind: Servicemetadata:name: golang-app-demospec:selector:app: golang-app-demoports:- protocol: TCPport: 80targetPort: 80
注意:
必须添加一个 Label 来标明目前的应用,Label 名不一定为 app,但是必须有类似含义的 Label 存在,其它名字的 Label 我们可以在后面添加数据采集任务的时候做 relabel 来达成目的。
添加数据采集任务
当服务运行起来之后,需要进行如下操作让腾讯云 Prometheus 监控服务发现并采集监控指标:
1. 登录 云监控 Prometheus 控制台,选择对应 Prometheus 实例进入管理页面。
2. 通过集成容器服务列表单击集群 ID,进入到容器服务集成管理页面。
3. 通过服务发现添加
Service Monitor,目前支持基于 Labels 发现对应的目标实例地址,因此可以对一些服务添加特定的 K8S Labels,可以使 Labels 下的服务都会被 Prometheus 服务自动识别出来,不需要再为每个服务一一添加采取任务,以上面的例子配置信息如下:说明:
port 的取值为 service yaml 配置文件里的 spec/ports/name 对应的值。apiVersion: monitoring.coreos.com/v1kind: ServiceMonitormetadata:name: go-demo # 填写一个唯一名称namespace: cm-prometheus # namespace固定,不要修改spec:endpoints:- interval: 30s# 填写service yaml中Prometheus Exporter对应的Port的Nameport: 2112# 填写Prometheus Exporter对应的Path的值,不填默认/metricspath: /metricsrelabelings:# ** 必须要有一个 label 为 application,这里假设 k8s 有一个 label 为 app,# 我们通过 relabel 的 replace 动作把它替换成了 application- action: replacesourceLabels: [__meta_kubernetes_pod_label_app]targetLabel: application# 选择要监控service所在的namespacenamespaceSelector:matchNames:- golang-demo# 填写要监控service的Label值,以定位目标serviceselector:matchLabels:app: golang-app-demo
注意:
查看监控
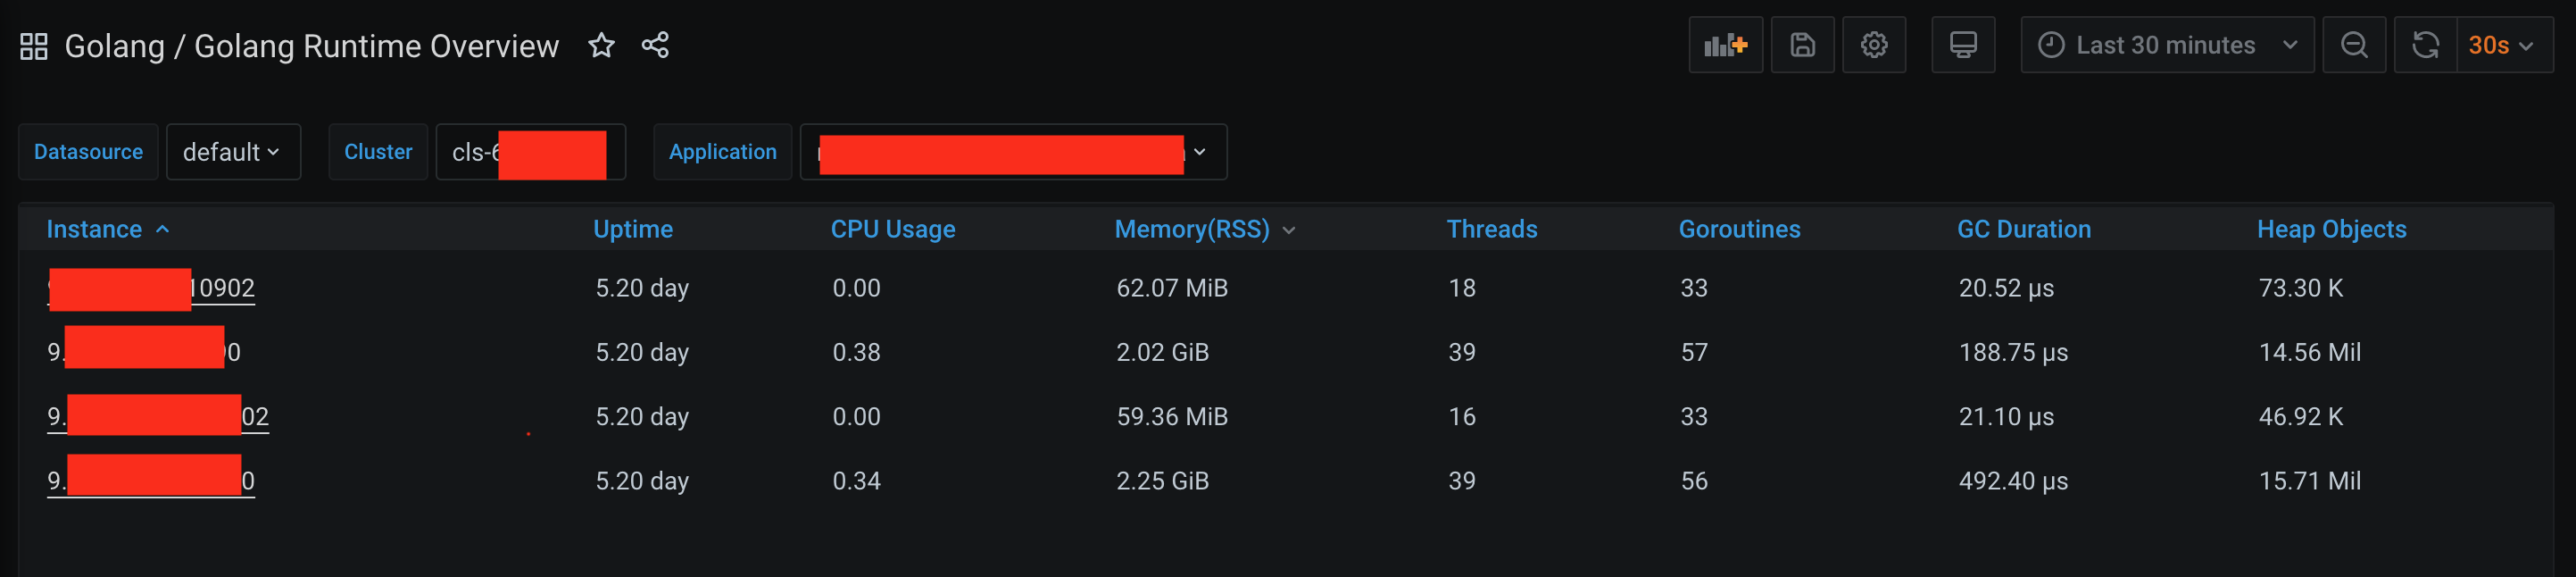
1. 在 Prometheus 实例 列表,找到对应的 Prometheus 实例,单击实例ID 右侧
2. 进入 Grafana,单击
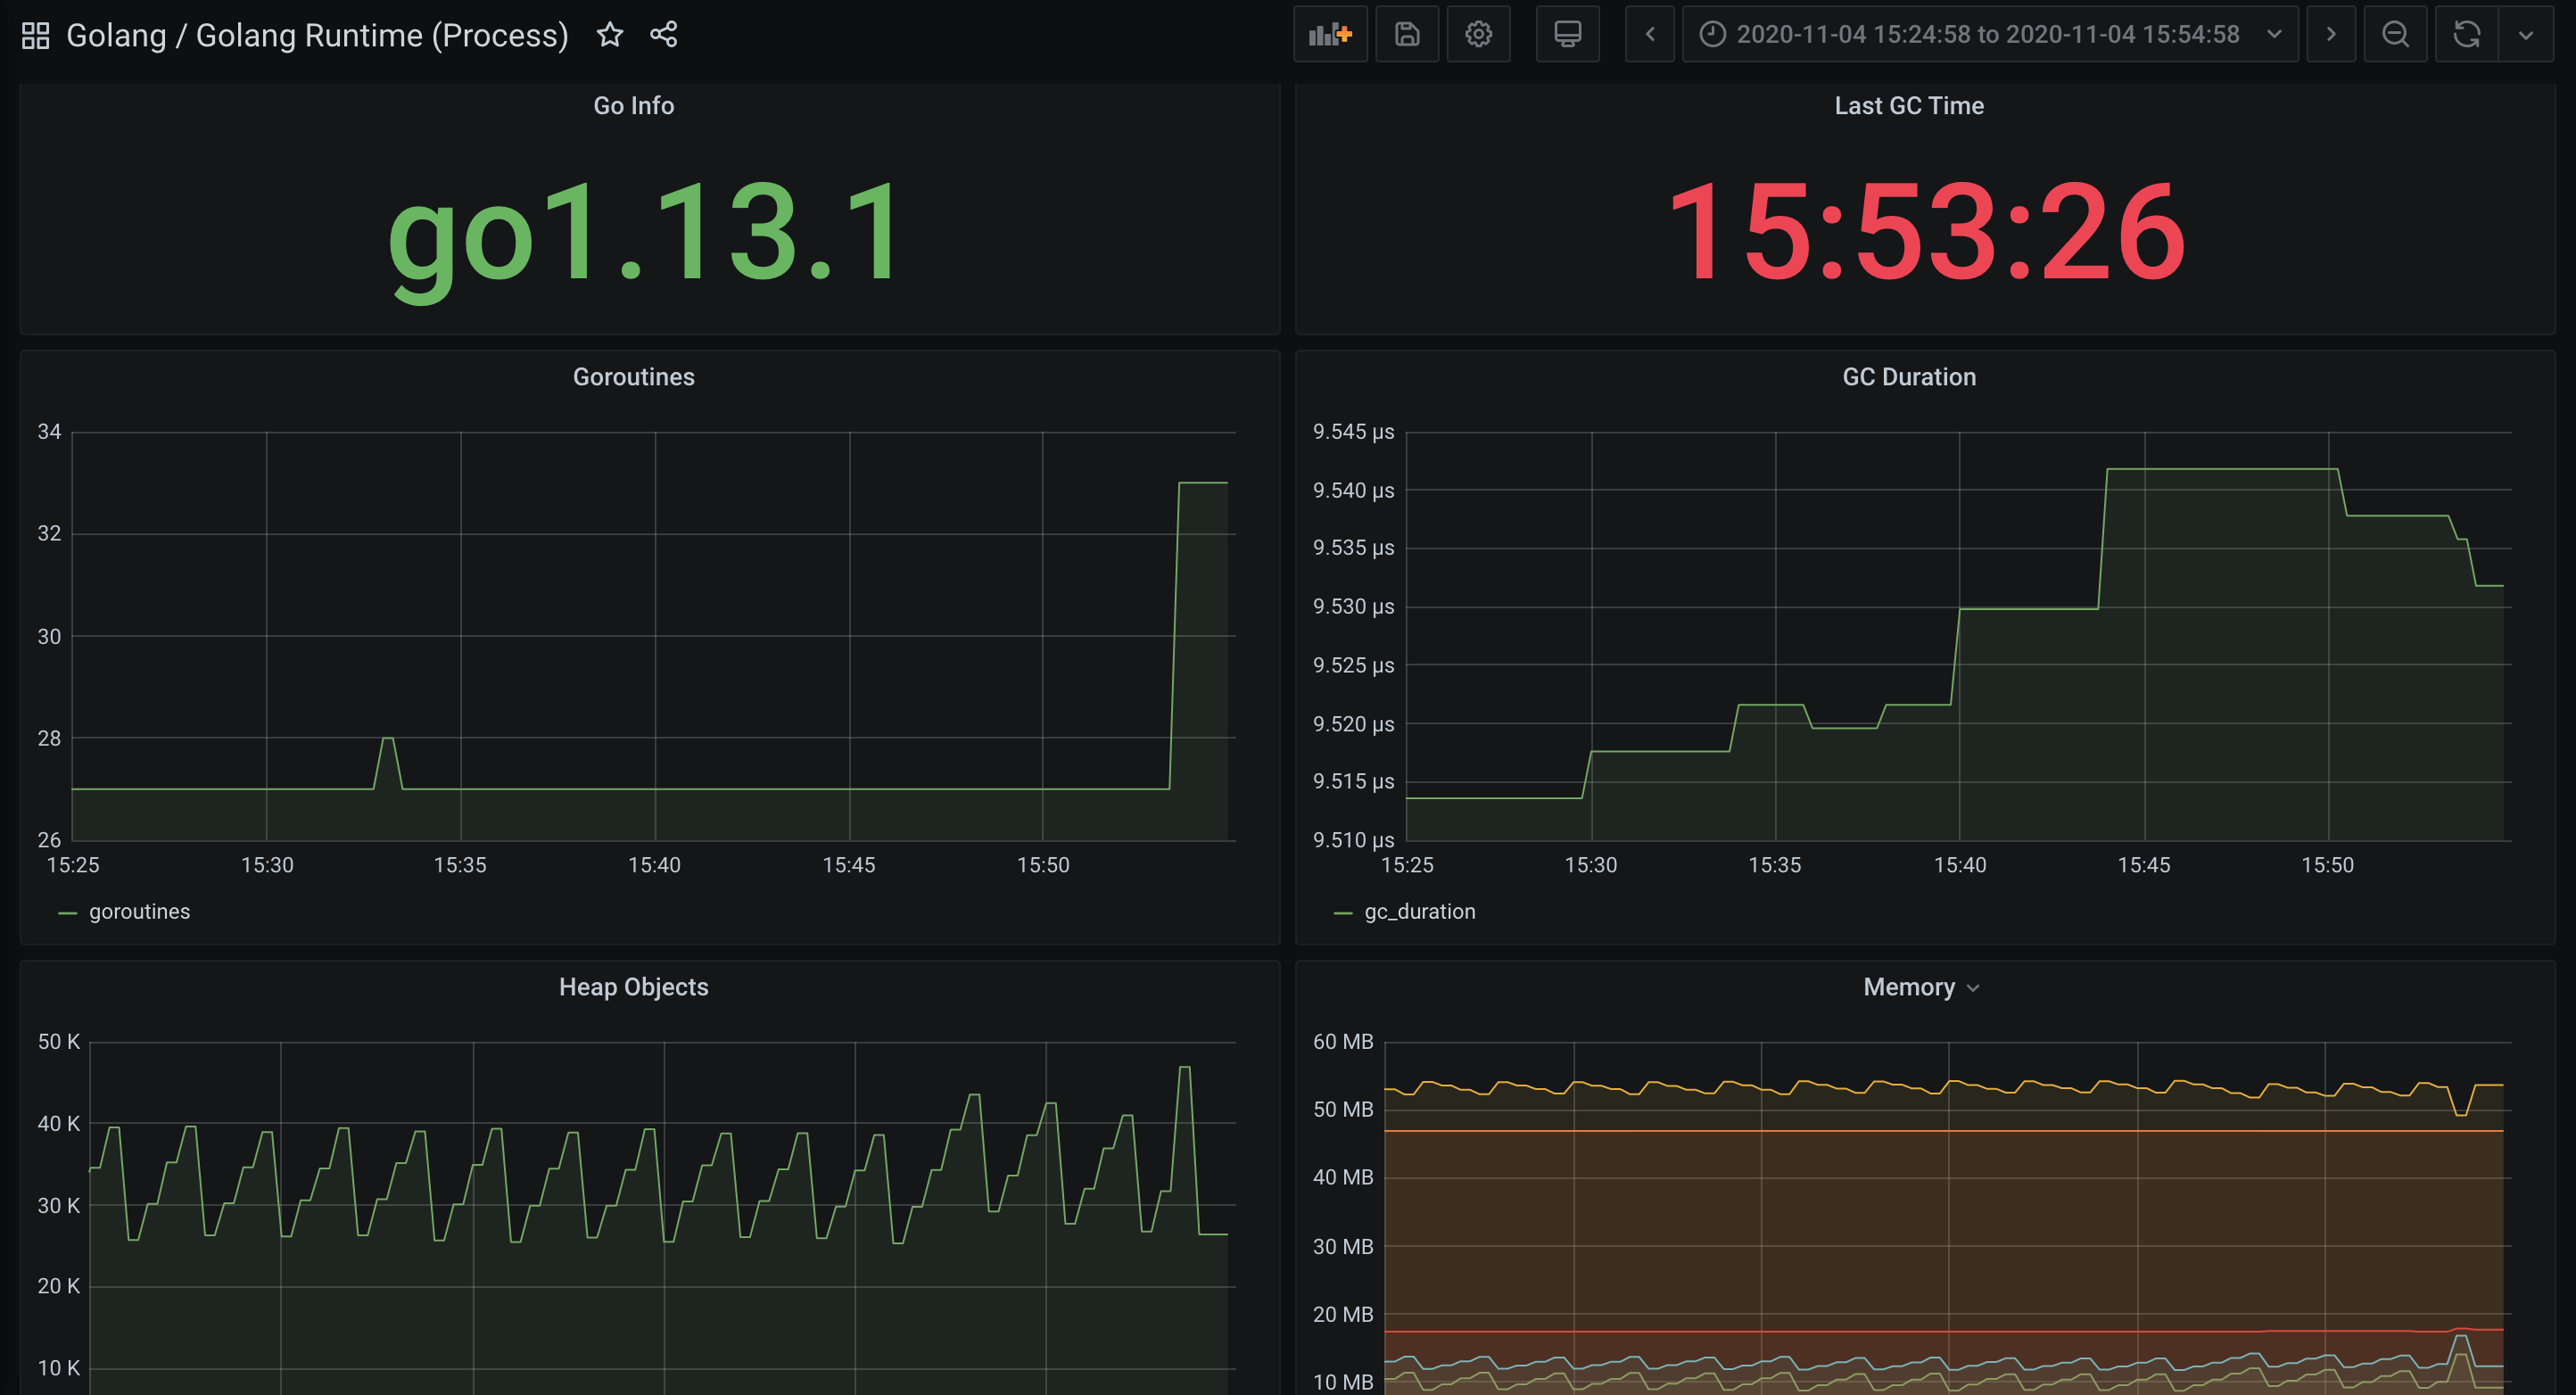
总结
本文通过两个示例展示了如何将 Golang 相关的指标暴露给 Prometheus 监控服务,以及如何使用内置的可视化的图表查看监控数据。文档只使用了计数类型 Counter 的指标,对于其它场景可能还需要 Gauge、Histgram 以及 Summary 类型的指标,请参见 指标类型。
对于其它应用场景,我们会集成更多框架提供更多开箱即用的指标监控、可视化面板以及告警模板。
文档反馈