Log analysis is an important part of the CWPP protection solution. It provides security event logs about the CWPP. It supports SQL retrieval and query. It offers visualized reports and statistics. This helps users quickly identify intrusions, conduct source tracing, and perform other security operation tasks. This document will introduce how to use the log analysis feature.
Restrictions
Log data can be collected. It is subjected to the following restrictions by the host protection edition.
Log Category
Log Type
Log Description
Supported Versions
Host Asset Logs
Host Information
Includes host instance ID, IP, operating system, region, VPC, instance status, and whether the CWPP agent is installed.
Note:
Only the Synchronization Time of the host is changed. The rest of the information remains unchanged. It will not generate log entry.
All Hosts
Asset Fingerprint
Includes resource monitoring, account, port, software application, process, database, web application, web service, web framework, website, Java archive file, startup service, scheduled task, environment variable, kernel module, and system installation package.
Note:
Only the Data Update Time of the asset fingerprint is changed. The rest of the information remains unchanged. It will not generate log entry.
Pro edition, and Ultimate edition
Client-Reported Logs
Client Reporting
Original host logs (including system authentication and license information, system security information, system messages, and system audit information); DNS logs, process snapshot logs, network five-tuple logs, file monitoring logs, and log-in activity logs.
Emergency vulnerabilities, Linux software vulnerabilities, Windows system vulnerabilities, Web-CMS vulnerabilities, and application vulnerabilities.
Pro edition and Ultimate edition
Baseline Management
Security baseline
Pro edition and Ultimate edition
Advanced Defense
Corefile monitoring, Java Webshell, and network attacks
Ultimate edition
Client-Related
Client offline and client uninstallation
Basic edition and later
To use the log shipping feature, you must first purchase a TDMQ for CKafka instance, and select the appropriate CKafka instance specification based on the volume of logs to be shipped.
The log shipping feature only supports using a single TDMQ for CKafka account for shipping.
According to the Cybersecurity Law, the log storage duration must be at least 6 months. It is recommended that each server be configured with a storage capacity of 20 - 40 GB to collect and retain log data.
2. In the left sidebar, choose Log Analysis to perform operations such as log query and log shipping.
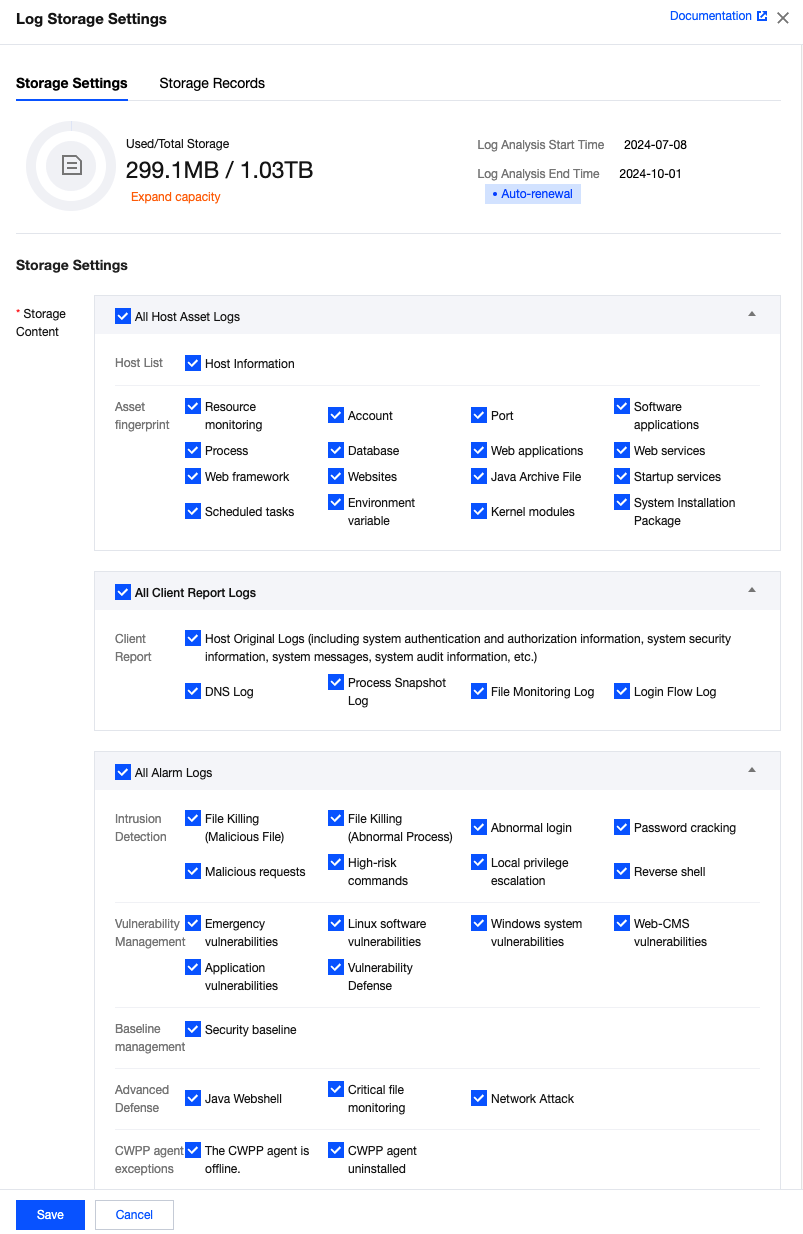
Log Storage Settings
Click Log Storage Settings , a pop-up window will appear. In the Storage Settings section, you can view the current log storage status and configure the storage content and storage duration. In the Storage Records section, you can view the log storage status at midnight on the last day of each month. By default, the display is in reverse chronological order.
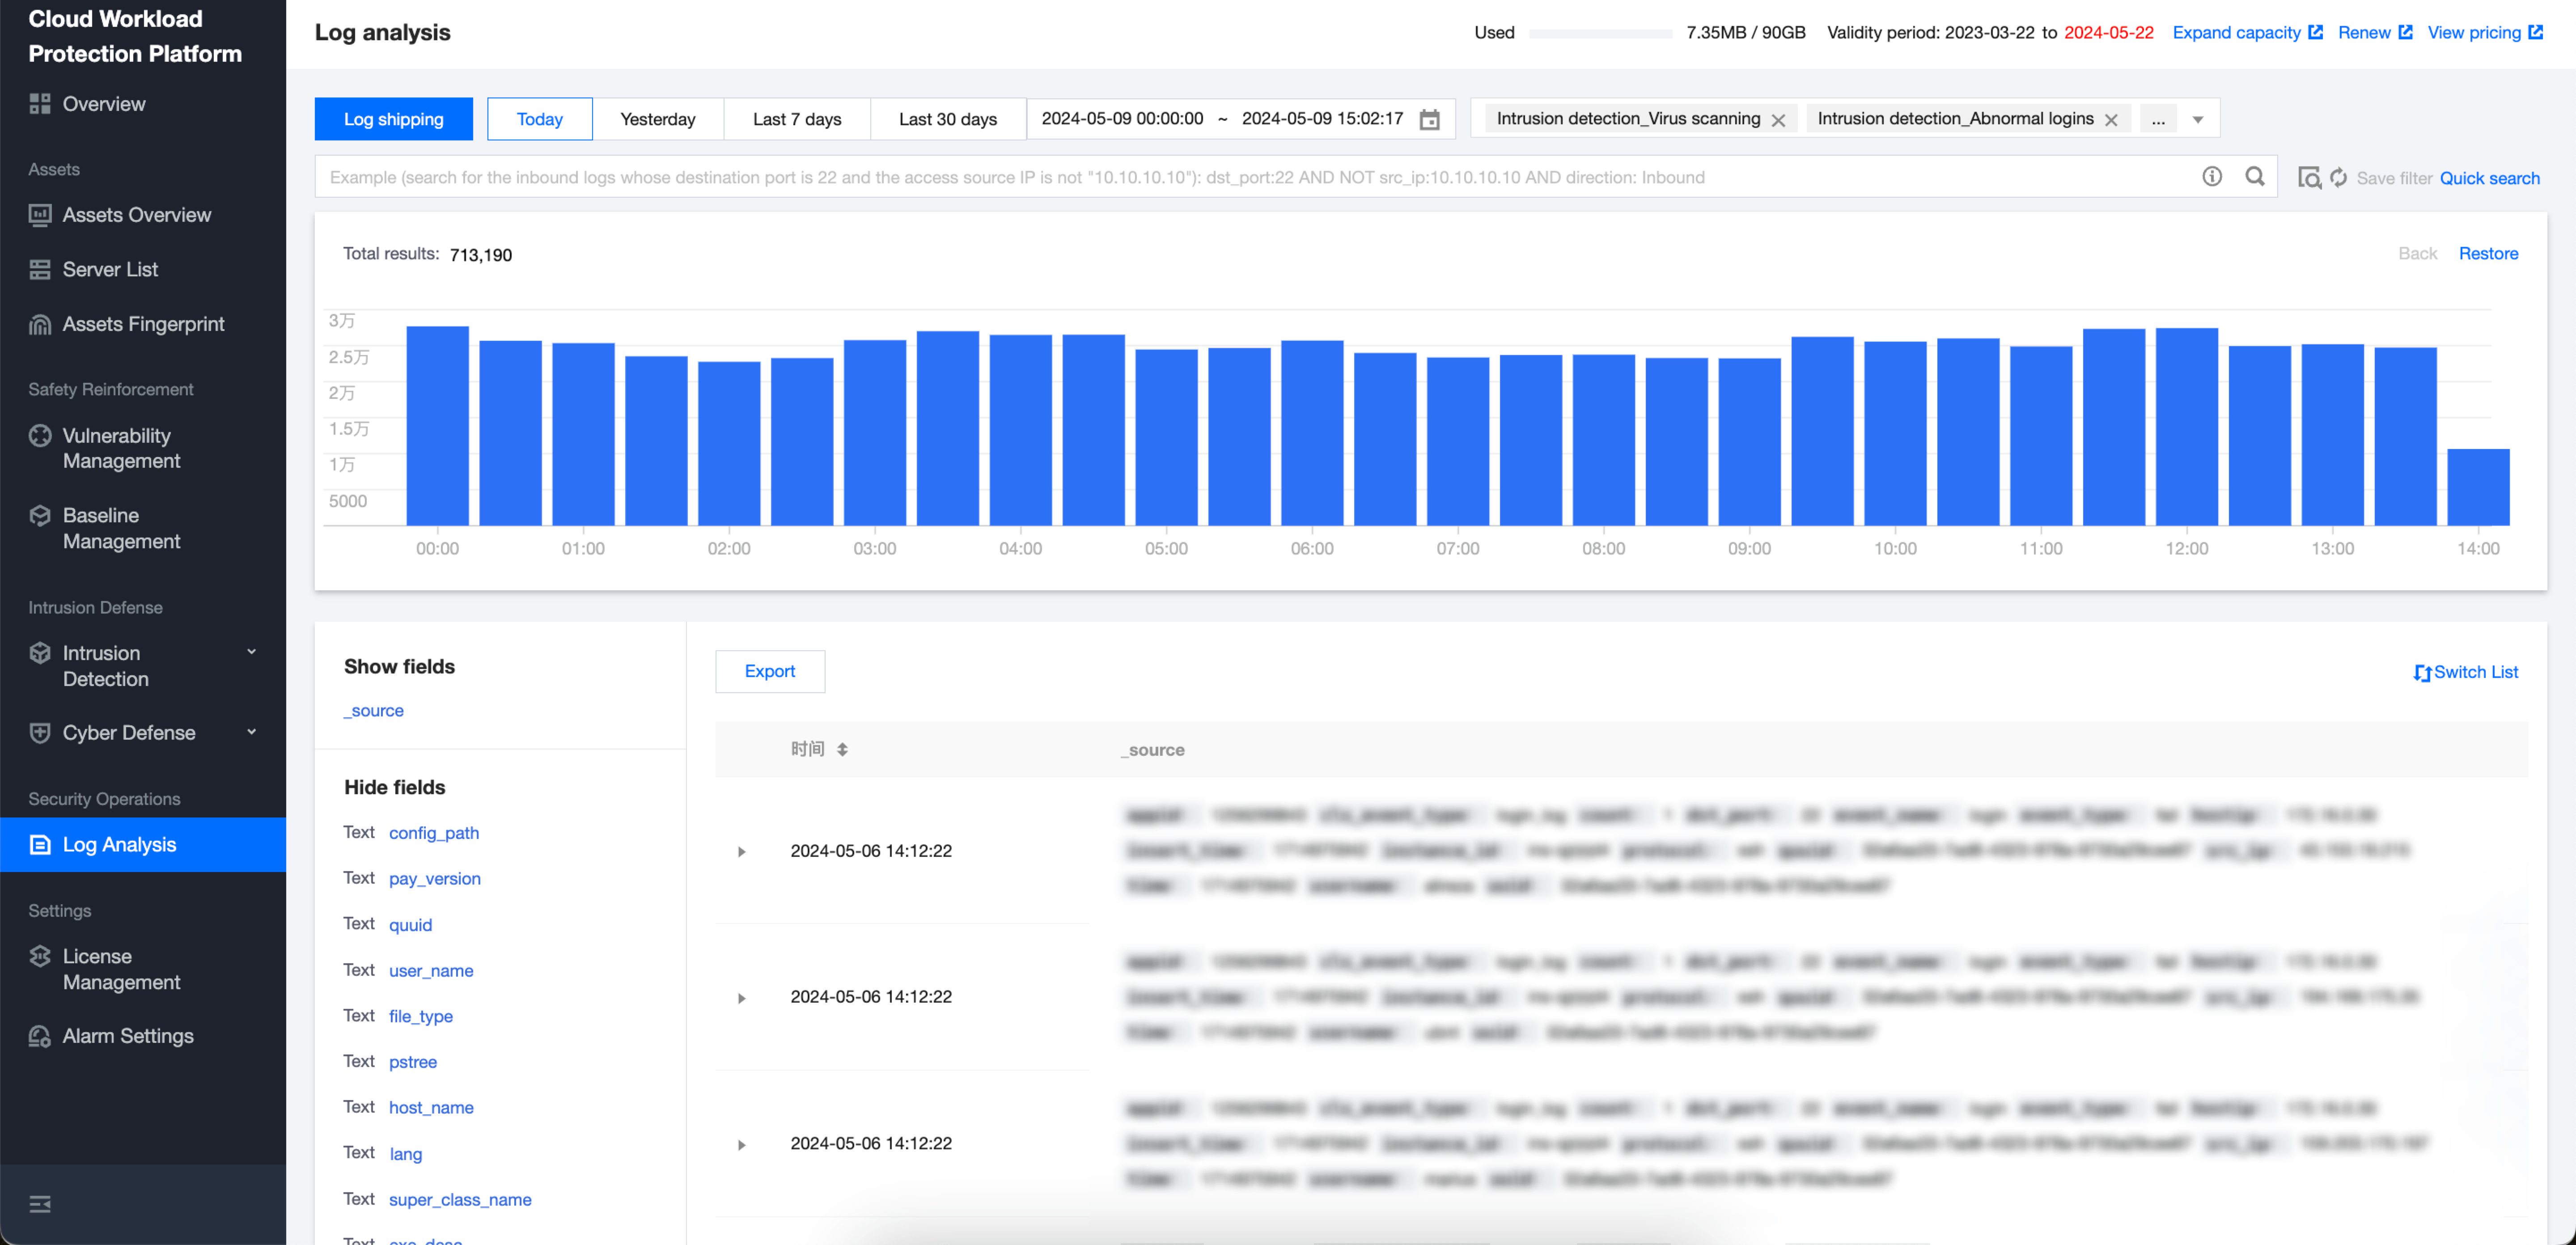
Viewing Logs
On the log analysis page, logs can be filtered based on the following methods.
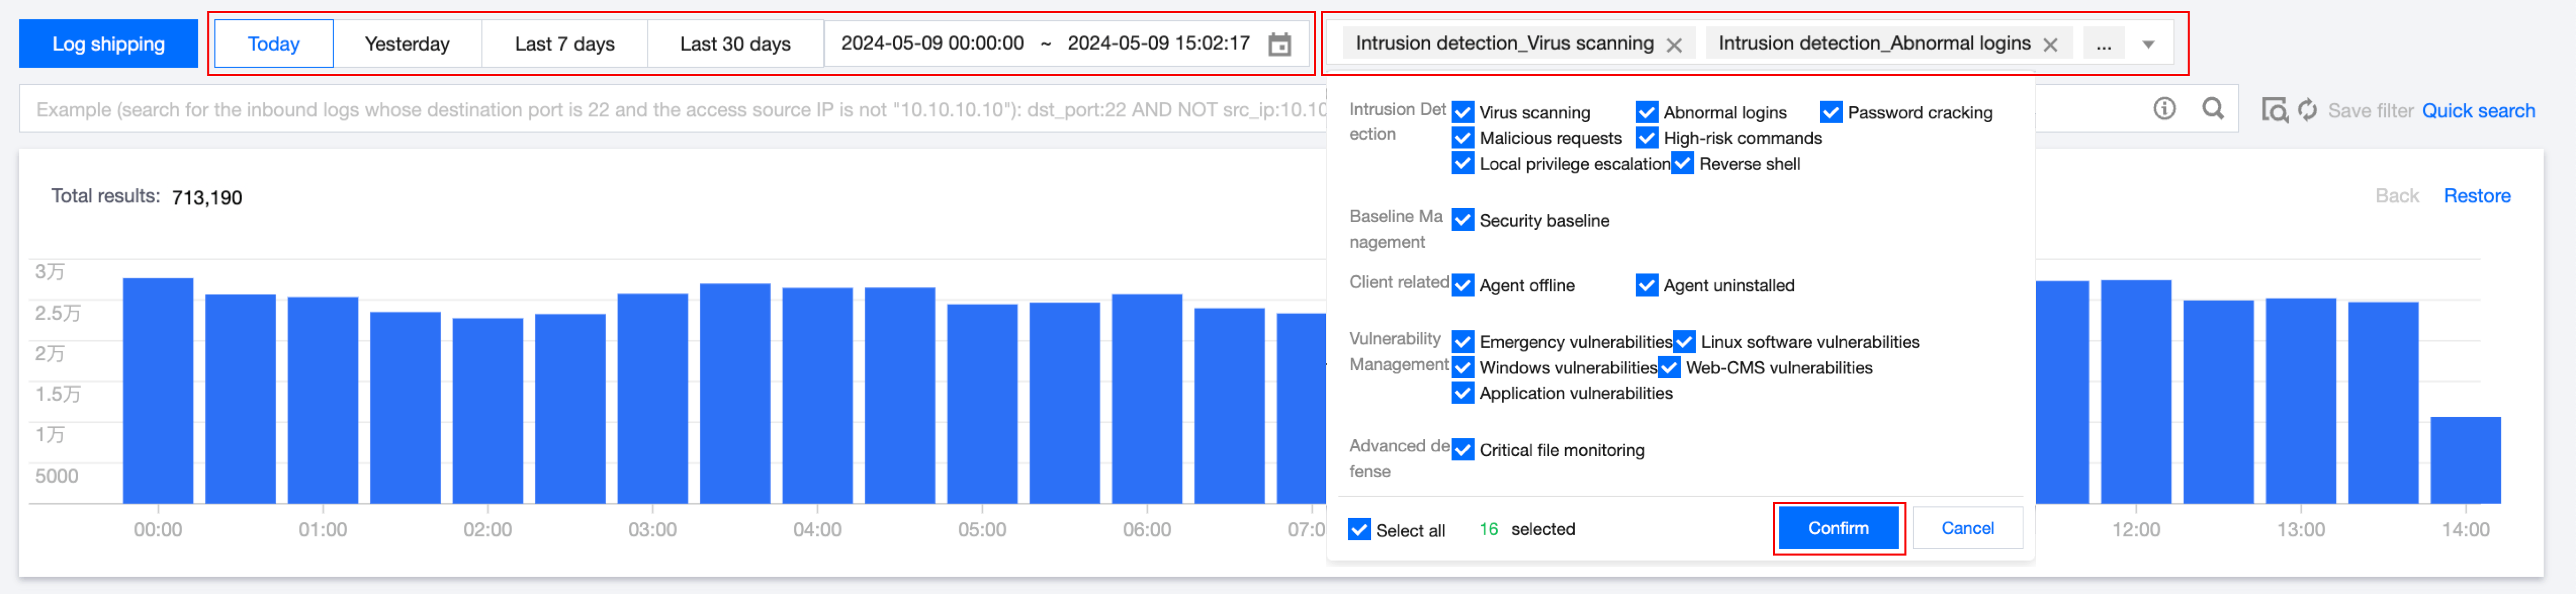
Filter by Time or Type: At the top of the log analysis page, you can filter logs by time and log type. Choose the time range or log type, and click Confirm.
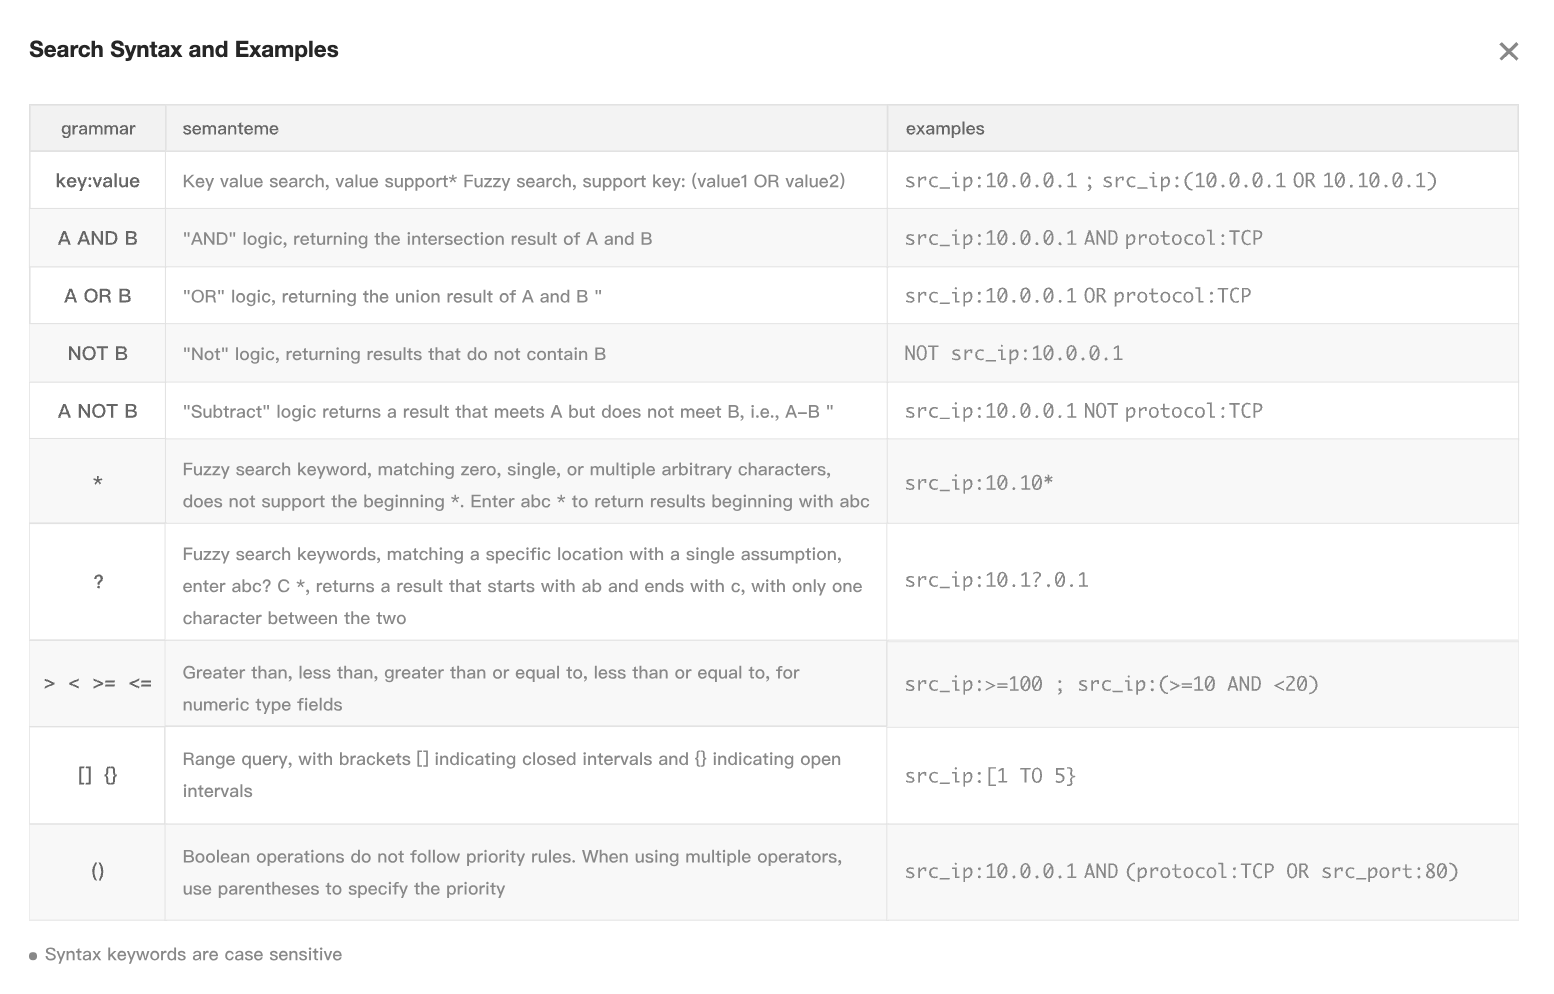
Filter by Field Value: At the top of the log analysis page, you can filter by entering a field value in the search box or by choosing a field match filter.
Filter by Search Box Input Field Value: See the following figure. Enter the desired field and field value in the search box, and click
to filter.
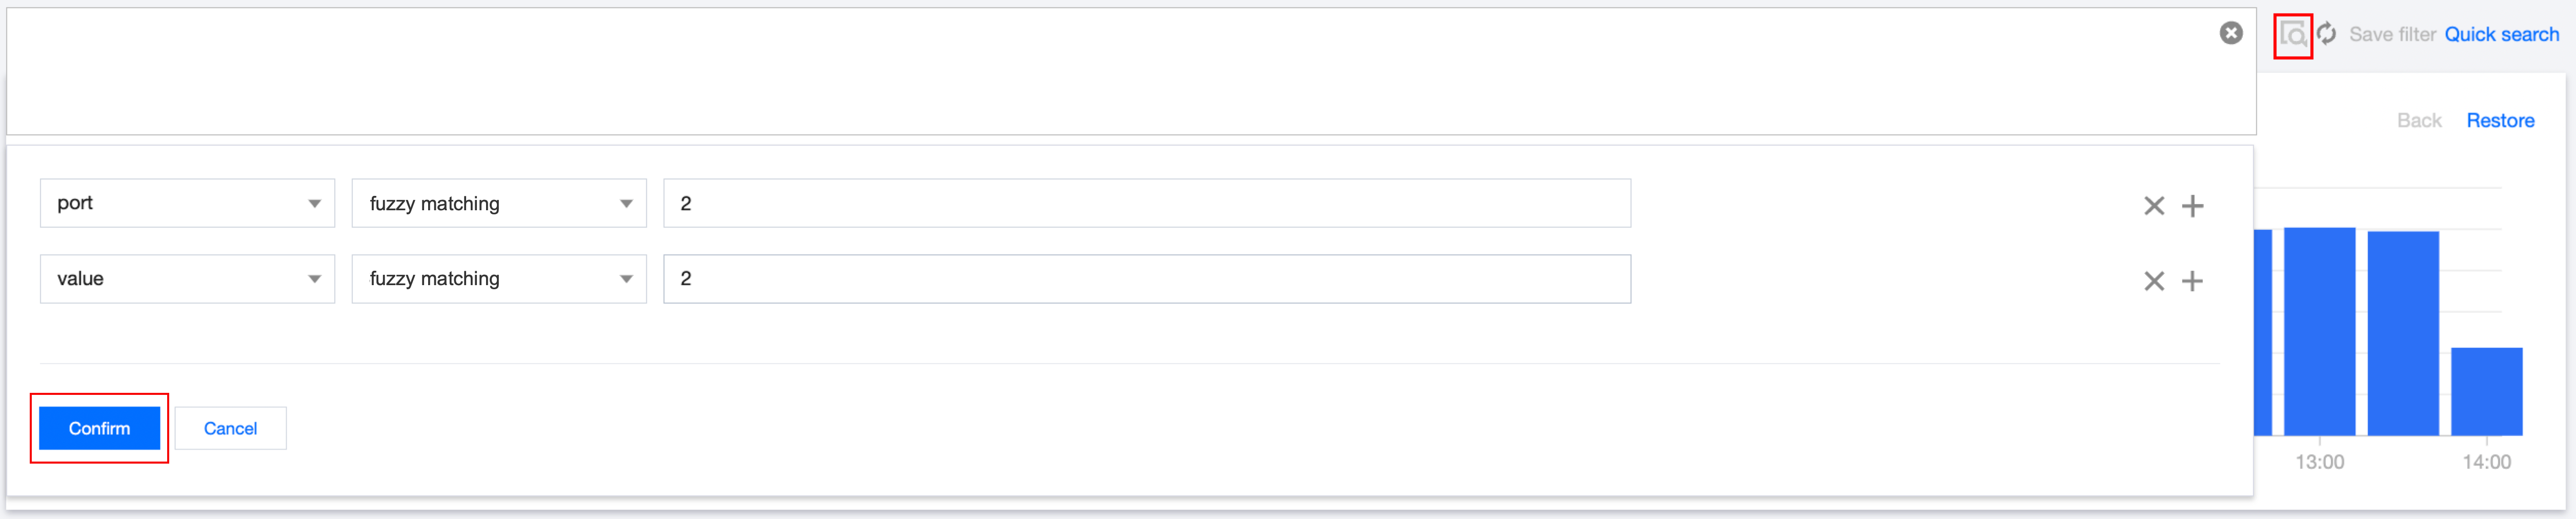
Choose Field Match Filter: Click
. Choose the appropriate field and operator from the drop-down list. Enter the corresponding field value, and then click Confirm to filter.
Note:
For commonly used searches, you can Save Search. Next time, simply click Quick Search, and choose the previously saved search content to filter.
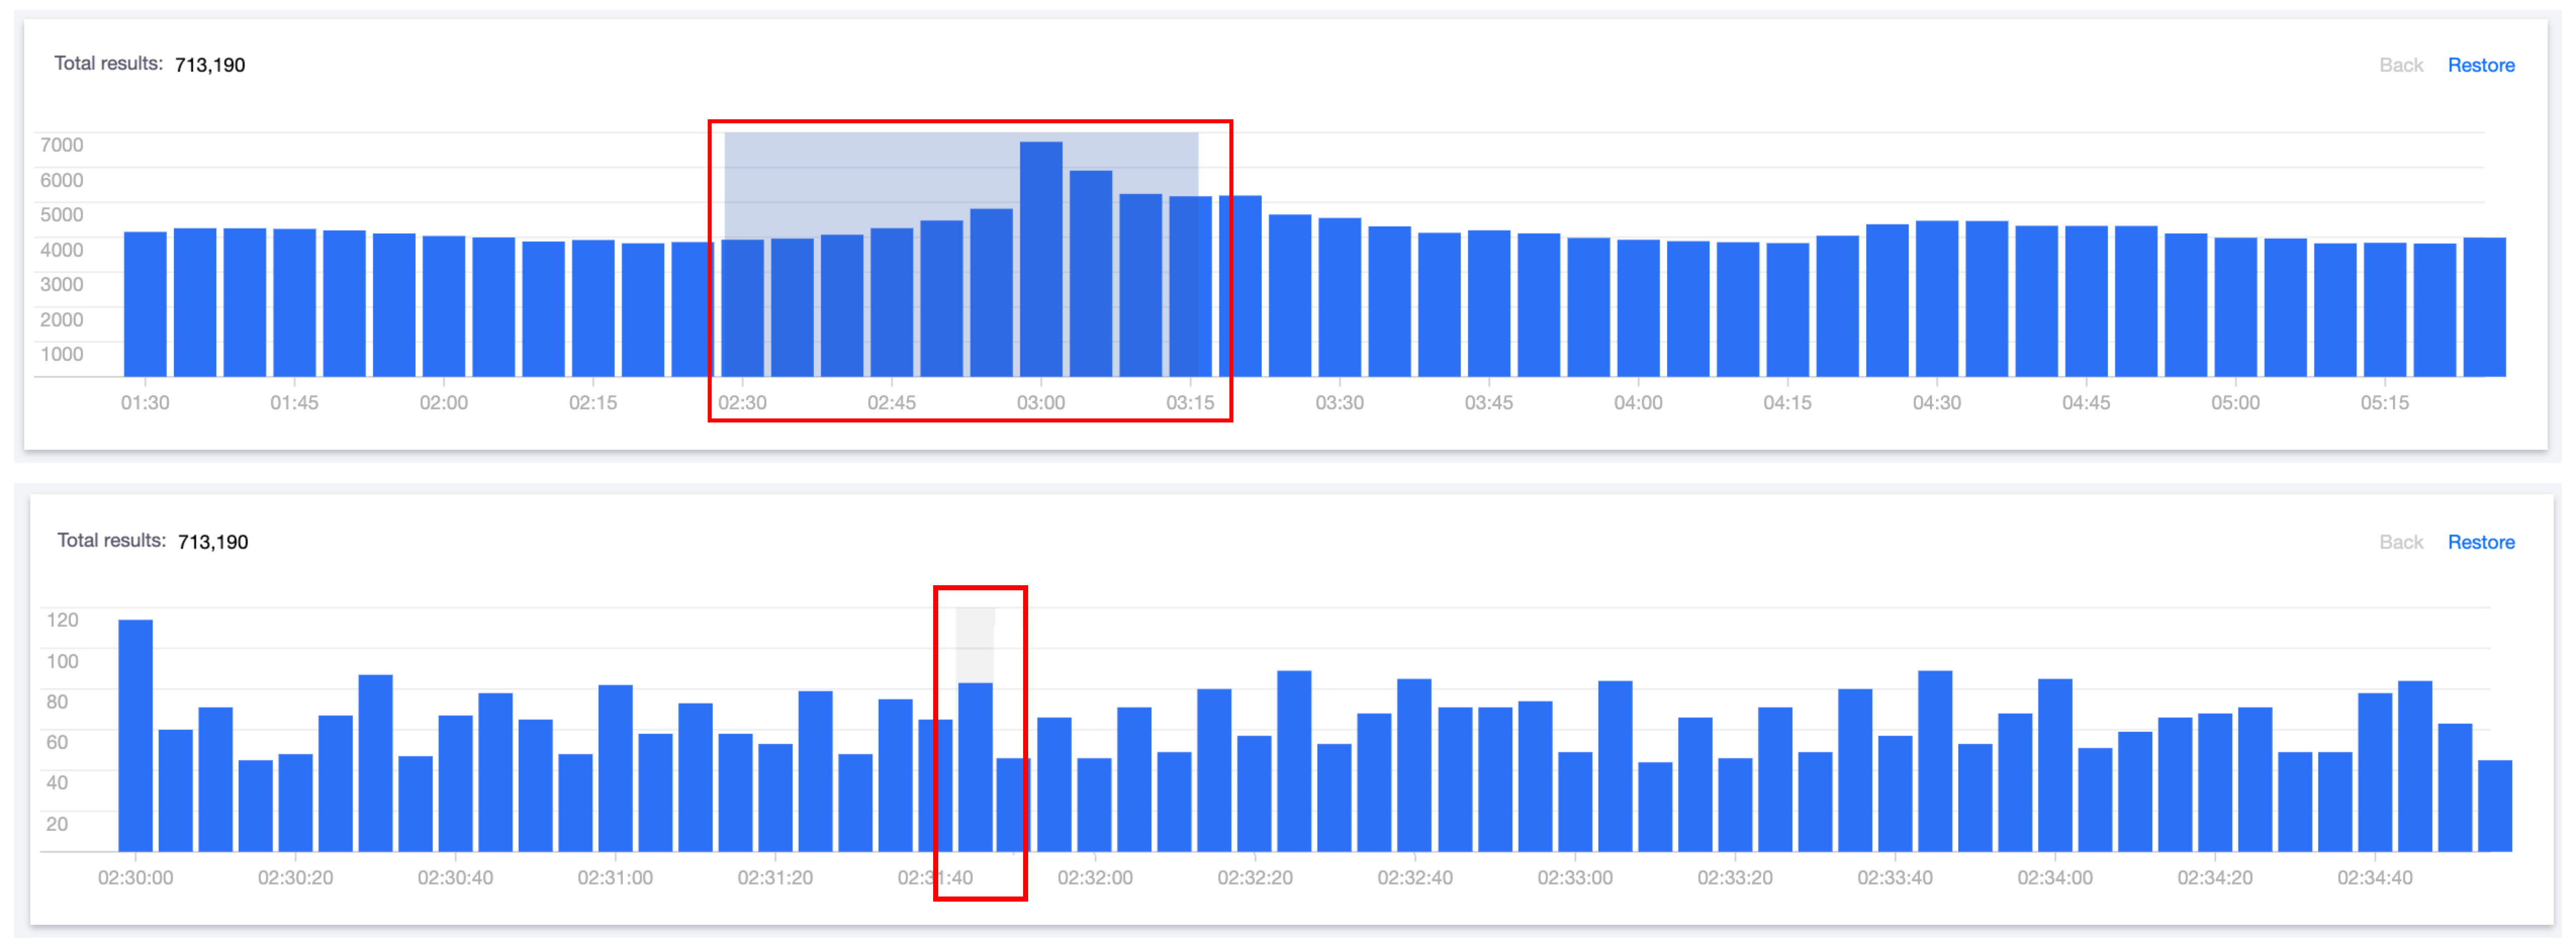
On the log analysis page, click on the bar chart or click and slide to quickly select a time range for a drill-down view.
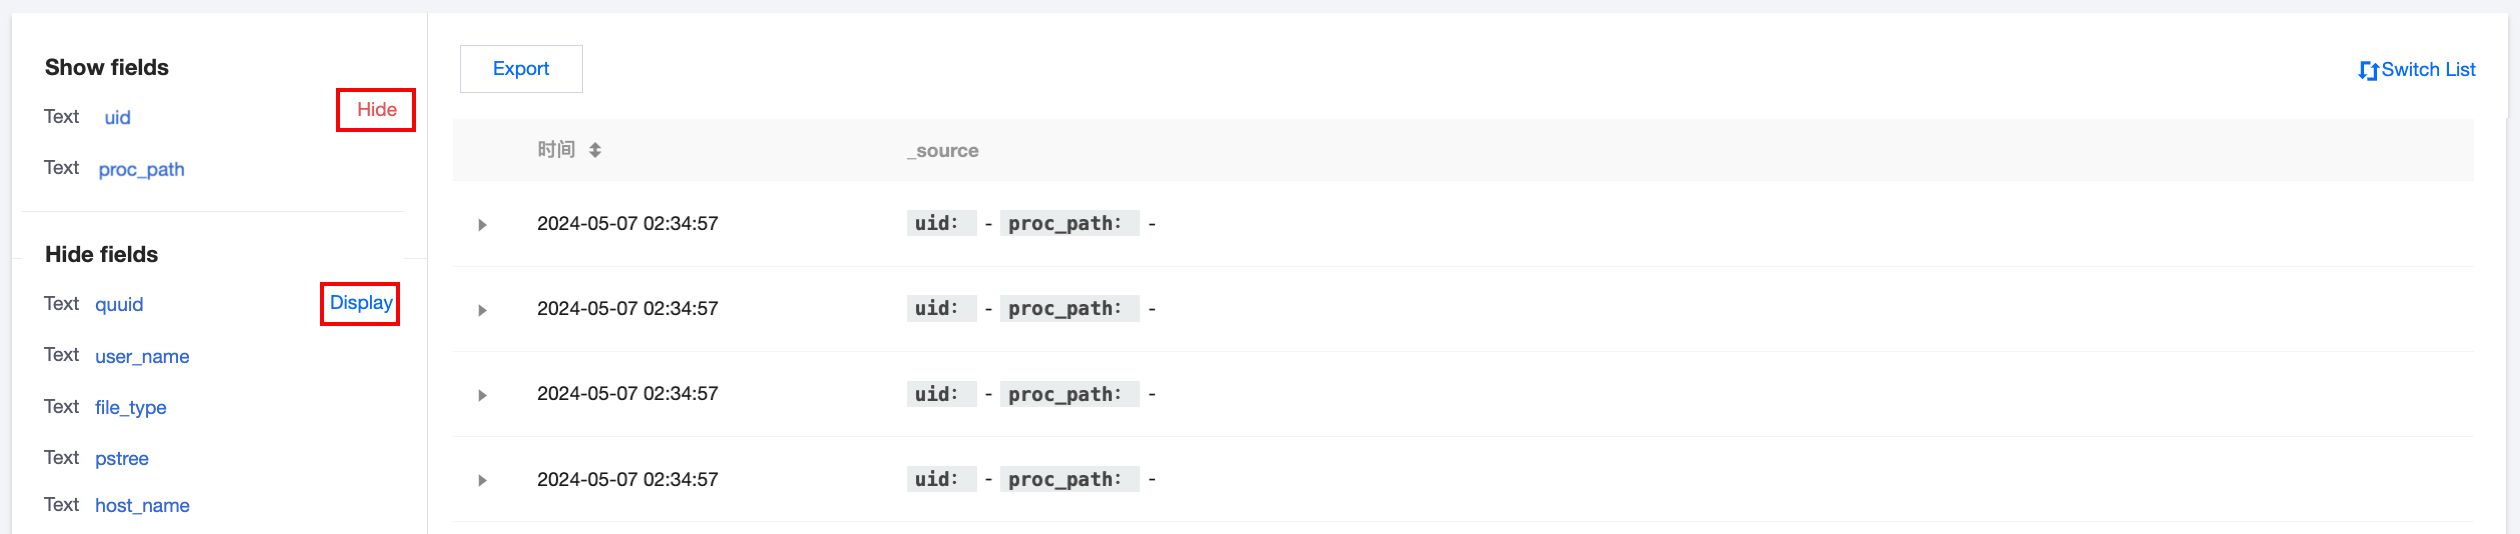
On the log analysis page, in the field navigation on the left side of the list, you can customize display fields and hidden fields.
Click Export to export logs that meet the search criteria as a file. Download it through the browser to a local directory.
Note:
A single export supports up to 60,000 log records, with a maximum of 10,000 records per log type.
Log Shipping
On the log analysis page, you can configure different log types of CWPP to be shipped to different topics in the specified CKafka instances.
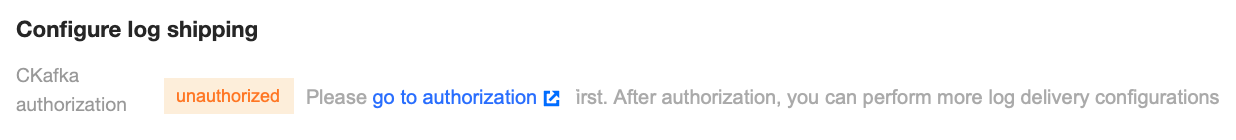
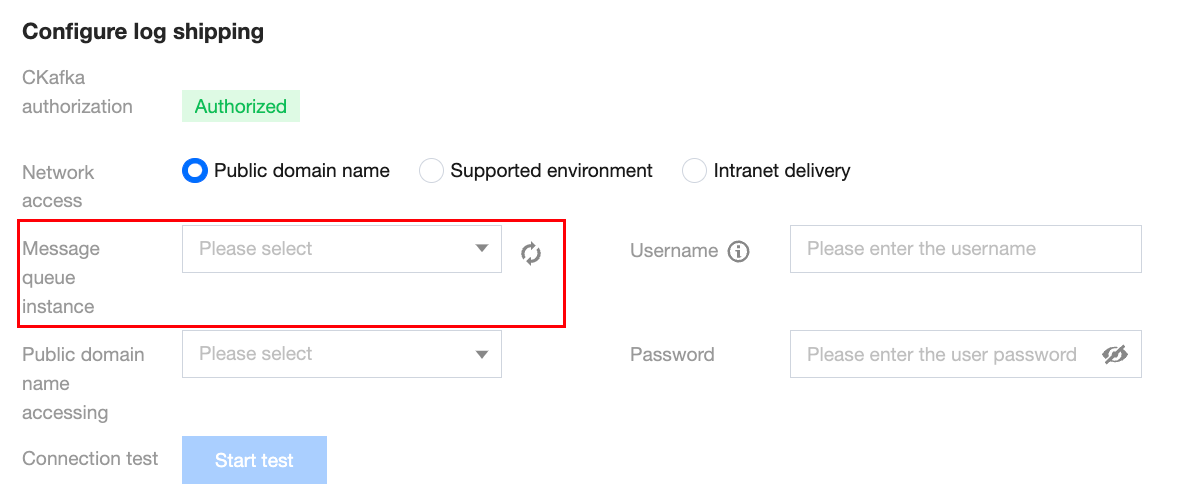
1. Click Log Shipping on the top left corner to open the log shipping configuration pop-up. If the CKafka service is not authorized for the first time, click Go to Authorize first. After agreeing to the service authorization, you may make more log shipping configurations.
2. After agreeing to the authorization service, you must choose the TDMQ for CKafka instance and network access method. Enter the username and password for the selected TDMQ for CKafka instance, and conduct a connectivity test.
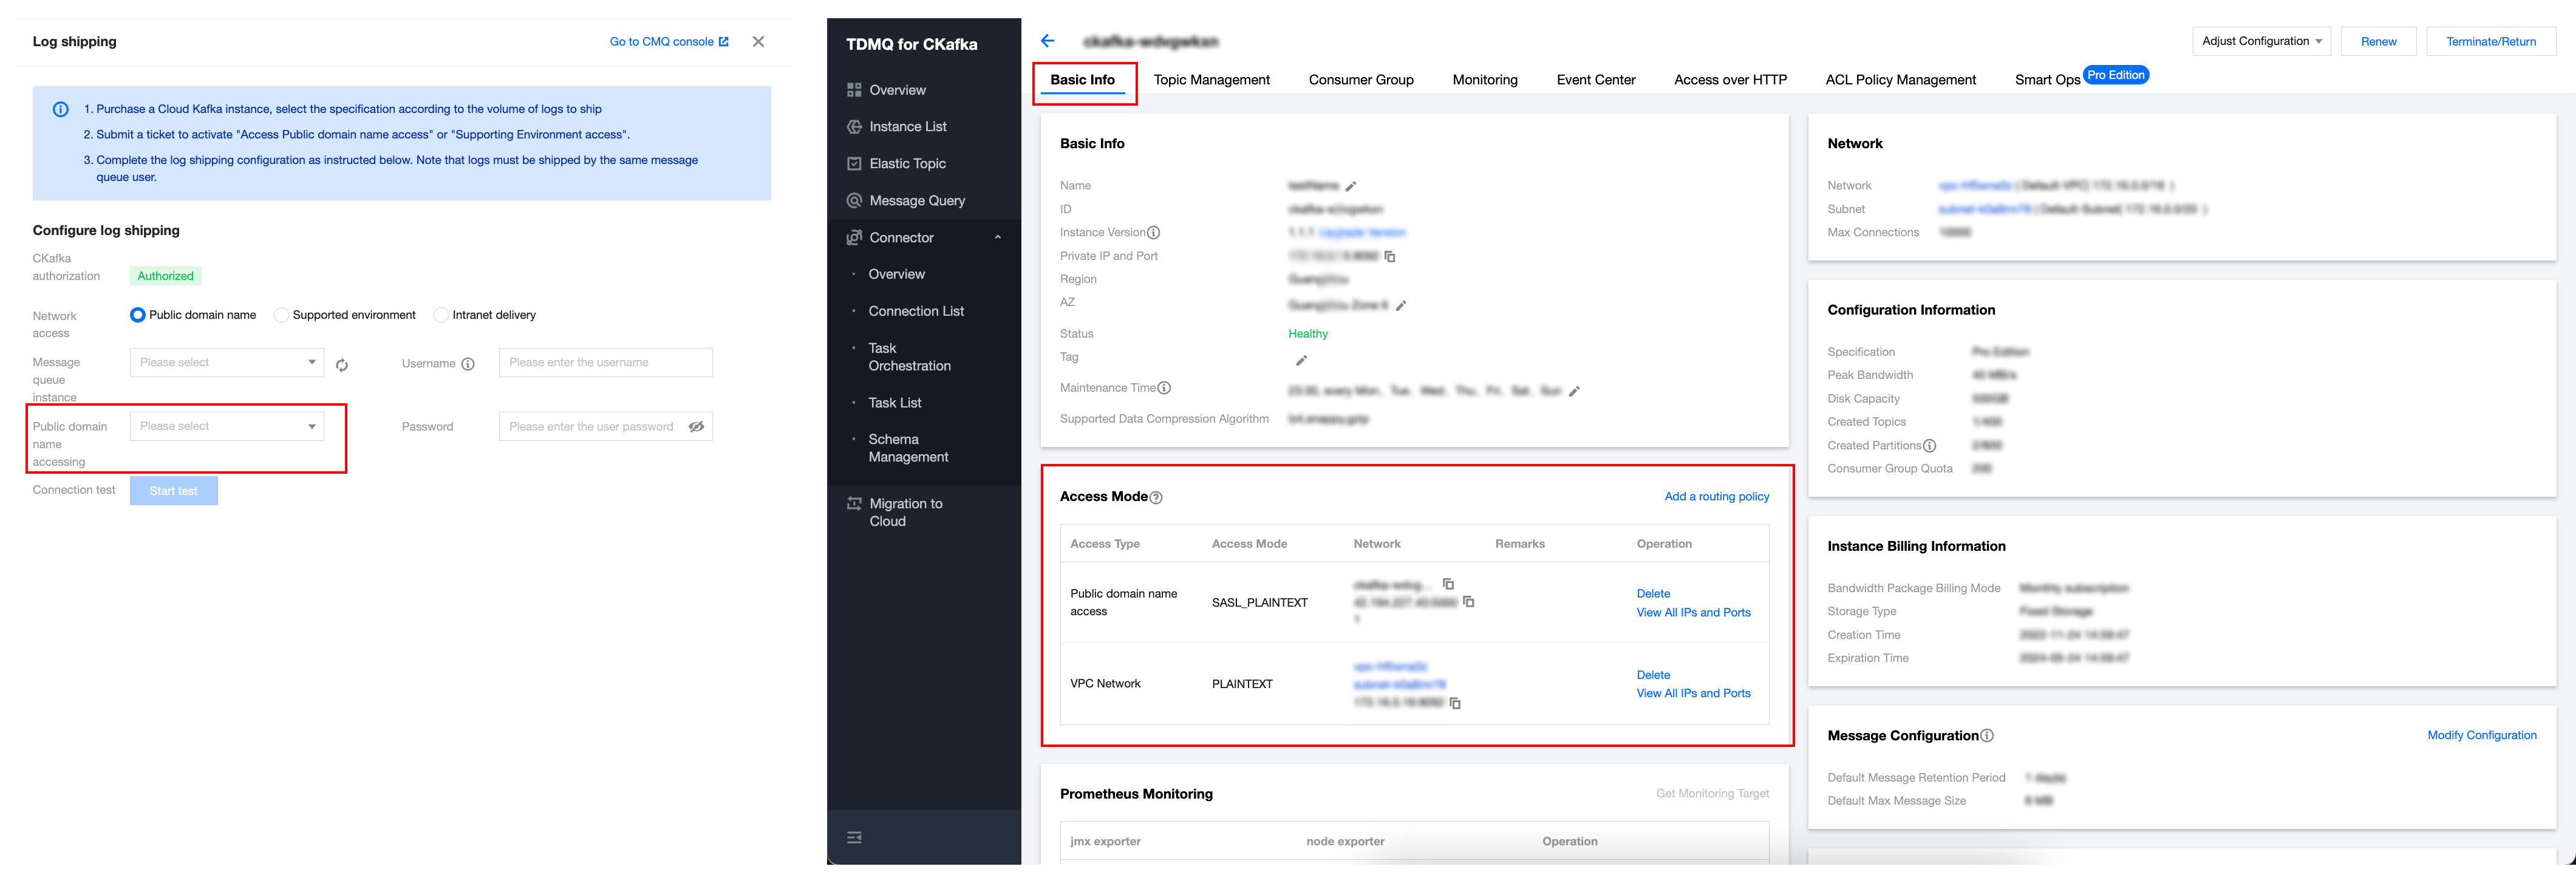
3. Choose the network access method.
Network Access Method
Description
Optional Routing Instructions
Public domain name access.
Logs are shipped through the public network.
This is the designated access method for TDMQ for CKafka instances.
Supporting environment access.
Logs are shipped through Tencent Cloud's private network. It offers higher performance.
This is the designated access method for TDMQ for CKafka instances. But the PLAINTEXT access method is currently not supported.
Private network shipping.
Logs are shipped through Tencent Cloud's private network without the need for users to configure routing in CKafka. An invisible private network routing is automatically created to support the access.
-
Note:
If the network access method is chosen as Public Domain Name Access or Supporting Environment Access, you also need to select an access routing. The routing policy corresponds to the access method detailed in the CKafka Instance List.
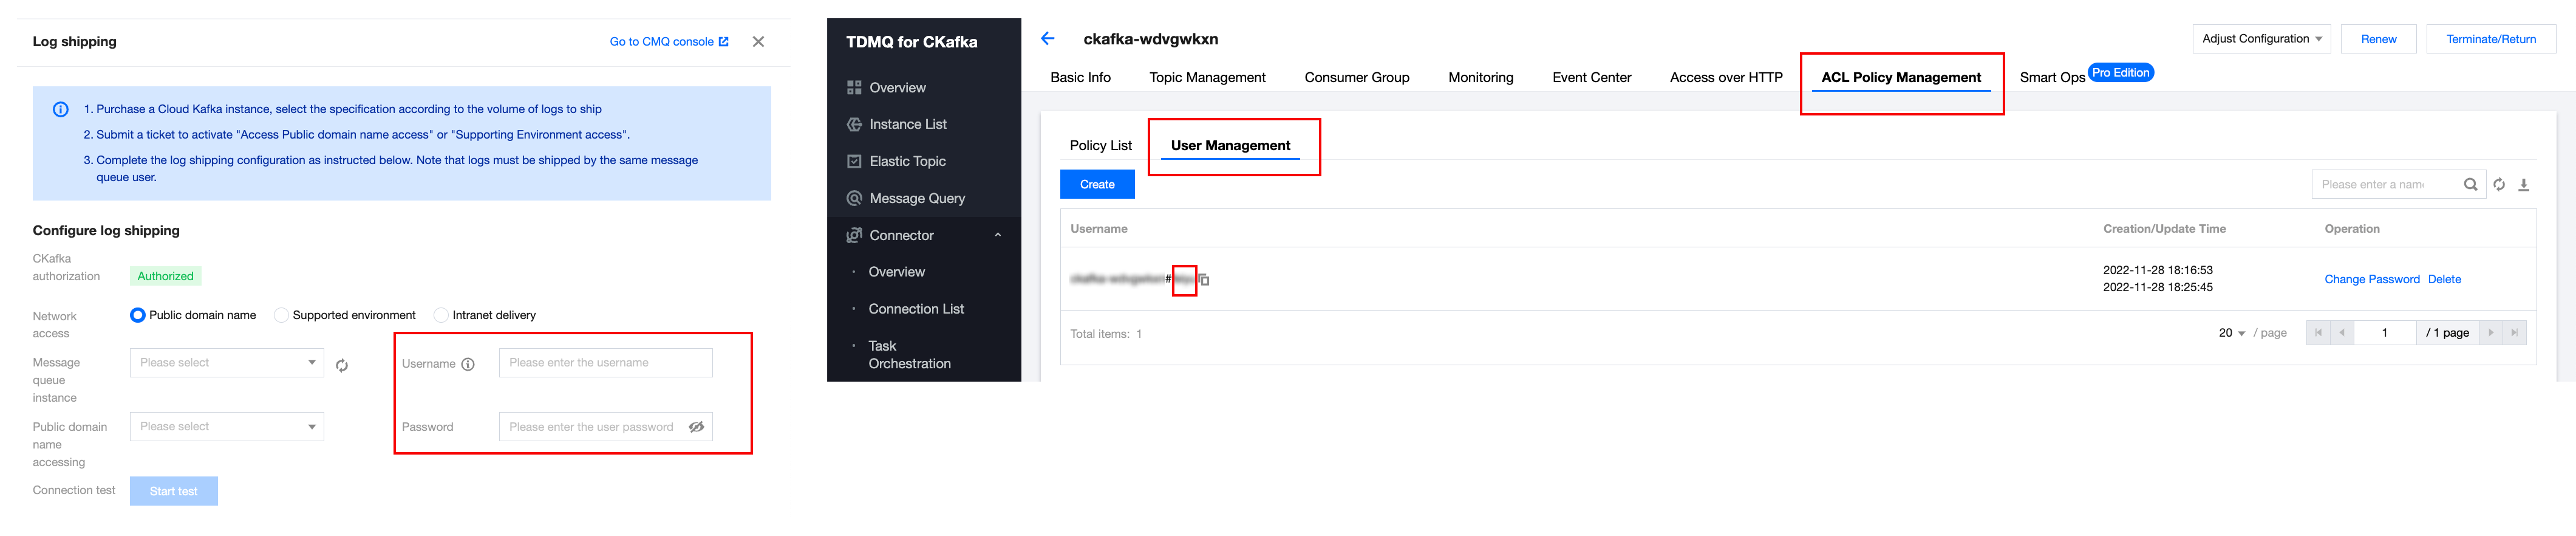
If the network access method is chosen as Public Domain Name Access or Supporting Environment Access, you also need to enter the CKafka instance's username and password. The username and password are listed under ACL Policy Management > User Management in the CKafka Instance List details. (When configuring log shipping, just enter the username after the # symbol. The CKafka instance ID before the # symbol is not required.)
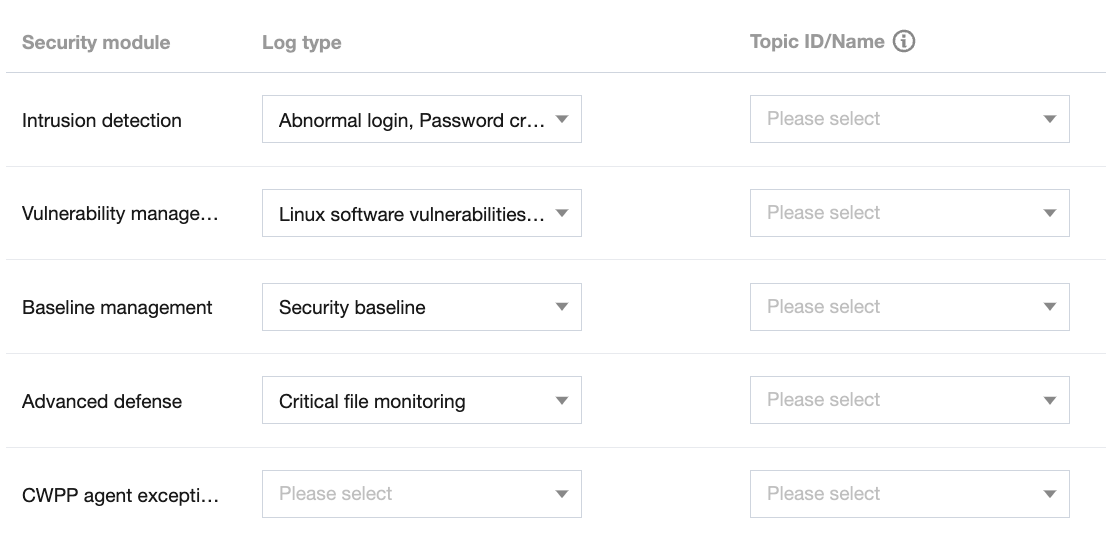
4. After completing the CKafka configuration, you can proceed with a connectivity test. Once the test passes, you can configure different topics for the logs you want to ship. (for log types not being shipped, choosing a Topic ID is not required).
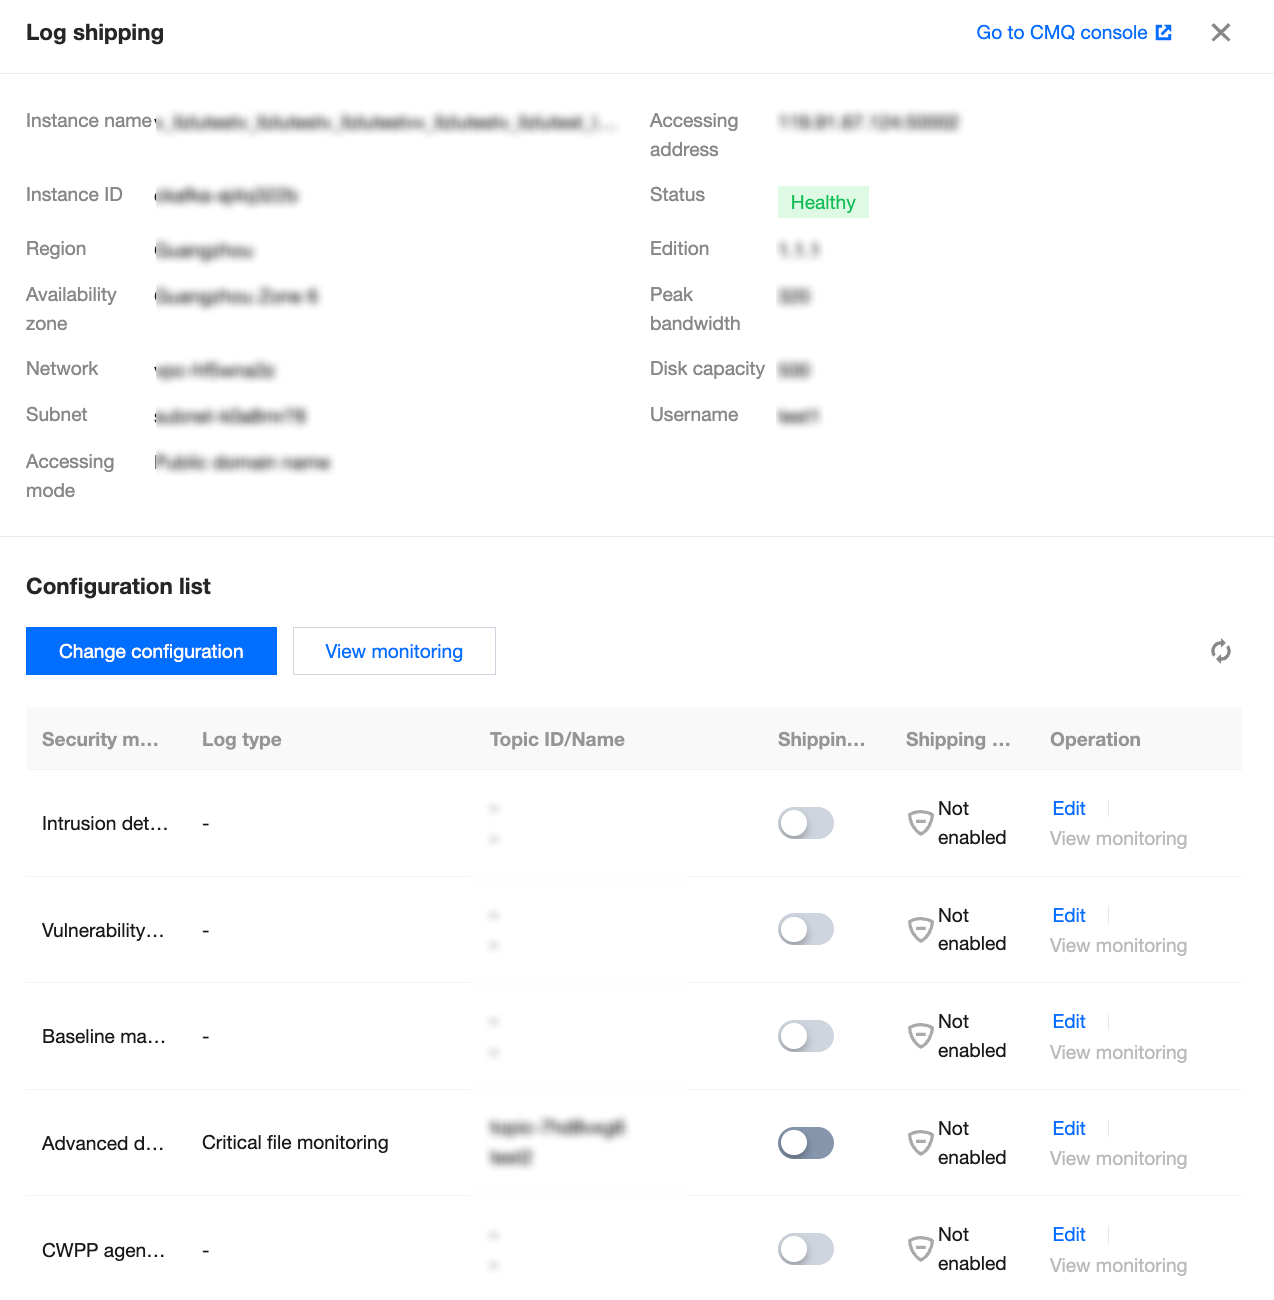
5. After completing the log shipping configuration, click Log Shipping again to view the details of the log shipping.
Basic Information: Displays the basic information of the CKafka instance.
Note:
You need to pay attention to the Status field. If it shows an alarm or abnormality, click View Monitoring to check if the CKafka service is abnormal, or if there is insufficient quota.
Shipping Switch: It is used to control a specified log type, and to start or stop log shipping tasks. You can control the log shipping tasks with the switch button in the Shipping Switch column.
Shipping Status: normal, abnormal (this status will suspend shipping), and disabled.
Edit: Click Edit to re-edit the log type and Topic ID for shipping.
View Monitoring: Click View Monitoring to navigate to the monitoring page of the TDMQ for CKafka console. In the console, you can view network traffic, peak bandwidth, number of messages, disk occupancy, etc.
Reconfiguration: At the top of the log shipping list, click Reconfiguration to return to the state after agreeing to the CKafka authorization service. You can reconfigure the TDMQ for CKafka instance, network access method, log type, Topic ID, etc.
Note:
Reconfiguration will interrupt the current shipping process.