- Release Notes and Announcements
- User Guide
- Product Introduction
- Purchase Guide
- Getting Started
- Operation Guide
- Resource Management
- Permission Management
- Log Collection
- Collection Overview
- Collecting Logs in Self-Built Kubernetes Cluster
- Collecting Syslog
- Collection by LogListener
- Collecting Text Log
- Uploading Log over Kafka
- Uploading Logs via Anonymous Write
- Uploading Logs via Logback Appender
- Uploading Logs via Log4j Appender
- Uploading Log via SDK
- Uploading Log via API
- Importing Data
- Tencent Cloud Service Log Access
- Log Storage
- Search and Analysis
- Syntax and Rules
- Statistical Analysis (SQL)
- Quick Analysis
- SQL Syntax
- SQL Functions
- String Function
- Date and Time Functions
- IP Geographic Function
- URL Function
- Mathematical Calculation Functions
- Mathematical Statistical Function
- General Aggregate Function
- Geospatial Function
- Binary String Function
- Estimation Function
- Type Conversion Function
- Logical Function
- Operators
- Bitwise Operation
- Regular Expression Function
- Lambda Function
- Conditional Expressions
- Array Functions
- Interval-Valued Comparison and Periodicity-Valued Comparison Functions
- JSON Functions
- Window Functions
- Sampling Analysis
- Configuring Indexes
- Reindexing
- Context Search and Analysis
- Downloading Log
- Dashboard
- Data Processing documents
- Data Processing
- Creating Processing Task
- Viewing Data Processing Details
- Data Processing Functions
- Function Overview
- Key-Value Extraction Functions
- Enrichment Functions
- Flow Control
- Row Processing Functions
- Field Processing Functions
- Value Structuring Functions
- Regular Expression Processing Functions
- Time Value Processing Functions
- String Processing Functions
- Type Conversion Functions
- Logical and Mathematical Functions
- Encoding and Decoding Functions
- IP Parsing Functions
- Processing Cases
- Scheduled SQL Analysis
- SCF
- Data Processing
- Shipping and Consumption
- Monitoring Alarm
- Historical Documentation
- Best Practices
- Developer Guide
- API Documentation
- History
- Introduction
- API Category
- Making API Requests
- Topic Management APIs
- Log Set Management APIs
- Index APIs
- Topic Partition APIs
- Machine Group APIs
- Collection Configuration APIs
- Log APIs
- Metric APIs
- Alarm Policy APIs
- Data Processing APIs
- Kafka Protocol Consumption APIs
- CKafka Shipping Task APIs
- Kafka Data Subscription APIs
- COS Shipping Task APIs
- SCF Delivery Task APIs
- Scheduled SQL Analysis APIs
- COS Data Import Task APIs
- Data Types
- Error Codes
- FAQs
- CLS Service Level Agreement
- CLS Policy
- Contact Us
- Glossary
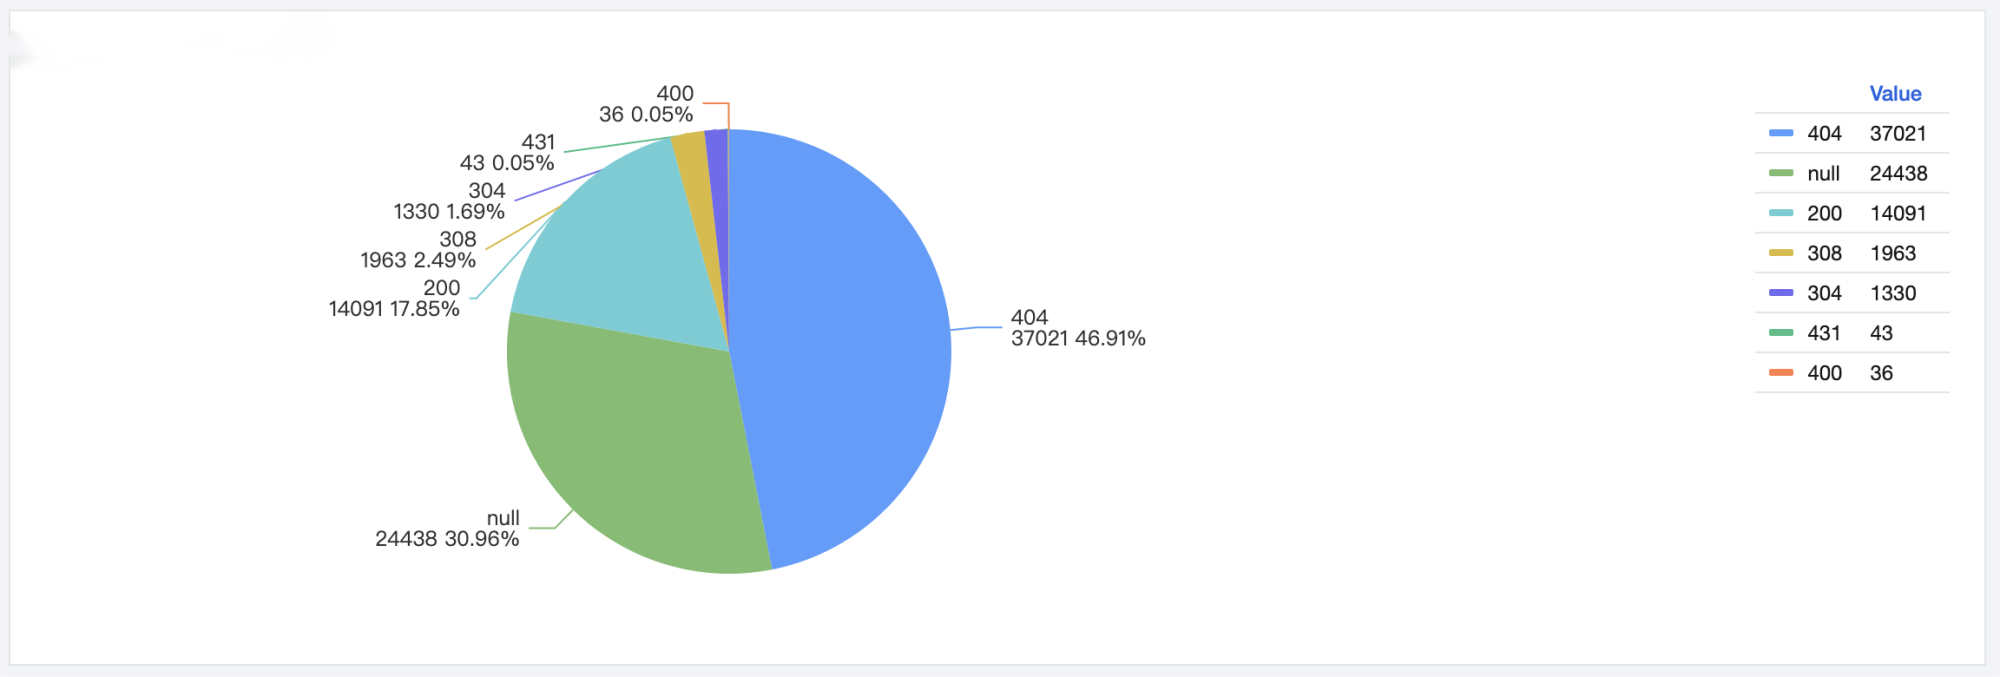
A pie chart describes the proportions of different types. It measures the proportion of each type by the slice size. It is suitable for proportion statistics scenarios, for example, analyzing the proportions of different error codes.
Chart Configuration
General configuration
Configuration Item | Description |
Basic information | Chart Name: Set the display name of the table, which can be left empty. |
Legend | Set the chart legends. You can control the legend styles and positions and add comparison data to legends. |
Standard configuration |
Pie chart configuration
Configuration Item | Description |
Pie chart | Display Mode: Control the pie chart style. A solid chart is a pie chart, and a hollow chart is a donut chart. Sort By: Control the slice sorting order, which can be ascending and descending. Sorting is disabled by default. Merge Slices: Merge slices other than top N slices into the "Others" slice. If there are too many slices, you can use this feature to focus on top N slices. Label: Display pie chart labels. You can set name, value, and/or percentage as tags. |
Label examples:

 はい
はい
 いいえ
いいえ
この記事はお役に立ちましたか?