The Cloud Load Balancer (CLB) determines the availability of real servers through health checks. If you encounter health check exceptions, you can refer to the following troubleshooting methods.
Note:
If an exception is detected during the health check, CLB will no longer forward traffic to the exceptional real server.
If exceptions are detected on all real servers during the health check, requests will be forwarded to all real servers.
1. Troubleshooting Instance Security Groups and ACL Interception
Note:
If the bypass security group is configured, this can be ignored.
Step 1: Viewing the Instance Health Detection Source IP
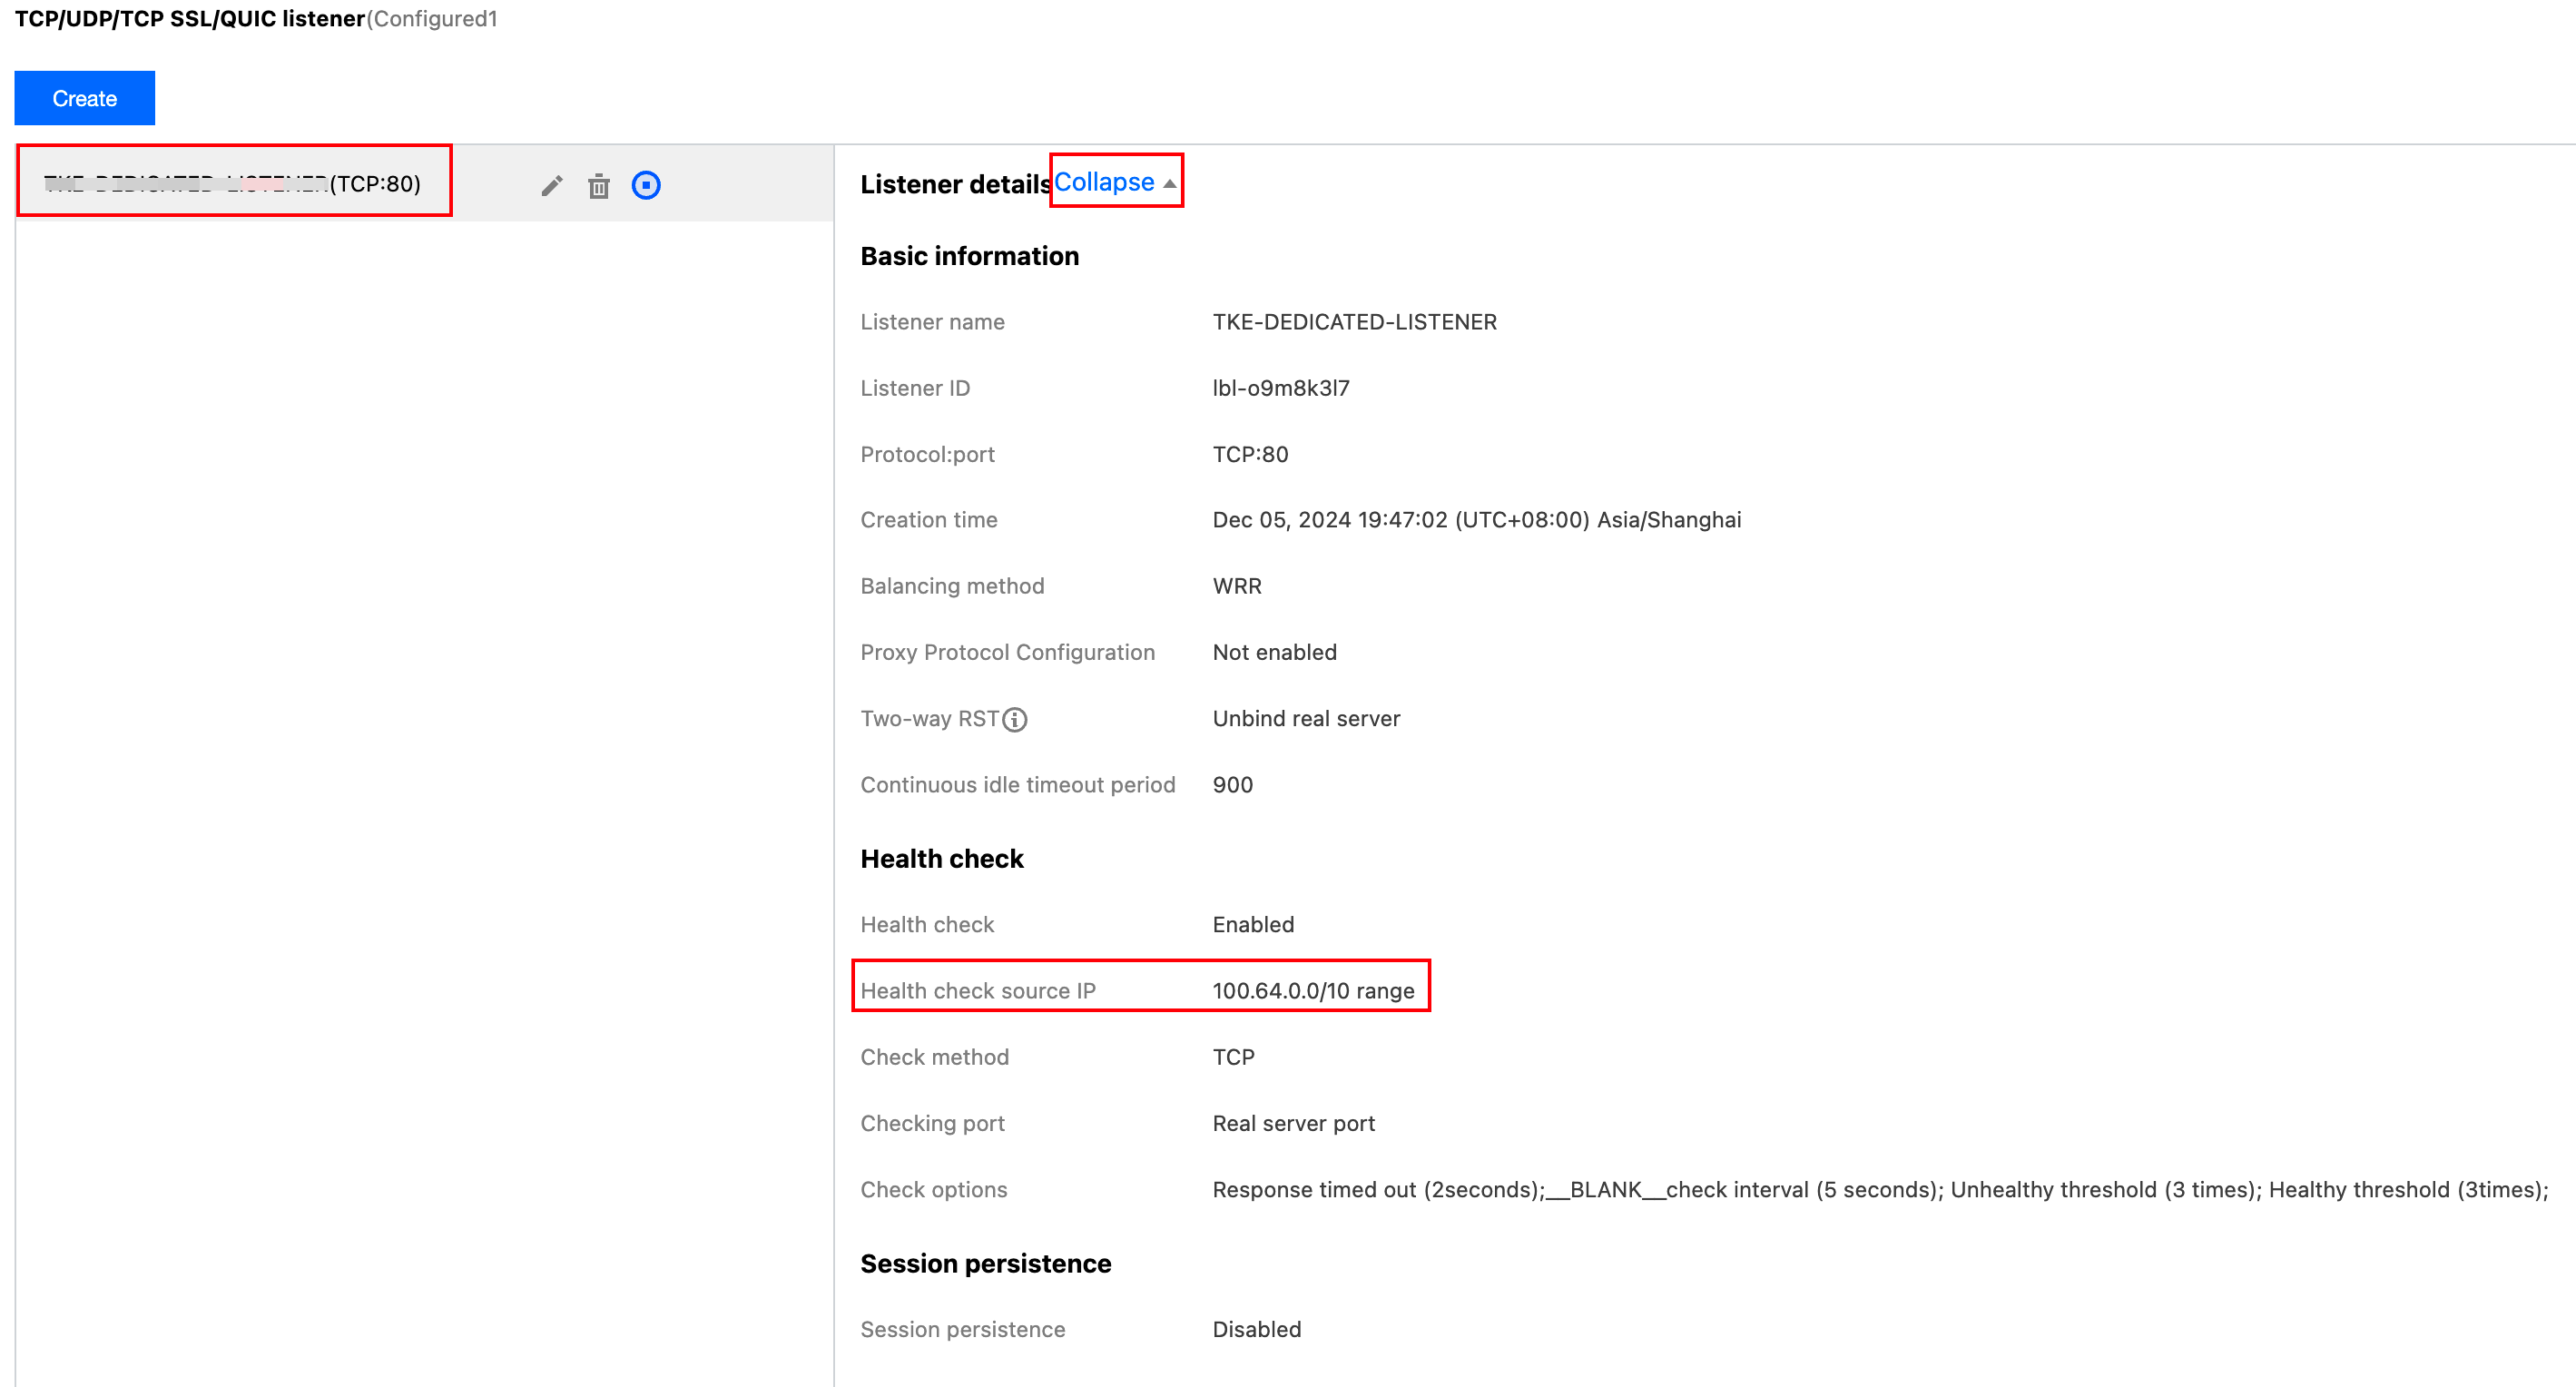
1. Log in to the CLB console and click the Instance ID of the instance for which you want to view the health detection source IP. 2. On the instance details page, click the Listener Management tab, click Listener, and then Expand the listener details on the right.
3. On the Listener Details page, you can view the current health check source IP. For example, the health check source IP is 100.64.0.0/10 IP range.
Step 2: Confirming the Security Group Bypass to the Health Detection Source IP
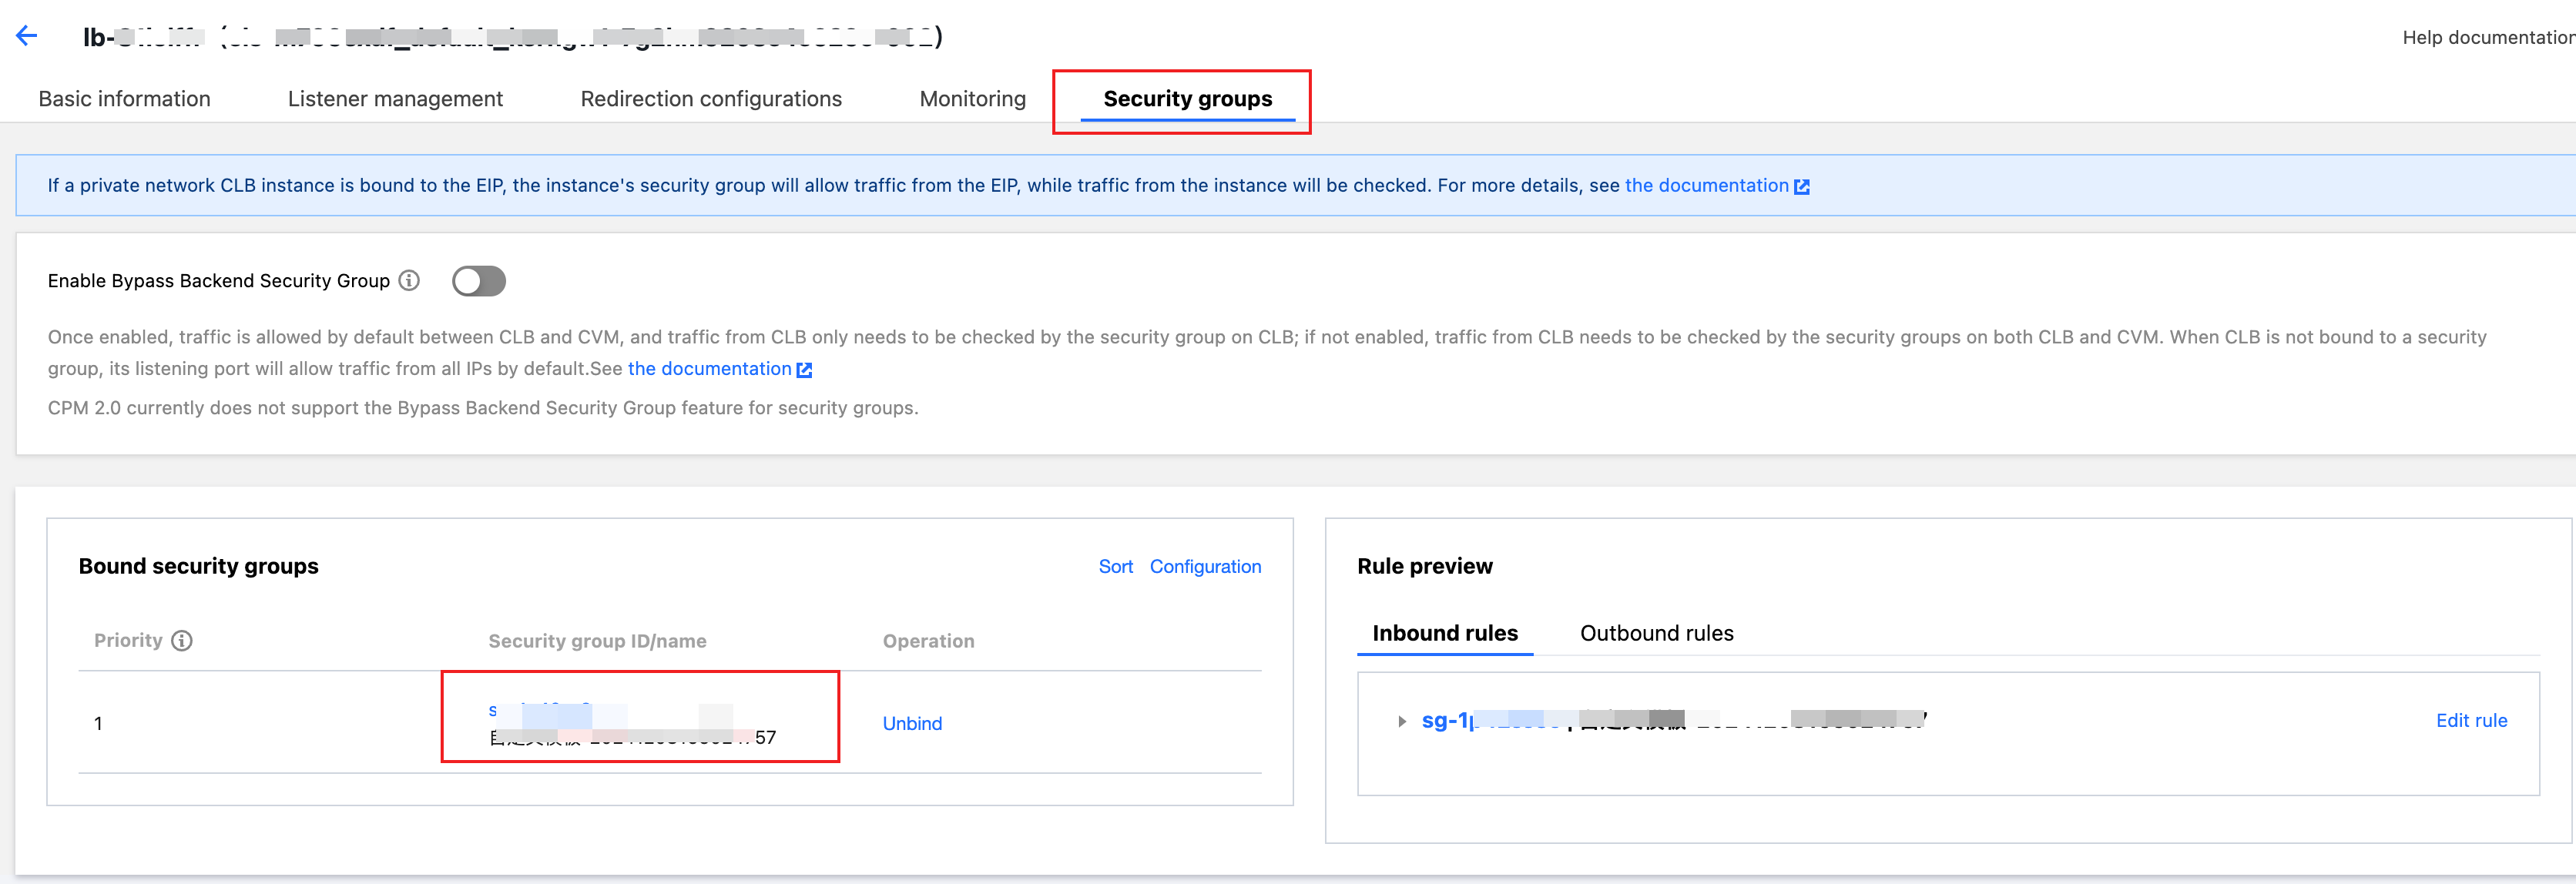
1. Log in to the CLB console and click the CLB Instance ID. 2. On the CLB example details page, click the Security Group tab > bound Security Group ID to enter the security group rules page.
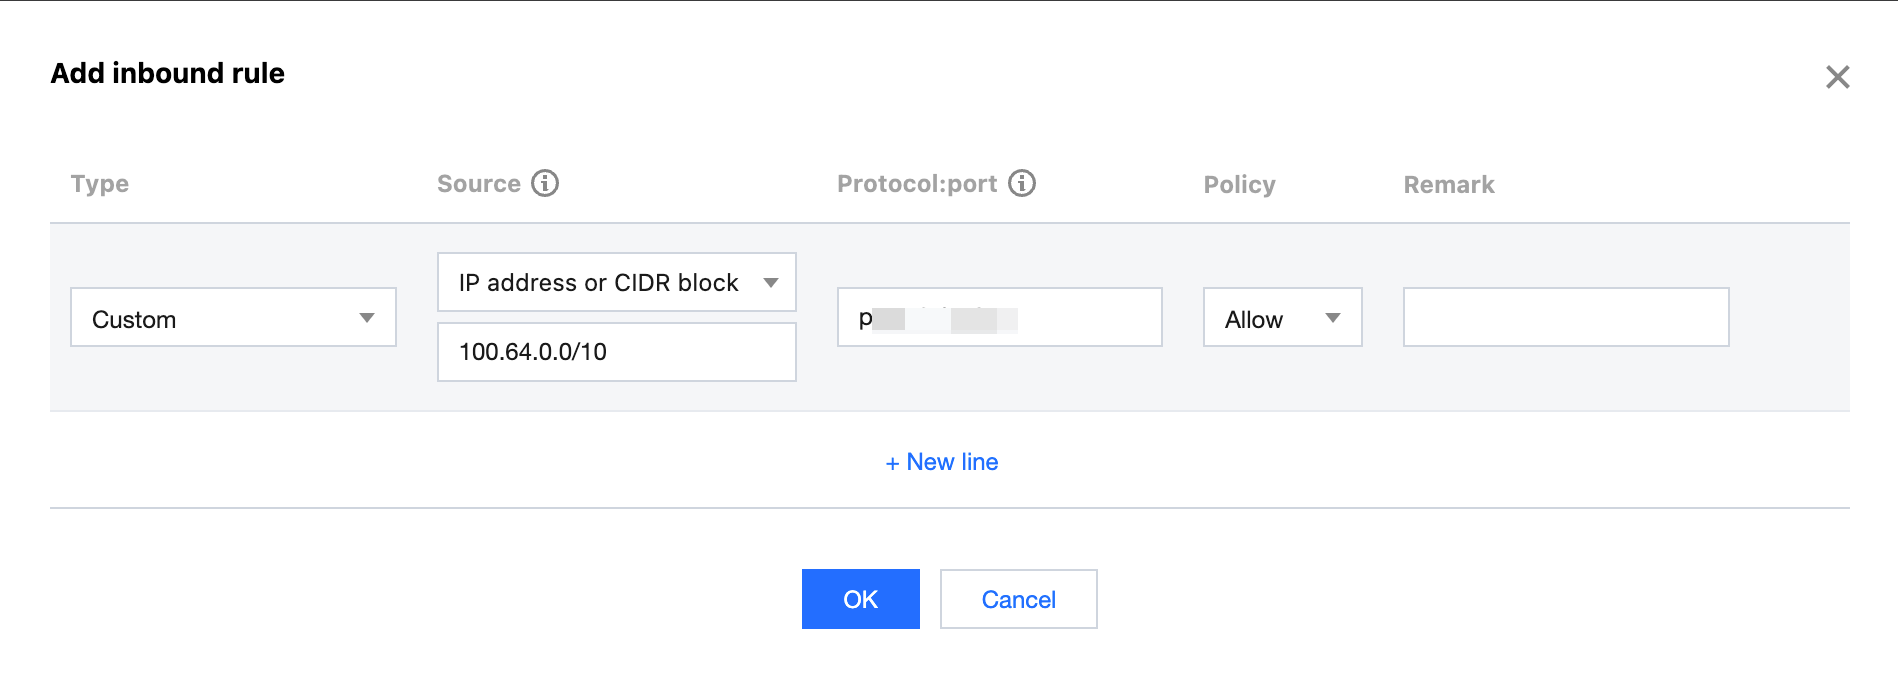
3. On the Inbound Rules tab, click Add Rule.
4. In the Add Inbound Rule pop-up window, enter the 100.64.0.0/10 IP range from View the instance health detection source IP in the Source field (if the health detection source IP confirmed in Step 1 is the CLB VIP, enter the VIP in the Source field), enter the protocol port used by the real server in the Protocol Port field, select Allow in the Policy field, and click Confirm to complete the addition. Step 3: Confirming the Network ACL of the Subnet Bypass to the Health Detection Source IP
1. Log in to the CVM console and click CVM Instances to enter the Basic Information page. 2. On the Basic Information page, click the Associated Subnet in the Network Information module to go to the Subnet Information page.
3. Click the ACL Rules tab, click the bound ACL on this page, and bypass to the health detection source IP in the Inbound Rules and Outbound Rules sections.
4. If the health detection source IP confirmed in Step 1 is the 100.64.0.0/10 IP range (or if the health detection source IP confirmed is a CLB VIP), enter it in the Source IP field, enter the protocol type selected in the health check method in the Protocol Type field, enter ALL in the Port field, select Allow in the Policy field, and click Save to complete the addition.
Note:
If the CLB is bound to COS, CDB, Redis, CKafka, or other public services, you need to check whether the security group bound to the service and the network ACL of the subnet bypass to the CLB health check source IP. You can refer to the above three steps for troubleshooting.
Step 4: Confirming IDC Bypass to the SNAT IP
If the user binds machines in the IDC as real servers for the CLB instance through the Cloud Connect Network (CCN) or Direct Connect products, it is necessary to confirm that the IDC bypasses to the SNAT IP.
1. Log in to the CLB console and click the CLB Instance ID. 2. On the instance basic information page, in the Real Server module, view the SNAT IP.
3. The user needs to check whether the firewall device or machine iptables in the IDC bypasses to the SNAT IP.
2. Troubleshooting the Cloud Virtual Machine (CVM)
If the real server is a CVM, you can follow the steps below for troubleshooting.
Step 1: Internal Machine Self-check
1. Log in to the CVM console, access the machine, and check the server processes and ports. Check the real server port corresponding to the CLB configuration. For example, use the check command for port 80.
netstat -anltu | grep -w 80
2. If the return indicates that port 80 is in listening status, you can rule out internal exceptions in the machine.
Note:
The listening address can only be 0.0.0.0 or the private network IP of the CVM. If the listening address is only 127.0.0.1, internal exceptions in the machine cannot be ruled out.
tcp 0 0 0.0.0.0:80 0.0.0.0:*
LISTEN 9/nginx: master pro
tcp6 0 0 :::80 :::*
LISTEN 9/nginx: master pro
Step 2: Checking If the CVM Can Return Normally
1. Use another machine in the same VPC to check if the HTTP/HTTPS port of the target CLB backend CVM returns normally.
For example, if the location directory configured in the CLB console is "/", check the HTTP port of the backend CVM's private network IP, taking IP 10.0.0.16 and port 80 as an example.
curl -I http://10.0.0.16:80/
2. Determining whether the response result is normal is based on the response status code configured in the console. For example, if the configured response status code is "200" or "404", the return result is normal, and this abnormal point can be ruled out.
HTTP/1.1 200 OK
Server: nginx/1.20.1
Date: Sat, 14 Sep 2024 07:07:01 GMT
Content-Type: text/html
HTTP/1.1 404 Not Found
Server: nginx/1.20.1
Date: Sat, 14 Sep 2024 07:08:51 GMT
Content-Type: text/html
Step 3: Checking If iptables Bypasses
1. For the check method, refer to Firewall issue. The check commands are as follows: 2. If it is confirmed to be intercepted, you need to add commands to bypass to the health detection source IP and the real server port configured in the CLB listener. Take the health detection source IP 100.64.0.0/10 and the real server ports 80 and 443 as an example.
iptables -A INPUT -p tcp -s 100.64.0.0/10 --dport 80 -j ACCEPT
iptables -A INPUT -p tcp -s 100.64.0.0/10 --dport 443 -j ACCEPT
iptables -A INPUT -p icmp -s 100.64.0.0/10 -j ACCEPT
Run the following commands based on different Linux distributions:
#Centos/RHEL:
sudo systemctl enable iptables
sudo service iptables save
#Ubuntu/Debian:
sudo systemctl enable netfilter-persistent
sudo netfilter-persistent save
3. After bypassing, you can rerun the check command for troubleshooting.
Note:
In scenarios where the backend protocol is HTTPS, it is recommended to modify it to HTTP in case of a health check exception.
Only when an HTTPS listener is configured on the CLB and the backend protocol is HTTPS, you need to configure the certificate on the real server.
3. Troubleshooting Containers
If the real server is a container, you can follow the steps below for troubleshooting, taking the binding of a TKE cluster as an example.
If the service has the annotation service.cloud.tencent.com/direct-access: "true", it is a direct access.
If the ingress has the annotation ingress.cloud.tencent.com/direct-access: "true", it is a direct access.
Step 1: CLB-to-Pod Direct Access Scenario
In the CLB-to-Pod direct access scenario, CLB traffic is forwarded directly to the backend pod.
The troubleshooting path is as follows:
1. Check the listening port within the container.
2. Check whether the container can access itself locally.
3. Check if accessing the pod from the node where the pod is located is normal.
If the pod is not running on a supernode, you can log in to the node and refer to Manual Testing. 4. Check internal configuration of the node.
4.1 Check ip_forward.
Enter the check command (if it is ipv6, replace ipv4 in the command with ipv6):
sysctl net.ipv4.ip_forward
Normal result:
Abnormal result:
Command to resolve the abnormal result:
sysctl -w "net.ipv4.ip_forward=1" && echo 'net.ipv4.ip_forward=1' >>/etc/sysctl.conf
4.2 Check ENI forward.
Enter the check command:
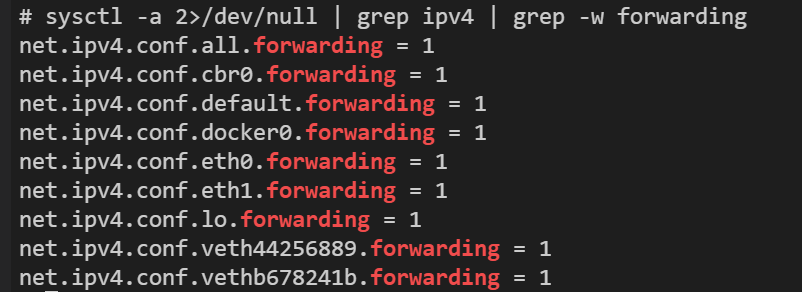
sysctl -a 2>/dev/null | grep ipv4 | grep -w forwarding
All parameter values in the normal result are 1, such as:
net.ipv4.conf.all.forwarding = 1
Complete example of the normal result:
There are parameter values of 0 in the abnormal result, such as:
net.ipv4.conf.all.forwarding = 0
Commands to process abnormal results, such as: (run the following commands based on the actual abnormal net.xxx.forwarding item)
sysctl -w net.ipv4.conf.all.forwarding=1
4.3 Check if the iptables of the node is intercepting forward.
Enter the check command:
The output is as follows:
The policy after the policy should be ACCEPT. If it is DROP, it may cause forward interception.
Only these four rules are allowed: KUBE-FORWARD, KUBE-SERVICES, KUBE-EXTERNAL-SERVICES, and DOCKER-USER. If there are other rules, it may cause forward interception.
Below are examples of normal results:
4.4 Check whether the security group bypasses.
If the pod is in vpc-cni mode, it is necessary to check whether the ENI security group of the node bypasses, otherwise it is necessary to check whether the security group of the node itself bypasses.
Step 2: CLB Non-direct Access Scenario
In the CLB non-direct access scenario, CLB traffic is first forwarded to the nodeport of a node in the cluster and then forwarded through iptables/ipvs to forward the traffic entering the nodeport to the actual backend pod, resulting in a long link.
Troubleshooting path:
1. Check contents related to the CLB-to-Pod direct access scenario.
Check contents related to the CLB-to-Pod direct access scenario and continue with the subsequent check steps based on this.
2. Check the security group of the node for Bypass.
Check whether the security group of the node and the security group of the pod in VPC-CNI mode bypass as per the following document: TKE Security Group Settings. 3. Check if the kube-proxy component on the unhealthy node is running properly.
The kube-proxy component is used for issuing iptables/ipvs rules. The check method is as follows:
# Get the kube-proxy pod on the node and check if it is ready.
kubectl get pod -n kube-system -l k8s-app=kube-proxy -owide | grep <Node Name>
# Check if there are any obvious errors in the kube-proxy running log.
kubectl logs -n kue-system <kube-proxy-xxxxx name>
4. Log in to the CLB backend node with the health check exception and access the backend pods one by one.
Supplementary Instructions on Manual Testing
Step 1: Checking the Port Listening Status
You can use netstat or ss commands to confirm the port listening status. If the return listening address is only 127.0.0.1, exceptions cannot be ruled out.
1. Use the netstat command to check if the port is in listening status. Take port 80 as an example:
The presence of the following output can be considered as a listening status:
tcp 0 0 0.0.0.0:80 0.0.0.0:*
LISTEN 9/nginx: master pro
tcp6 0 0 :::80 :::*
LISTEN 9/nginx: master pro
2. Use the ss command to check if the port is in listening status. Take port 80 as an example:
The presence of the following output can be considered as a listening status:
tcp LISTEN 0 511 *:80 *:*
users:(("nginx",pid=9,fd=6))
tcp LISTEN 0 511 [::]:80 [::]:*
users:(("nginx",pid=9,fd=8))
Step 2: Checking TCP Service Connectivity
You can check TCP service connectivity using the telnet command.
Note:
Do not use an older version of BusyBox's telnet for testing, as it will not echo whether the connection is successful or not.
Take checking port 80 of IP 172.16.1.29 as an example:
echo "" |telnet 172.16.1.29 80
Trying 172.16.1.29...
Connected to 172.16.1.29.
Escape character is '^]'.
Connection closed by foreign host.
Step 3: Checking HTTP/HTTPS Service Return
You can check the service's return HTTP status code using the curl command.
Take requesting protocol HTTP, method GET, domain name mydomain.com, path /health, port 8080, and IP 172.16.1.29 as an example.
curl -X GET -H "Host: mydomain.com" http://172.16.1.29:8080/health -s -o /dev/null -w "\\nhttpcode: %{http_code}\\n"
Response result:
If you choose the expected return 1xx-4xx in the normal status code configuration of the health check, the above response result of 404 is expected. If the return result does not meet the health check configuration expectations but is actually normal, it is recommended to adjust the expected configuration.
If the above issue troubleshooting still does not solve your issue, submit a ticket for processing.


