- Release Notes and Announcements
- User Tutorial
- Product Introduction
- Purchase Guide
- Getting Started
- Operation Guide
- Operation Overview
- Access Management
- SDK Connection
- Daily Instance Operation
- Viewing Instance Information
- Viewing Memcached Edition Instances
- Assigning Instance to Project
- Editing Instance Tag
- Setting Maintenance Time
- Changing Instance Specification
- Adjusting the Number of Connections
- Enabling/Disabling Read/Write Separation
- Clearing Instances
- Returning and Isolating Instance
- Restoring Isolated Instance
- Eliminating Instance
- Upgrading Redis Edition Instances
- Managing Redis Edition Nodes
- Multi-AZ Deployment Management
- Backup and Restoration
- Data Migration for Redis Edition Instances
- Migration Scheme Overview
- Migration with DTS
- Migrating with Redis-Port
- Version Upgrade with DTS
- Check on Migration from Standard Architecture to Cluster Architecture
- Migration Guide for Legacy Cluster Edition
- Pika-to-Redis Data Migration Scheme
- SSDB-to-Redis Data Migration Scheme
- Common Error Messages
- FAQs
- Migration with redis-port
- Account and Password (Redis Edition)
- Parameter Configuration
- Slow Query
- Network and Security
- Monitoring and Alarms
- Redis Edition Event Management
- Global Replication for Redis Edition
- Performance Optimization
- Sentinel Mode
- Development Guidelines
- Command Reference
- Troubleshooting
- Practical Tutorial
- API Documentation
- History
- Introduction
- API Category
- Making API Requests
- Instance APIs
- AddReplicationInstance
- AllocateWanAddress
- ChangeInstanceRole
- ChangeMasterInstance
- CleanUpInstance
- ClearInstance
- CloseSSL
- CreateInstanceAccount
- CreateReplicationGroup
- DeleteInstanceAccount
- DeleteReplicationInstance
- DescribeAutoBackupConfig
- DescribeBandwidthRange
- DescribeInstanceAccount
- DescribeInstanceDTSInfo
- DescribeInstanceZoneInfo
- DescribeInstances
- DescribeProxySlowLog
- DescribeSlowLog
- DescribeTendisSlowLog
- DestroyPostpaidInstance
- DestroyPrepaidInstance
- DisableReplicaReadonly
- EnableReplicaReadonly
- InquiryPriceCreateInstance
- InquiryPriceUpgradeInstance
- KillMasterGroup
- ModifyAutoBackupConfig
- ModifyInstance
- ModifyInstanceAccount
- ModifyInstanceReadOnly
- ModifyMaintenanceWindow
- ModifyNetworkConfig
- OpenSSL
- ReleaseWanAddress
- RenewInstance
- ResetPassword
- StartupInstance
- SwitchProxy
- UpgradeInstanceVersion
- UpgradeProxyVersion
- UpgradeSmallVersion
- UpgradeVersionToMultiAvailabilityZones
- DescribeCommonDBInstances
- ChangeReplicaToMaster
- CloneInstances
- CreateInstances
- DescribeInstanceDealDetail
- DescribeInstanceNodeInfo
- DescribeInstanceShards
- DescribeMaintenanceWindow
- DescribeParamTemplateInfo
- DescribeReplicationGroup
- DescribeSSLStatus
- DescribeTaskInfo
- DescribeTaskList
- ModifyInstancePassword
- RemoveReplicationInstance
- UpgradeInstance
- DescribeInstanceEvents
- DescribeReplicationGroupInstance
- ModifyInstanceAvailabilityZones
- ModifyInstanceEvent
- ModifyReplicationGroup
- SwitchAccessNewInstance
- DescribeInstanceSupportFeature
- Parameter Management APIs
- Other APIs
- Backup and Restoration APIs
- Region APIs
- Monitoring and Management APIs
- Log APIs
- Data Types
- Error Codes
- FAQs
- Service Agreement
- Glossary
- Contact Us
Feature Overview
The command word analysis feature analyzes the number and latency of database access commands statistically. Latency analysis makes it simple to identify the command that is used the most frequently, and command word analysis helps you further identify when it is most frequently executed as well as its execution latency, which facilitates troubleshooting and performance optimization.
Viewing Command Word Analysis
1. Log in to the TencentDB for Redis® console.
2. On the left sidebar, select Performance Optimization.
3. At the top of the Performance Optimization page of DBbrain, select the target instance in the Instance ID drop-down list.


4. Select the Latency Analysis > Command Word Analysis tab and set the collection granularity to 5s, 15s, or 30s as needed in the drop-down list next to Auto-Refresh in the top-right corner.


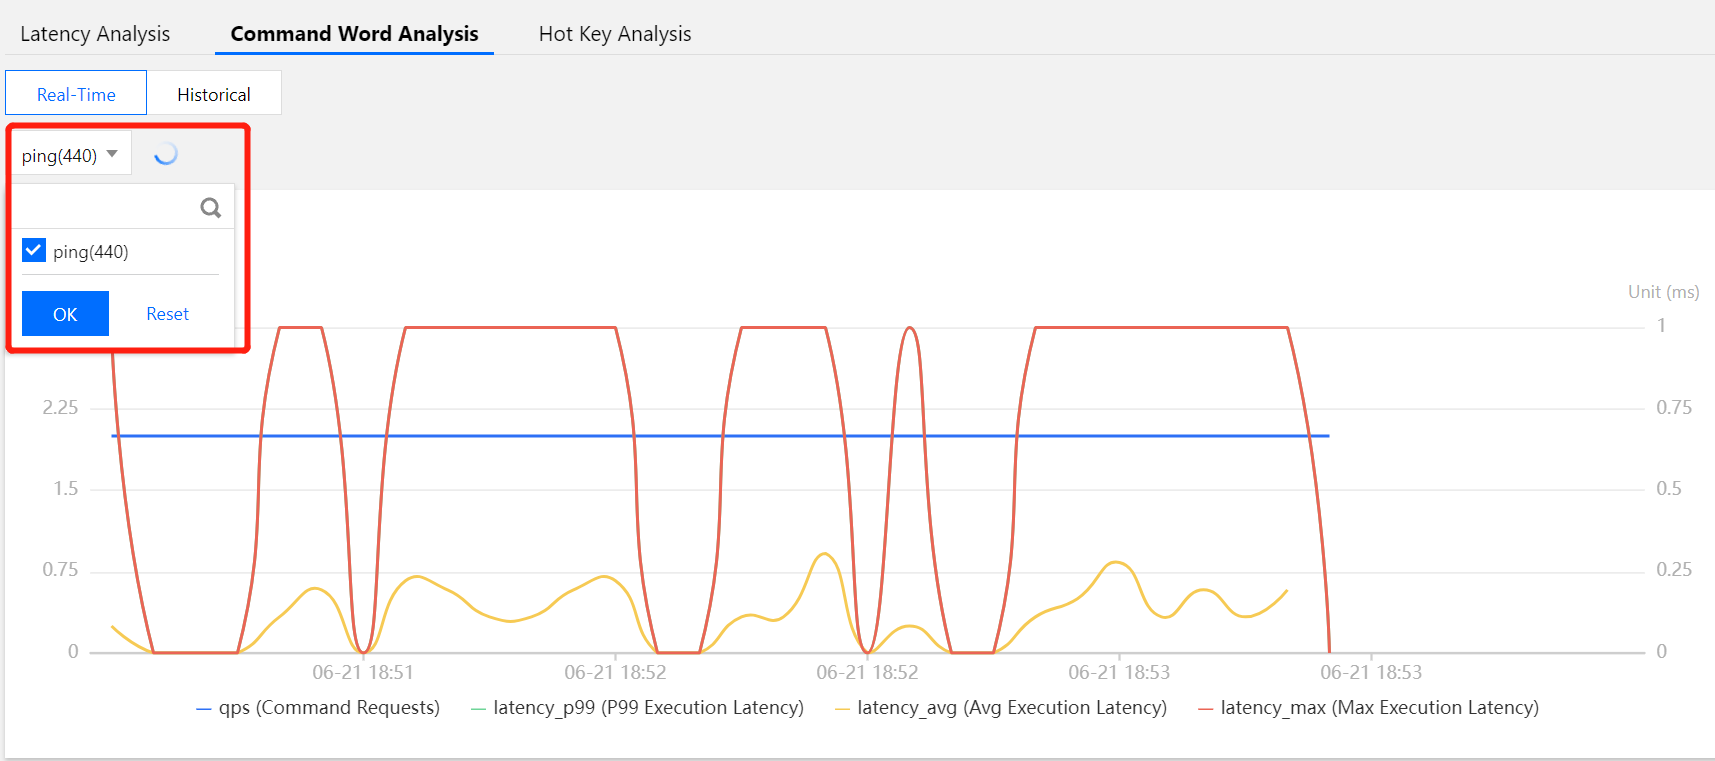
5. (Optional) Quickly filter target command words in the drop-down list in the top-left corner.


6. Analyze the trend data of the command words.
Real-time statistics
Real-time statistics are displayed by default, including the change trends of command requests, P99 execution latency, average execution latency, and max execution latency. For more information on metrics, see Performance Trends.


Historical data
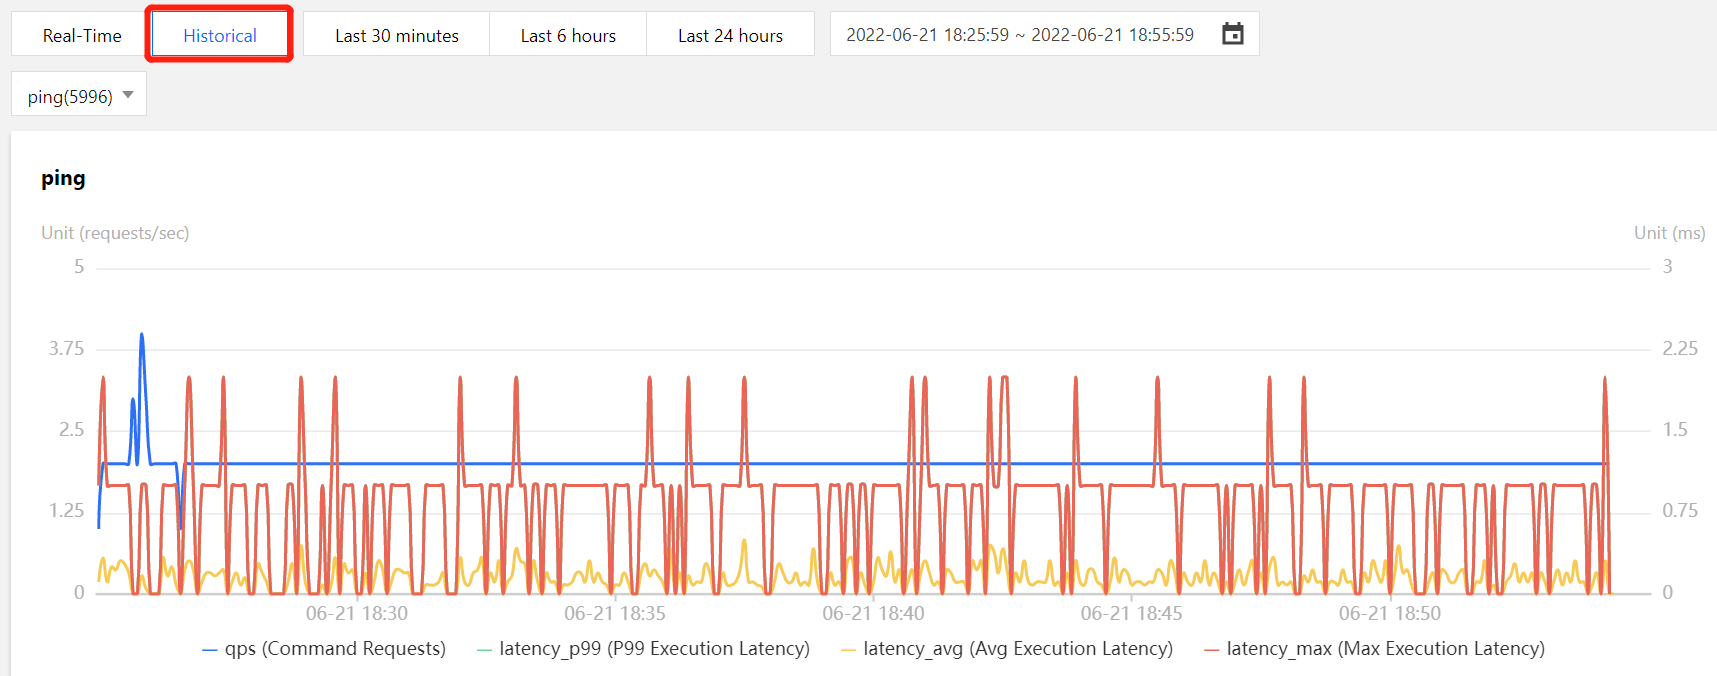
Click Historical to view the statistics in the last 30 minutes, 6 hours, or 24 hours. You can also click 


 はい
はい
 いいえ
いいえ
この記事はお役に立ちましたか?