Overview
The monitoring management page displays the basic operation overview and reported error statistics for integration apps, flows, connectors, and components. On this page, you can view the real-time and historical monitoring data of a flow in a certain period of time.
For the descriptions of monitoring metric parameters, see Monitoring Metric Description.
Note:Currently, iPaaS monitoring management is categorized by project. To view the monitoring data, select a project first.
Directions
Monitoring management
You can view the real-time and historical monitoring data and analyze the flow execution based on the data. The monitoring overview of the integration app in the last 24 hours is displayed by default. To view the historical data, you can customize the time period, select an app or flow, and click Search.
Note:Currently, you can search for the monitoring data in the last seven days in the console. To search for earlier data, please submit a ticket for assistance.
Querying integration app overview data
- Log in to the iPaaS console and select Monitoring > Overview.
- On the Overview tab, All flows is selected by default, that is, the app overview data is displayed by default. You can view metrics such as the number of app triggers, executions, and alarms, app execution duration in milliseconds, and app traffic usage in KB.
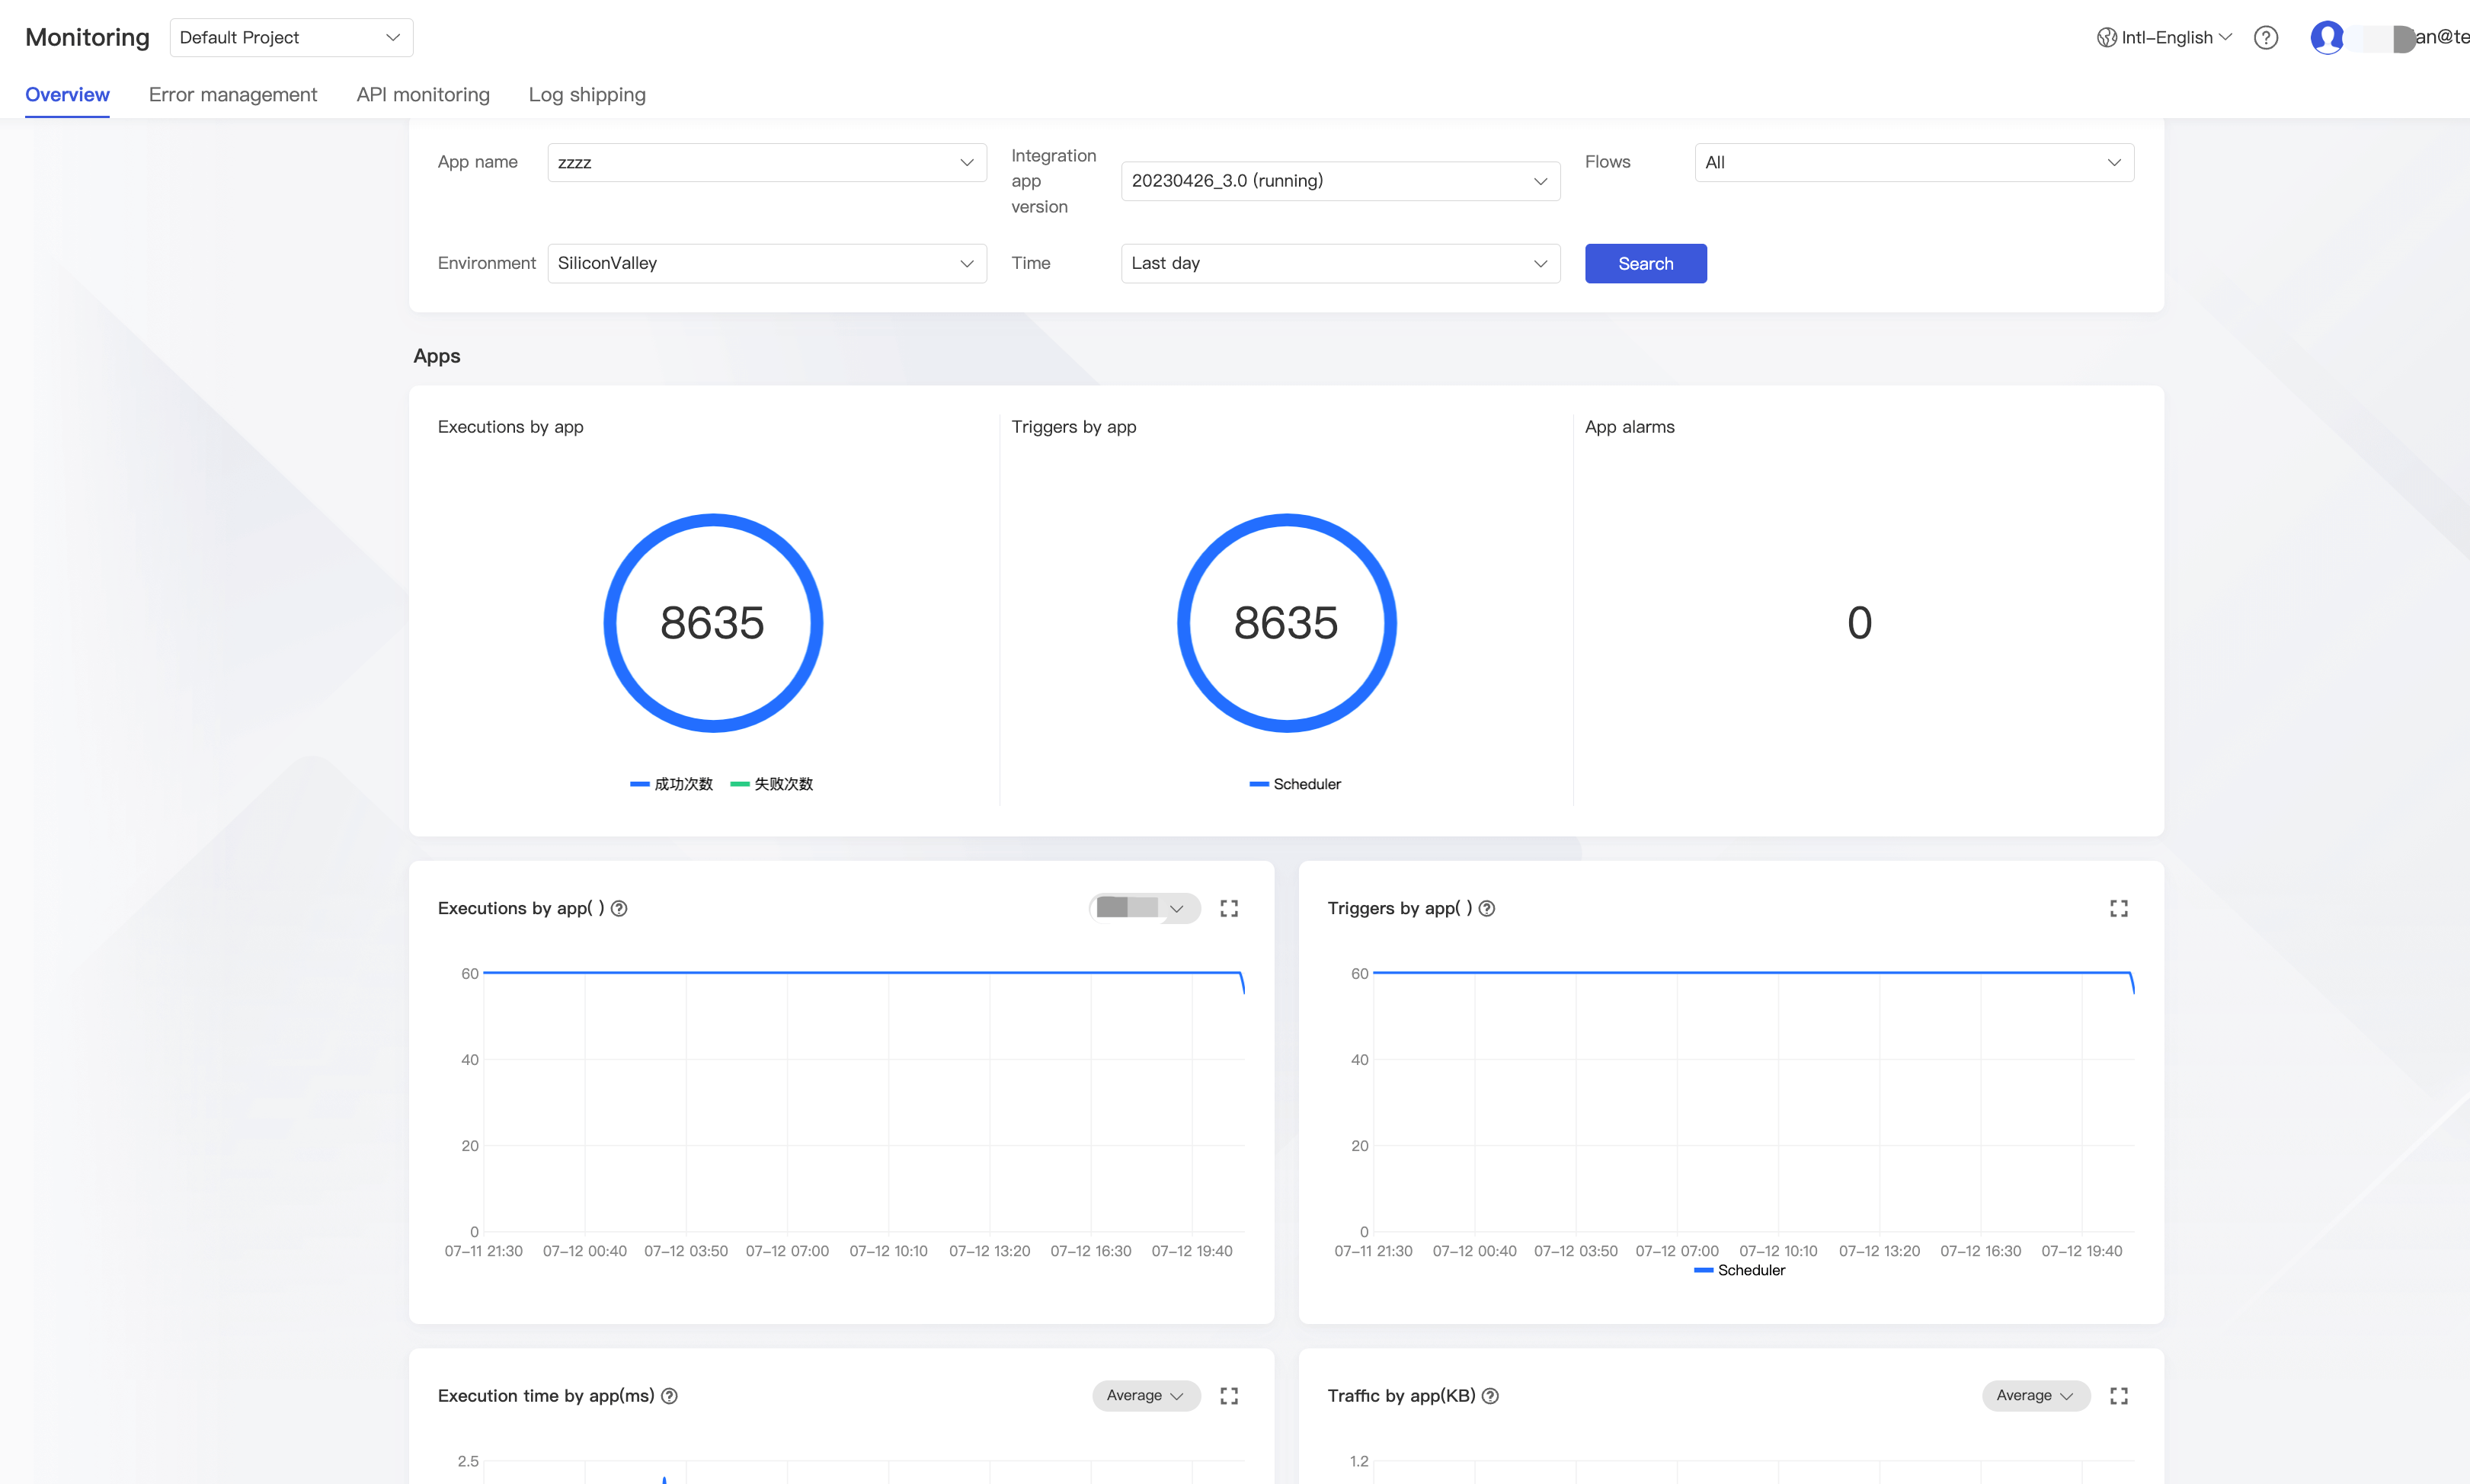
Description of app monitoring data search: You can search by app name, version, flow (All flows must be selected), runtime environment, and time.
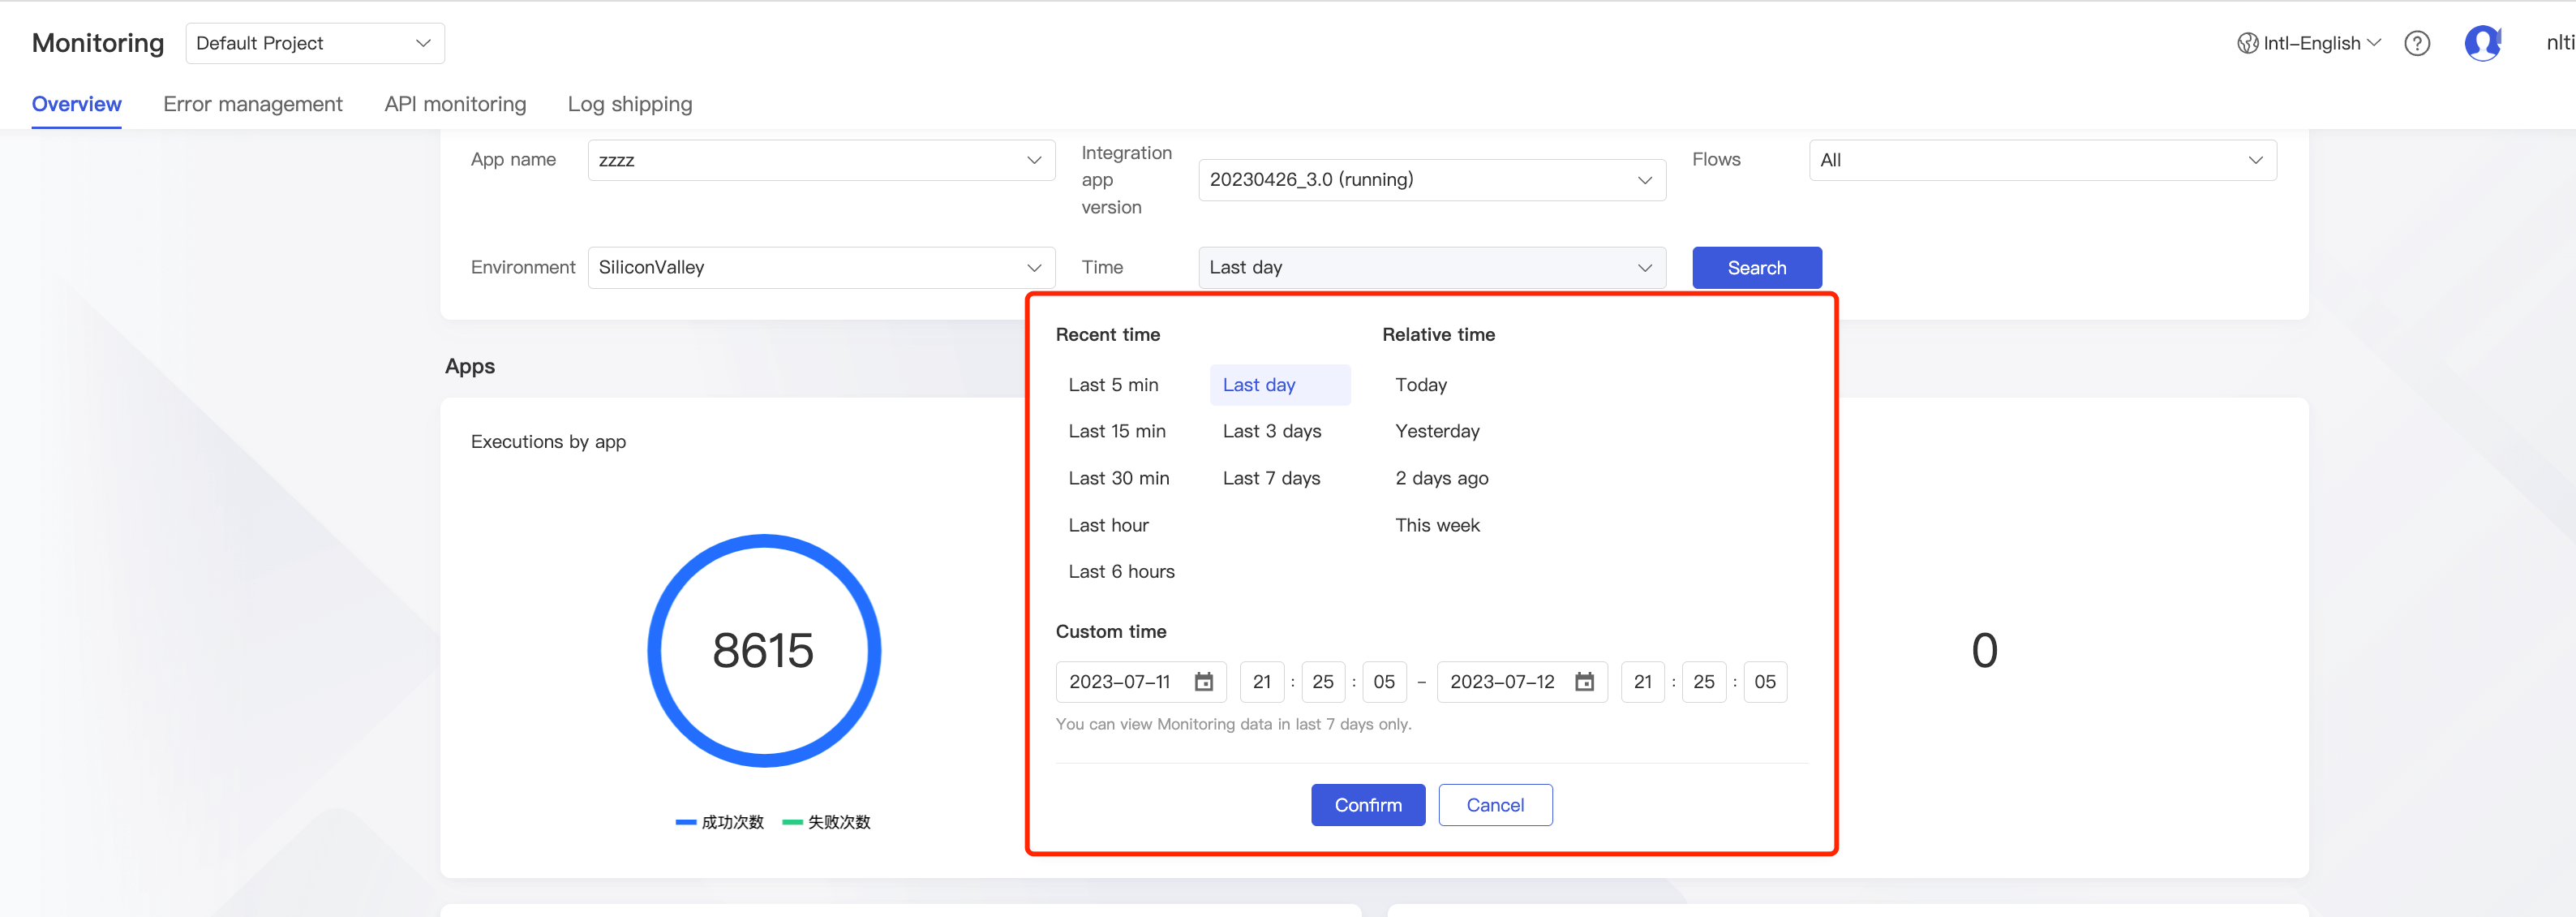
Click the time drop-down list, and the panel for setting the time period for search will be displayed. You can select the last 5 minutes, last 15 minutes, last hour, last 6 hours, last day, last 3 days, last 7 days, today, yesterday, 2 days ago, this week, or a custom time period. You can preset a frequently used time period to quickly filter the monitoring data within it.
Querying flow data
- Log in to the iPaaS console and select Monitoring > Overview.
- On the Overview tab, select a flow of the integration app to query the flow and connector overview data.
- Flow overview: You can view flow metrics such as numbers of flow executions (including the total number of executions, number of successful executions, and number of failed executions), flow execution duration in milliseconds, and flow traffic usage in KB.
- Connector overview: You can view connector metrics of a flow such as numbers of connector executions (including the total number of executions, number of successful executions, and number of failed executions), connector execution duration in milliseconds, and connector traffic in KB.
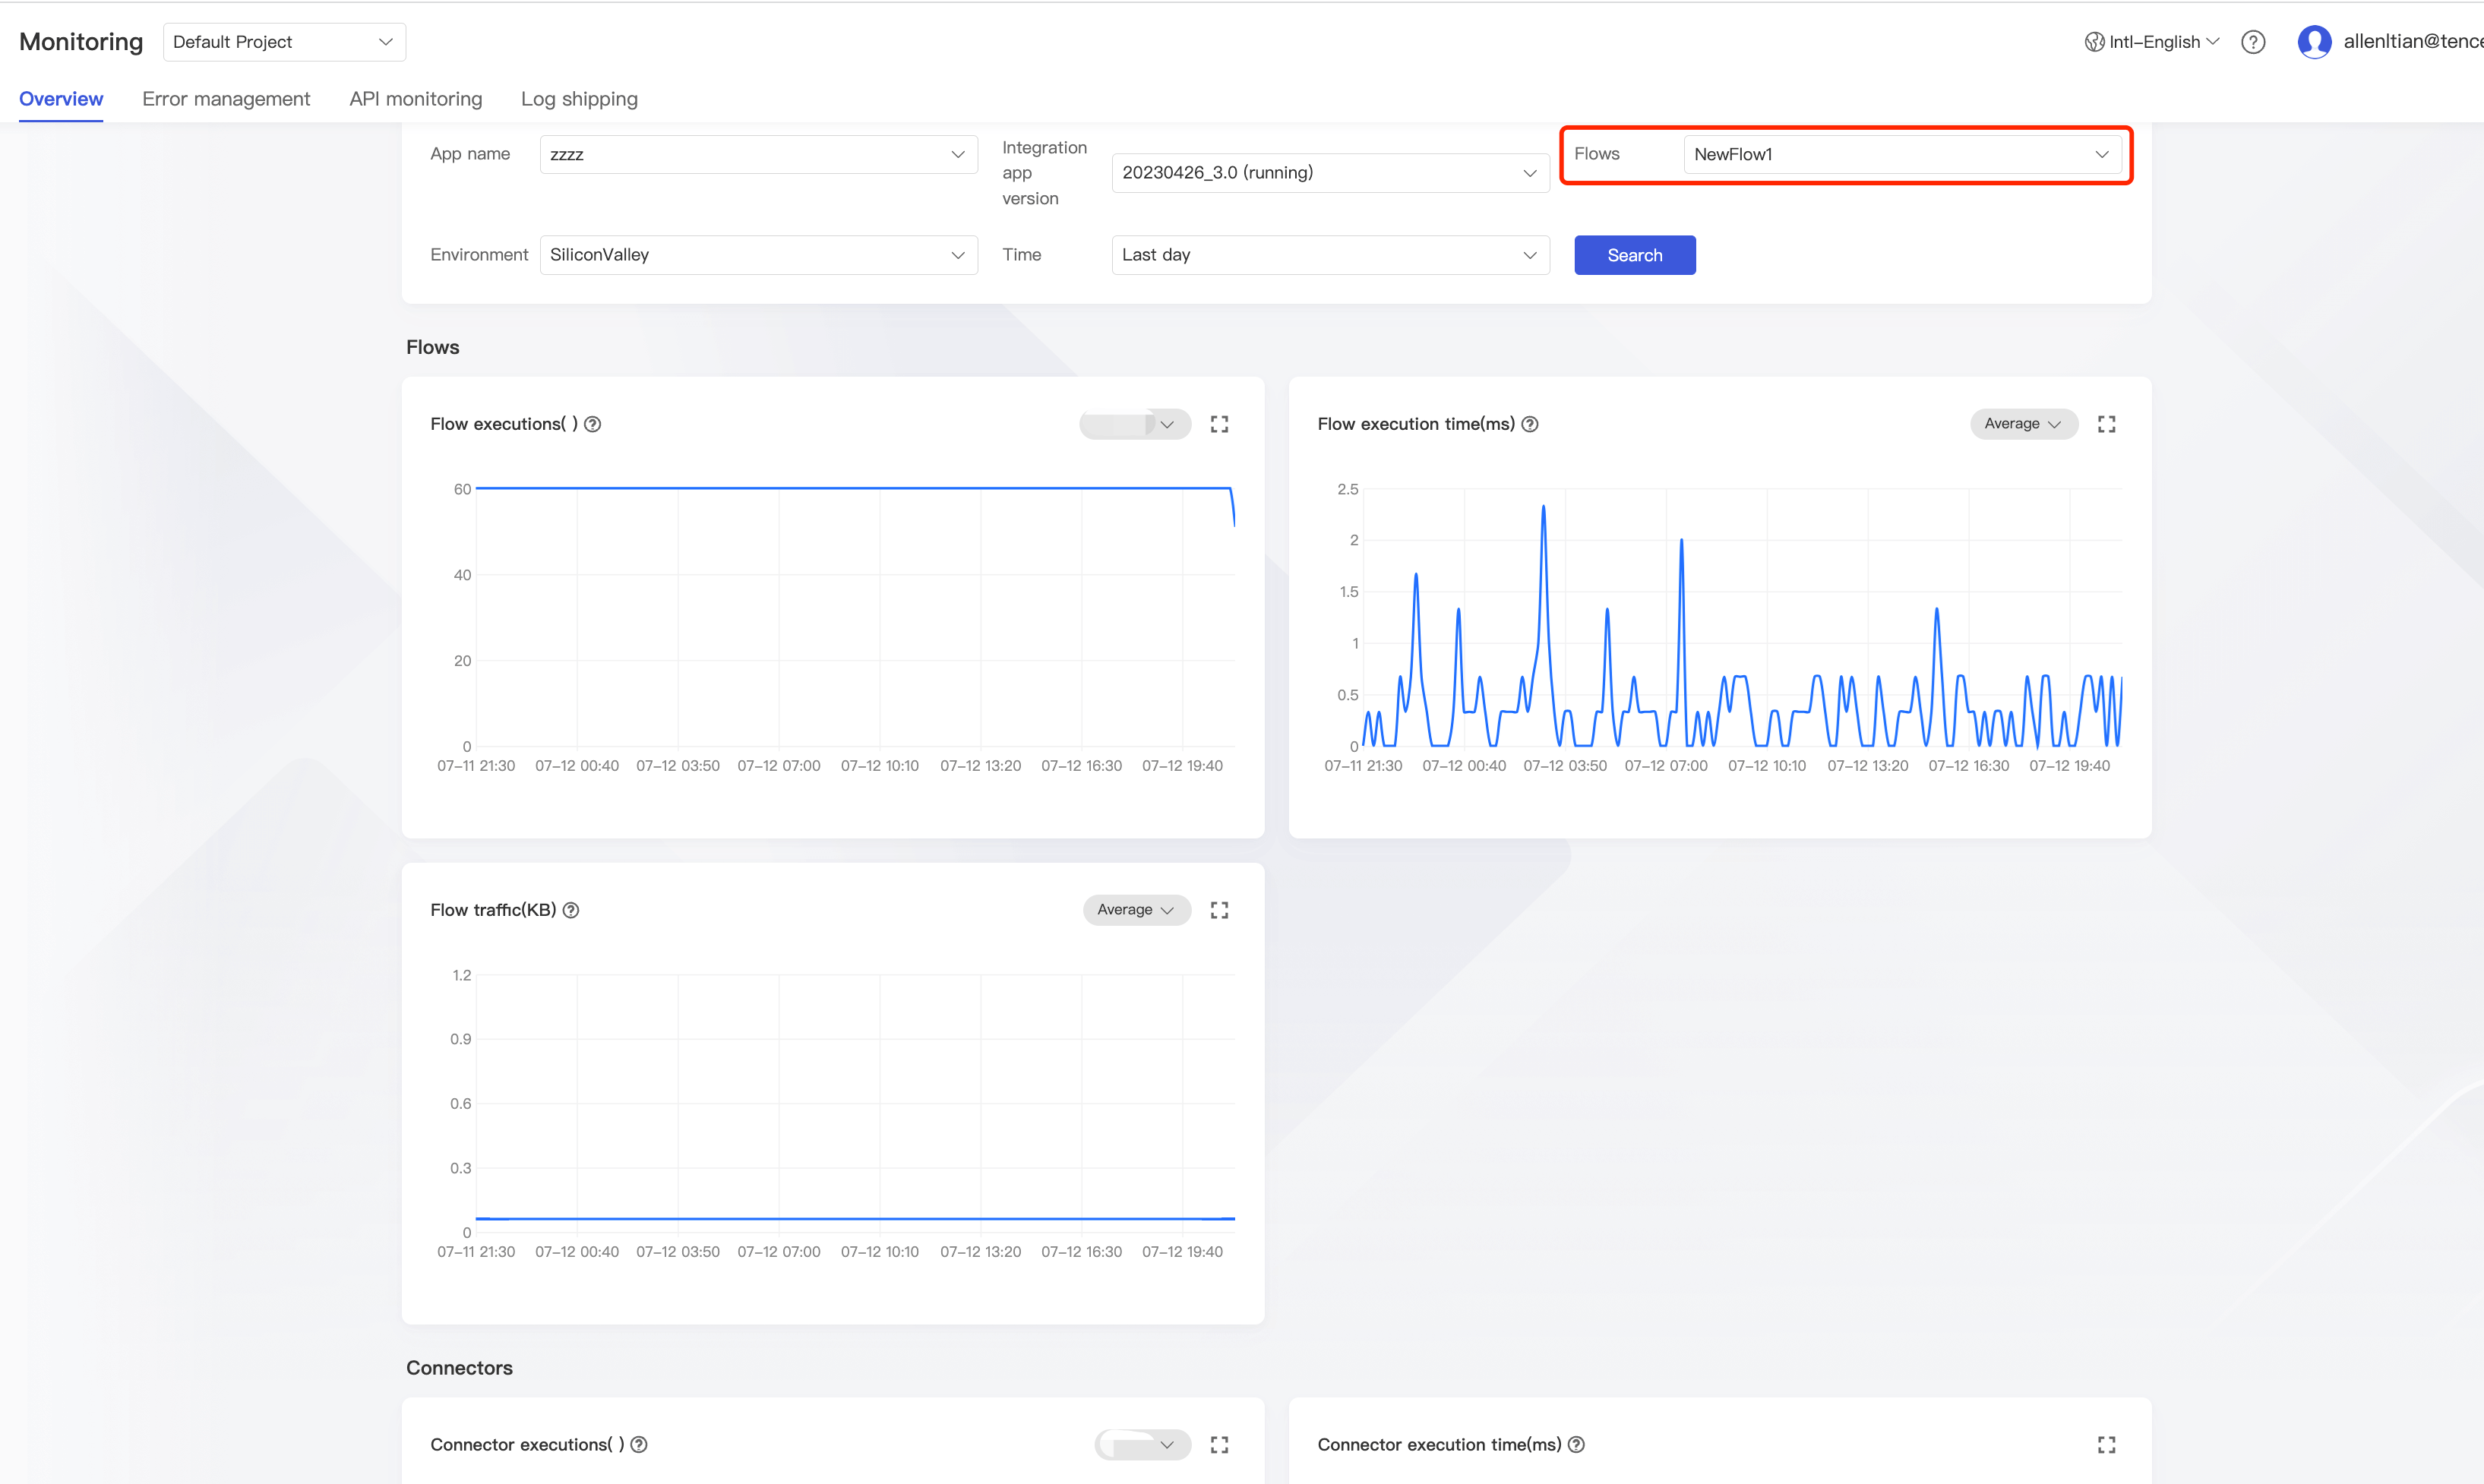
Description of flow monitoring data search: You can search by project, app, version, flow (required), region, and time to view the flow and connector overview of the specified flow.
Click the time drop-down list, and the panel for setting the time period for search will be displayed. You can select the last 5 minutes, last 15 minutes, last hour, last 6 hours, last day, last 3 days, last 7 days, today, yesterday, 2 days ago, this week, or a custom time period. You can preset a frequently used time period to quickly filter the monitoring data within that period.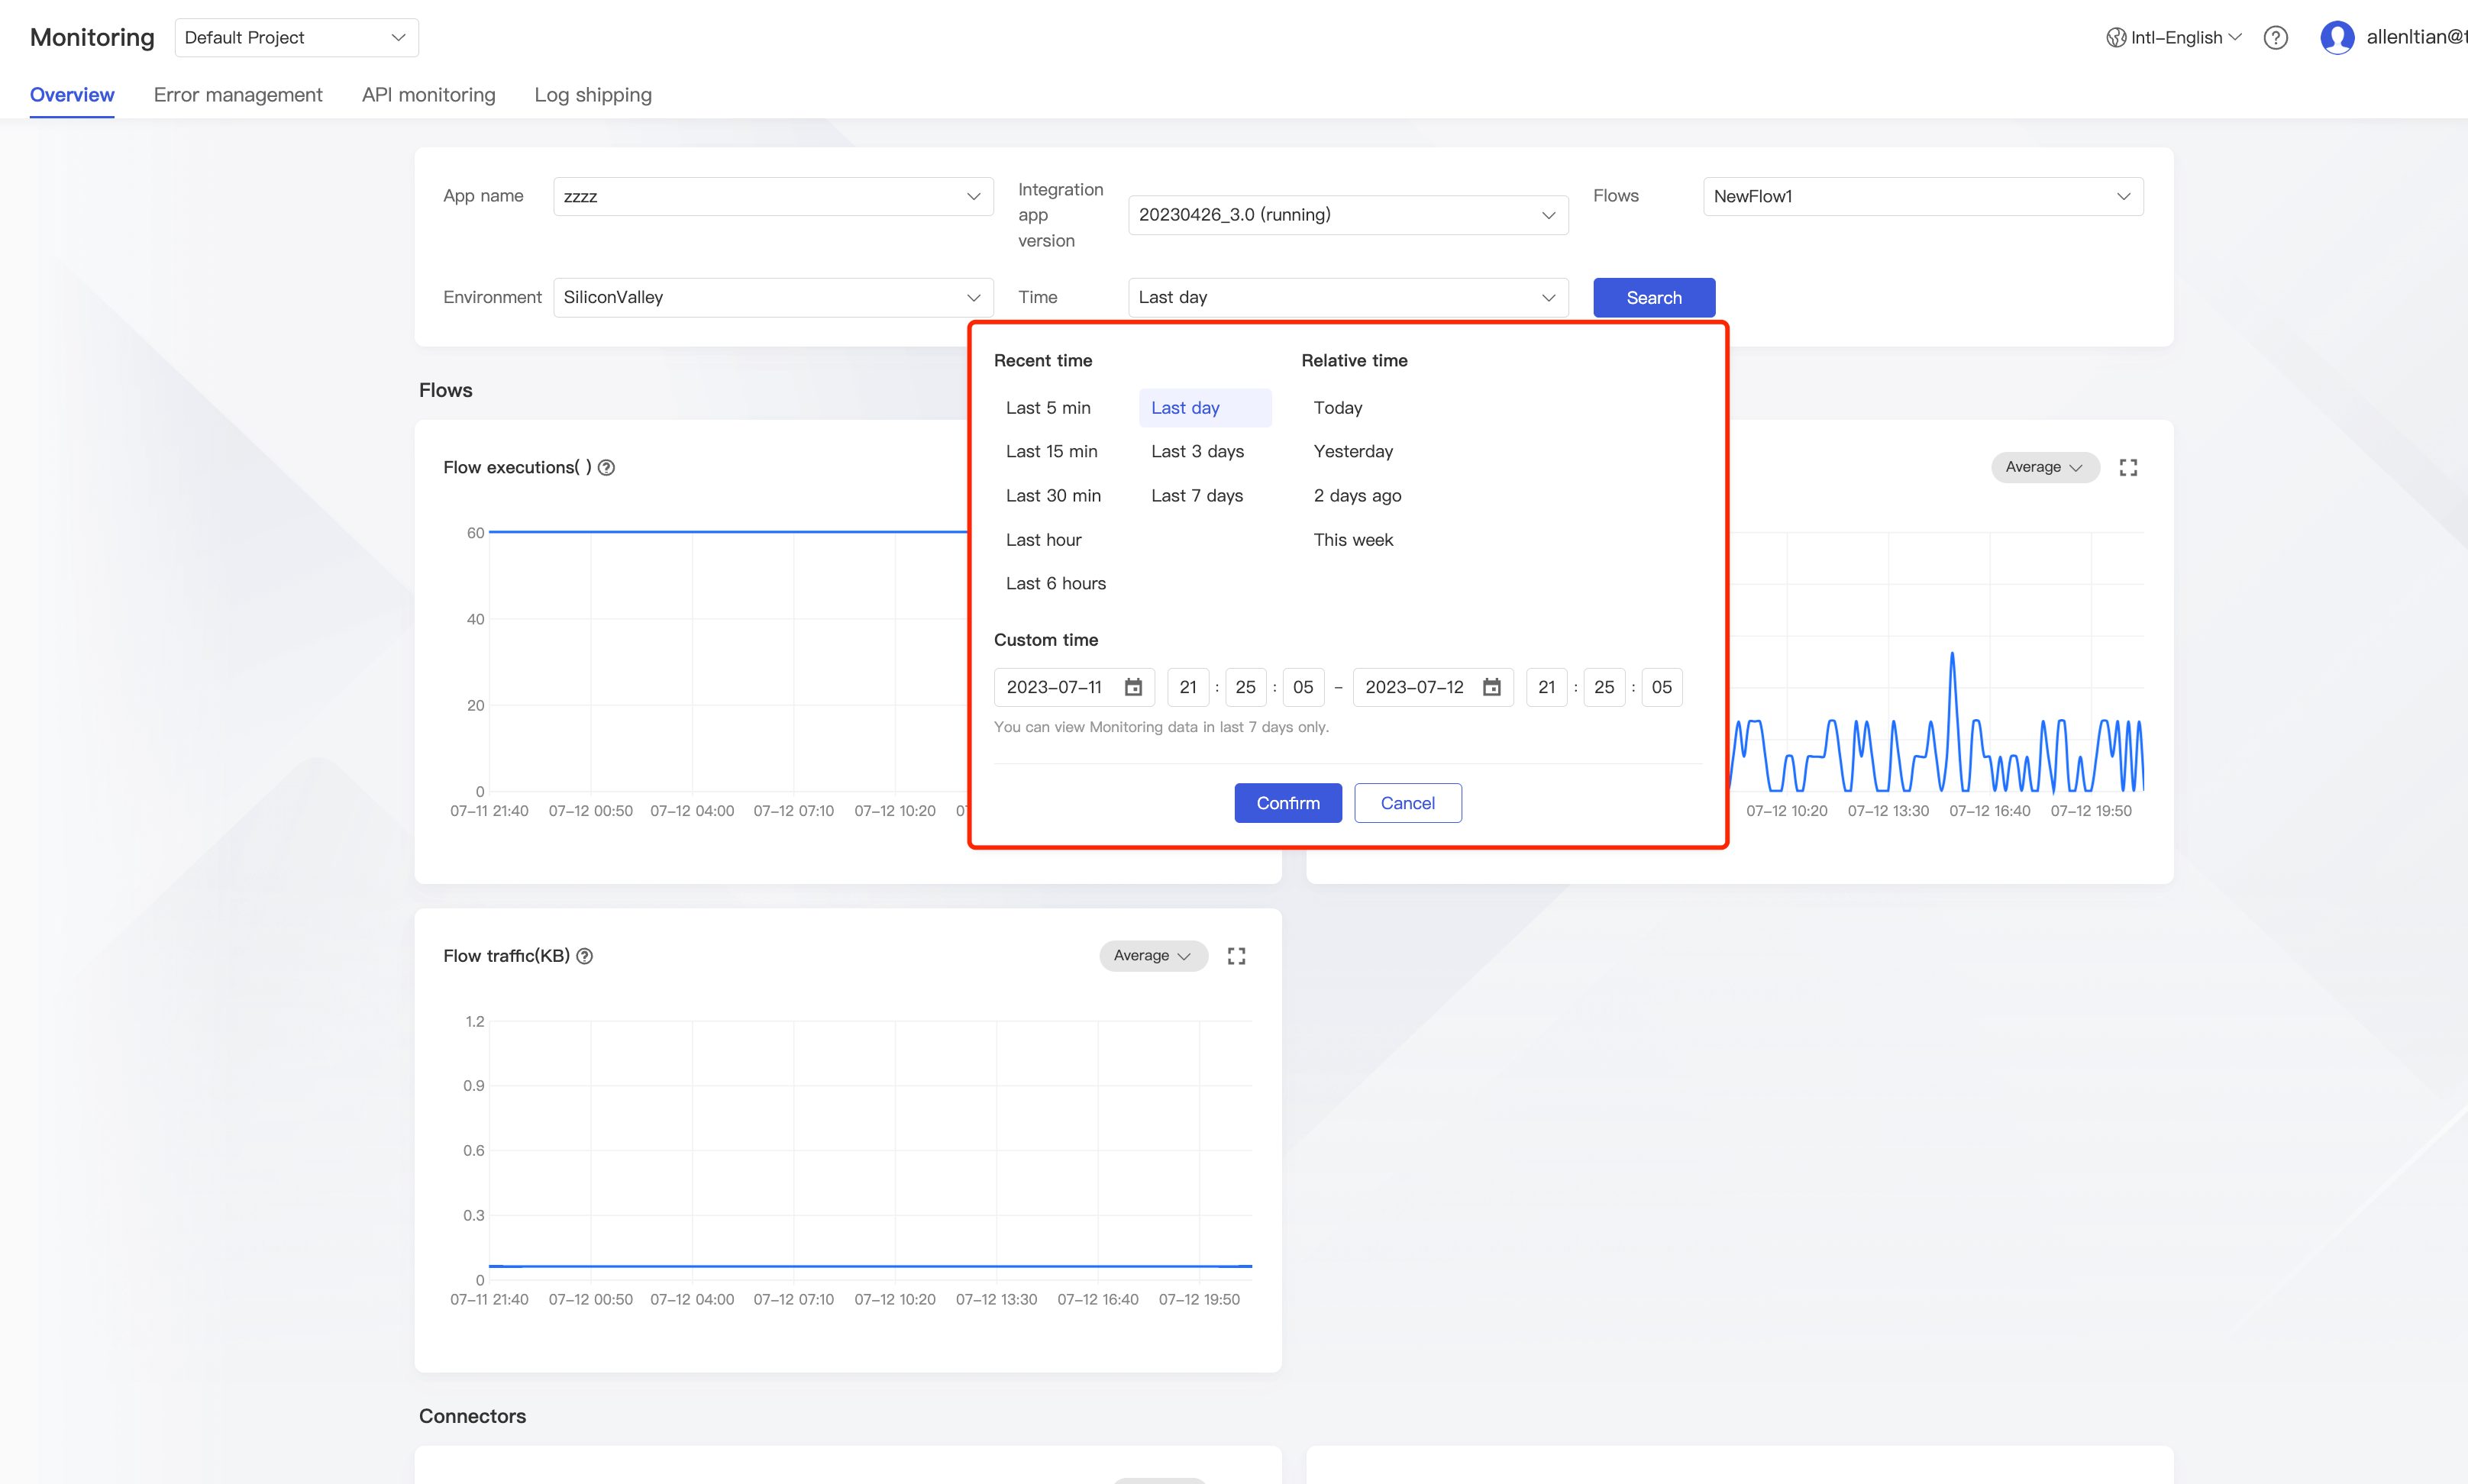
Error management
Note:The console currently lets you search for error statistics only from within the last 30 days. To search for earlier statistics, please submit a ticket for assistance.
1. Viewing the error statistics list
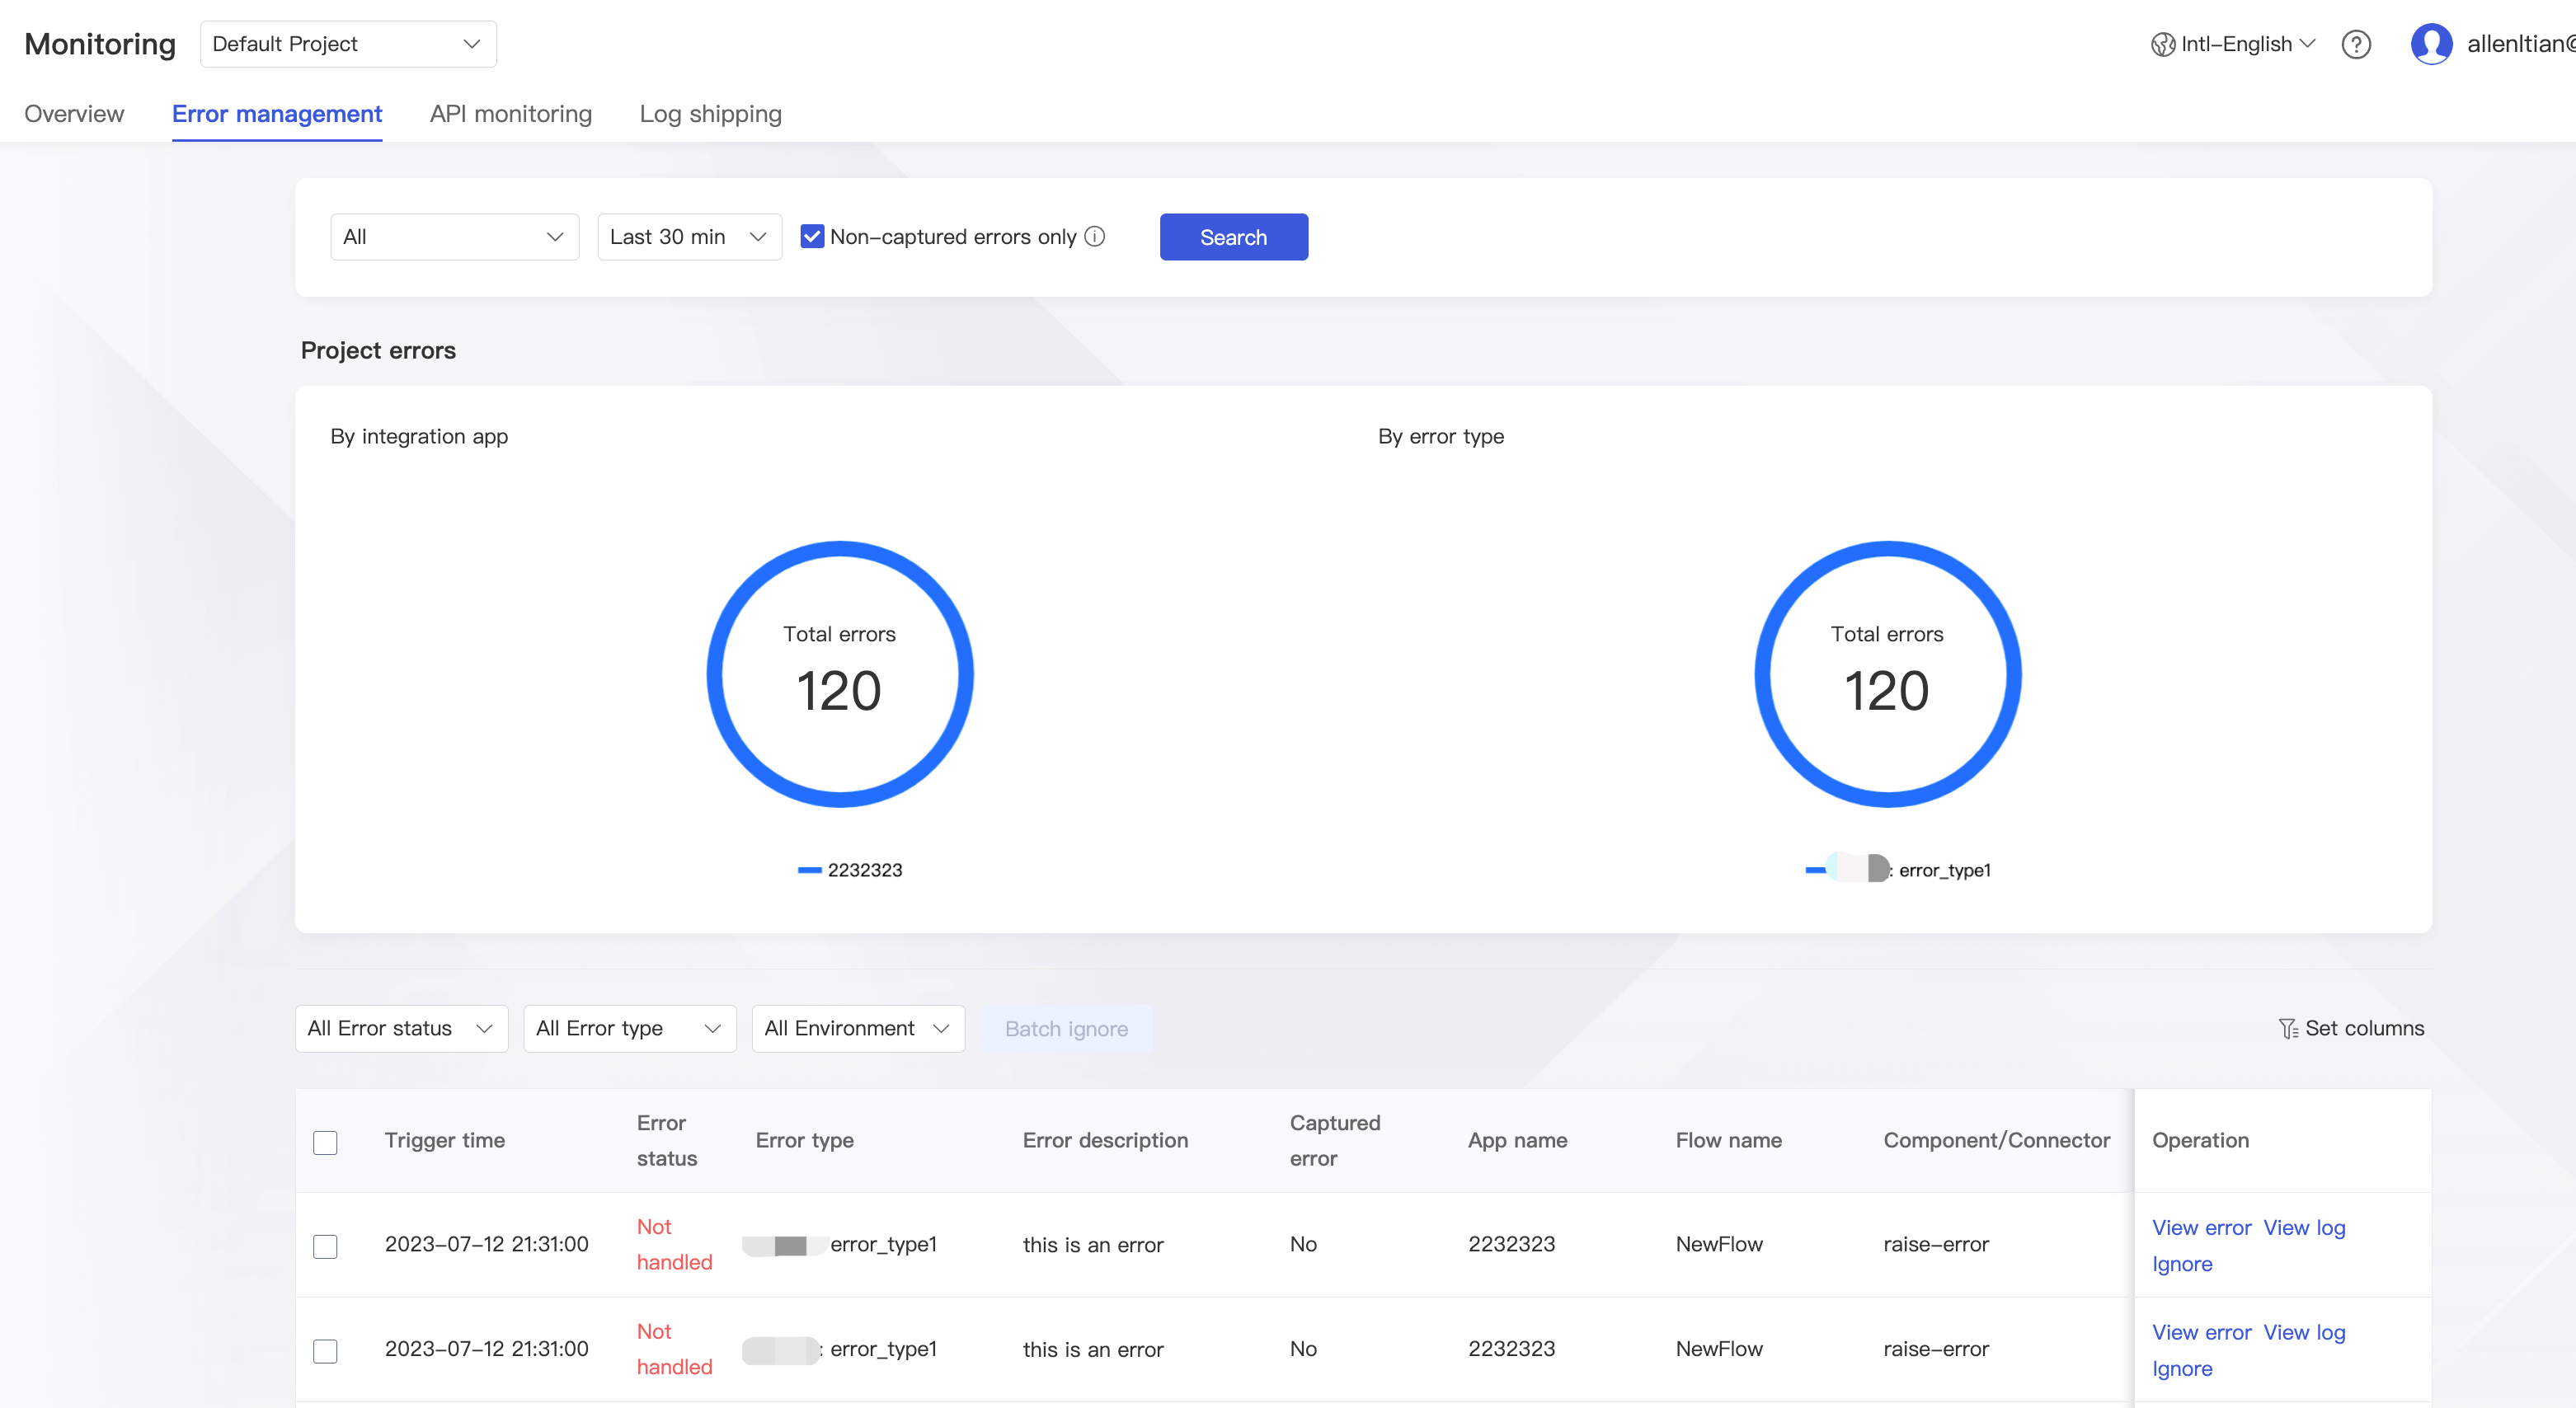
You can centrally view data such as number of errors and error types when an app fails and quickly fix the errors.
You can search by project, app, error status, environment/region, flow, error type, and time. Below is the list:
- App error statistics: Indicates the total number of errors of all flows in an app.
- Error type statistics: Indicates the numbers of errors of all types in an app failure.
- Error status: Only unfixed or ignored errors are displayed.
- Error type: Common errors are divided into different types, so that you can filter flows with errors by error type.
- Error description: Describes the detailed cause of the error to help you to locate the root cause and fix the error as soon as possible.
- Flow: Indicates the name of the flow that reported the error.
- Environment/Region: Indicates the specific environment/region of the app triggering the error and helps you quickly locate the environment where the error occurred.
- Trigger time: Indicates the specific time when the flow triggered the error.
2. Viewing an error
Click View error to quickly locate the flow with the error.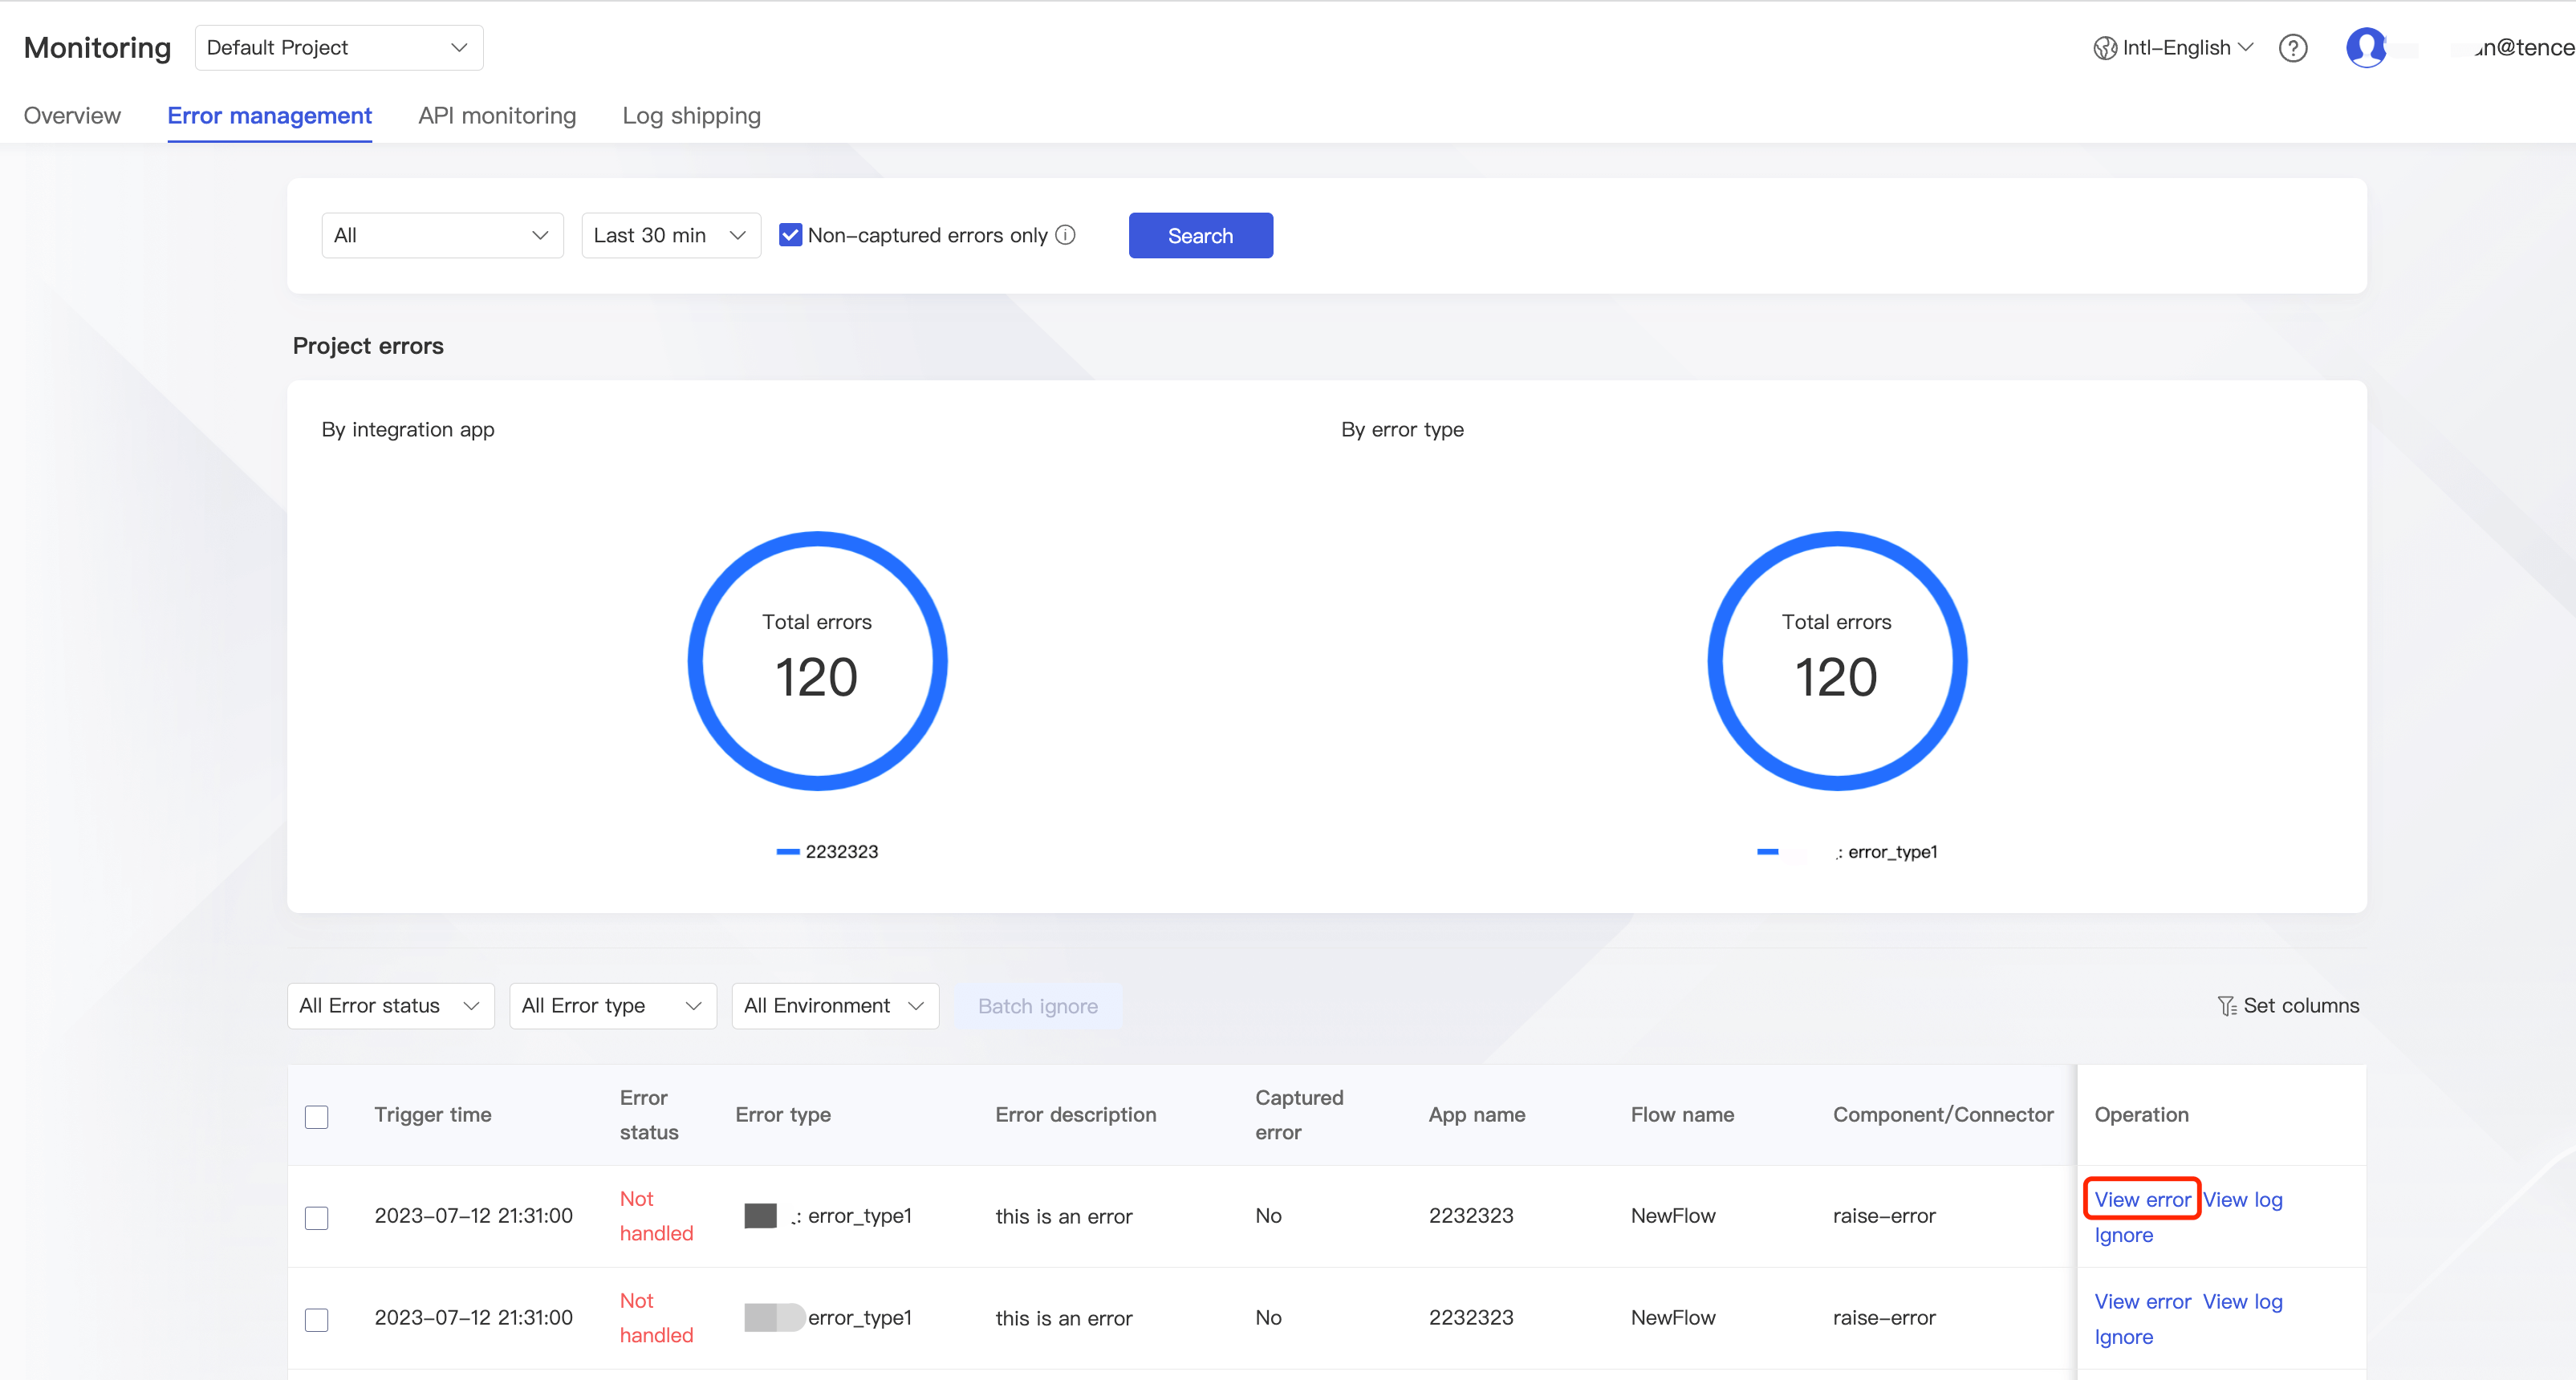
3. Ignoring/Batch ignoring errors
If an error of a flow is fixed, you can click Ignore to ignore the same errors in the adjacent time periods. You can also select multiple errors and click Batch ignore.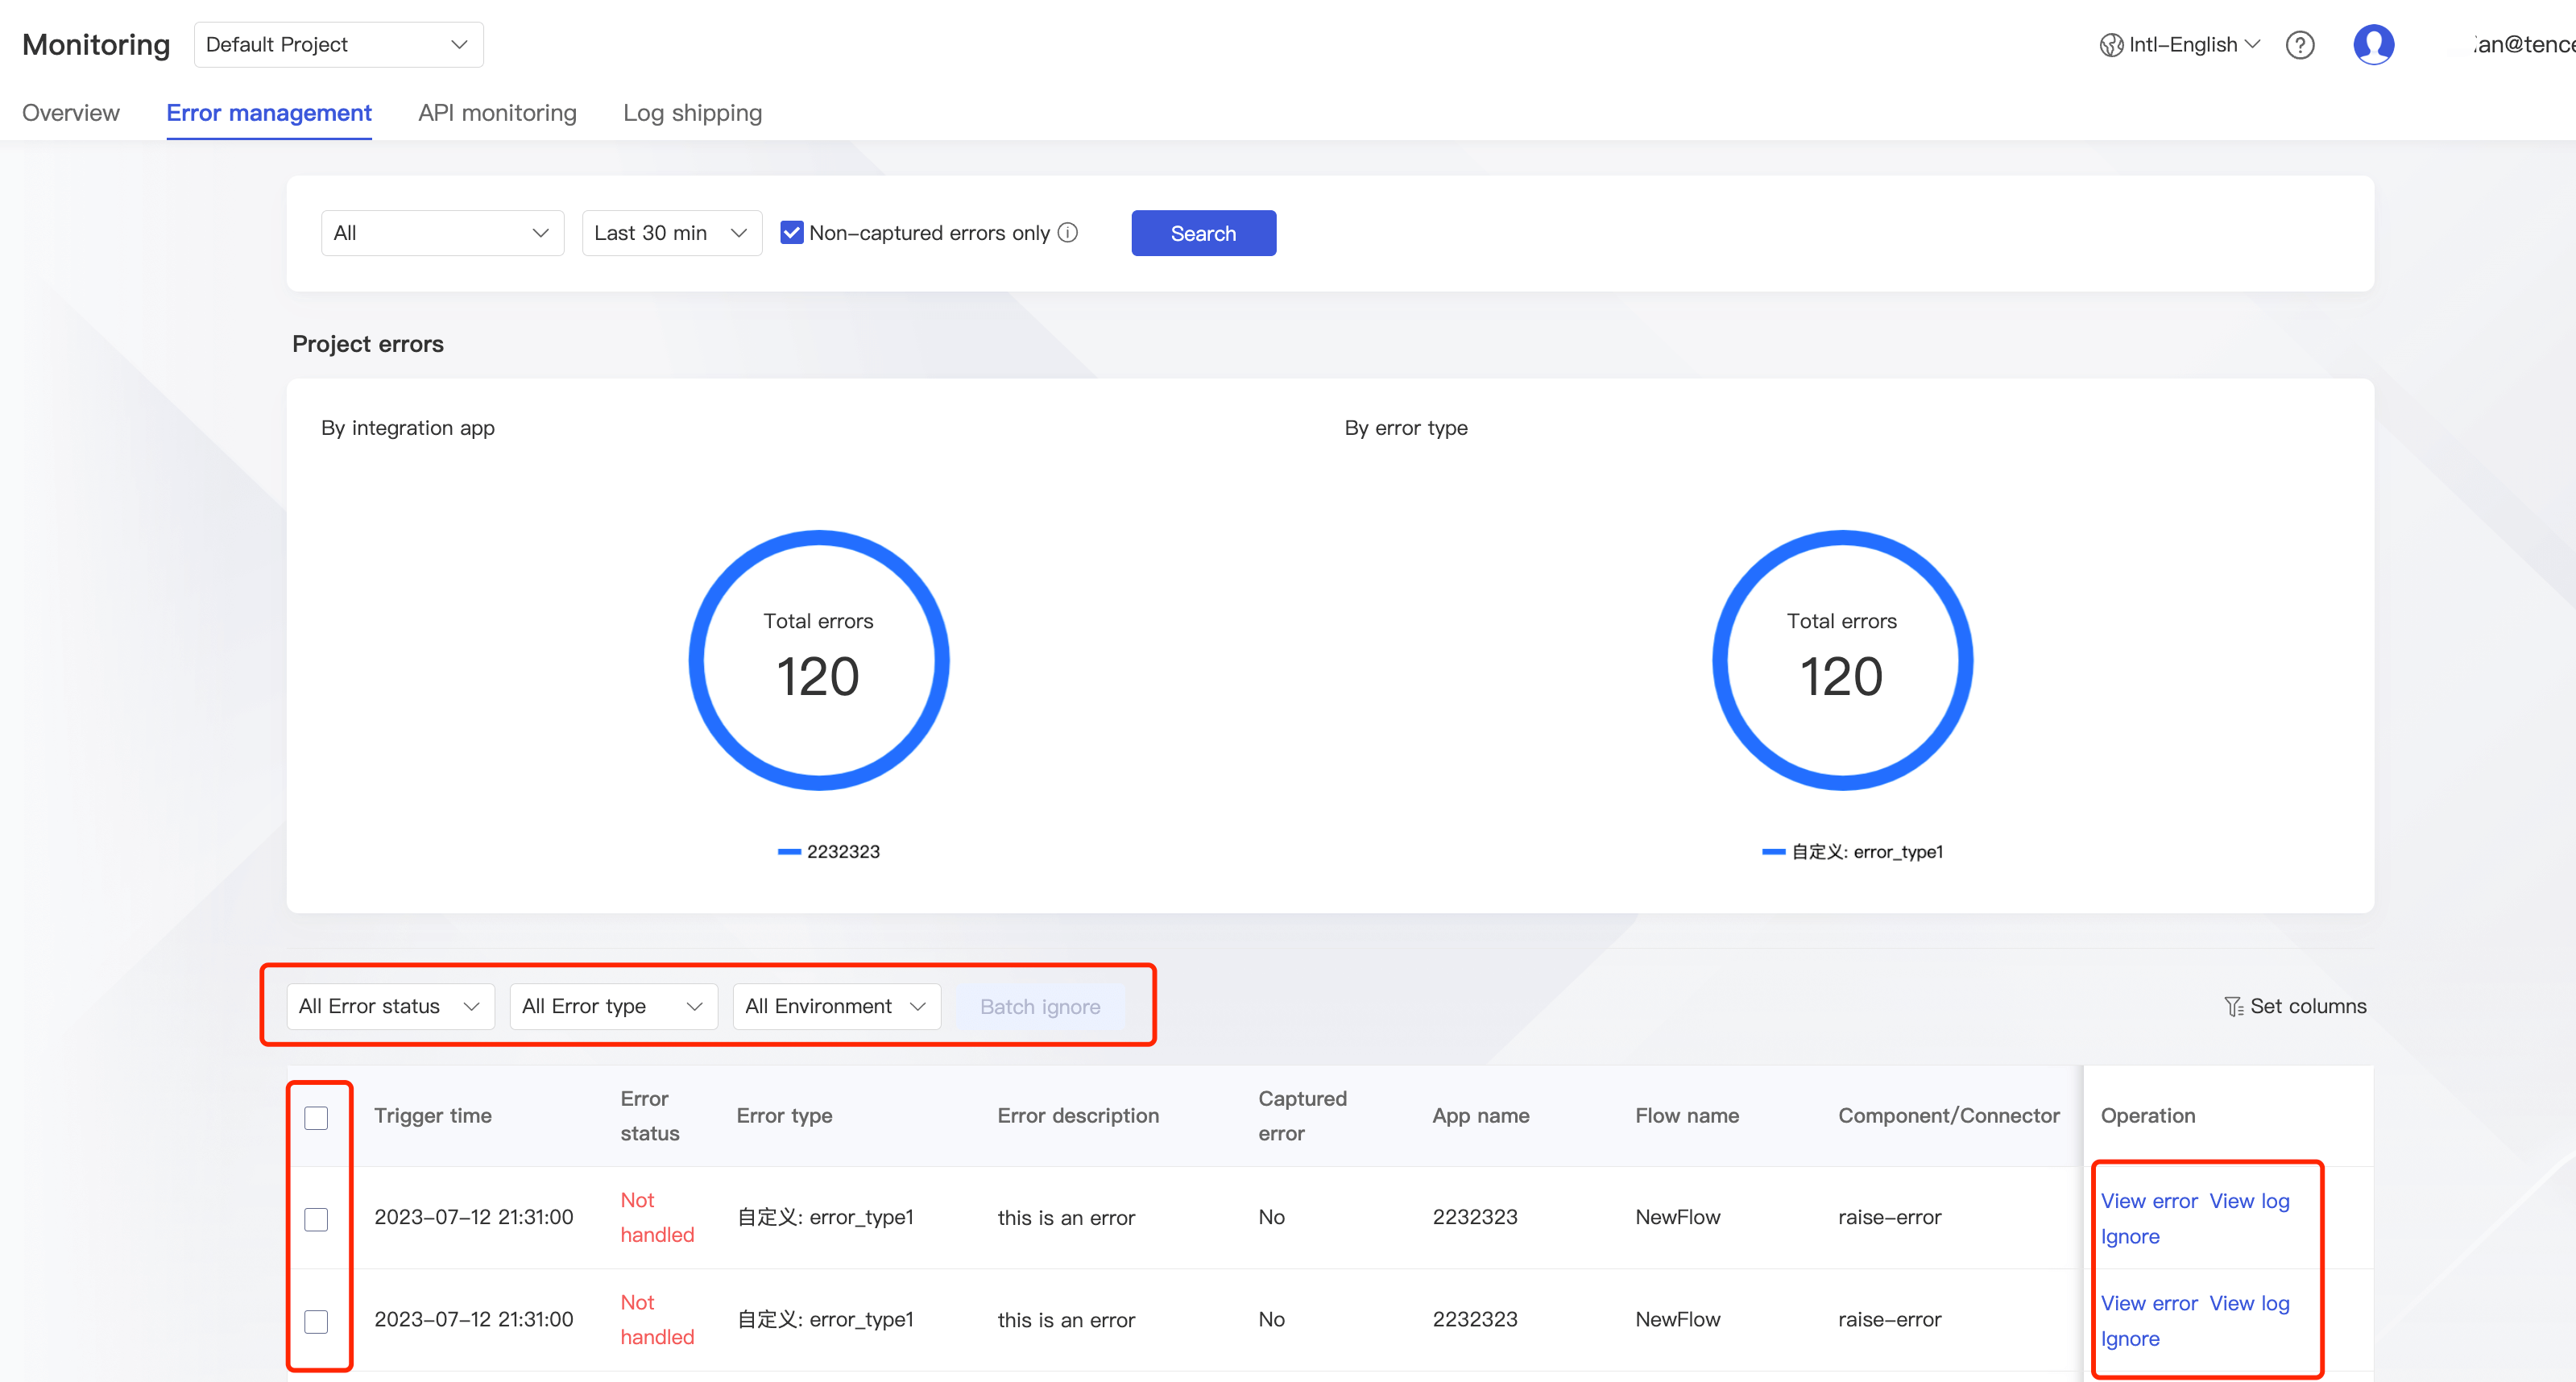
Monitoring Metric Description
| Category | Metric | Description |
|---|---|---|
| App | App monitoring overview | It aggregates the data by integration app (app data is displayed by default if **All flows** is selected) and allows you to view the data and charts of the selected app meeting the filter conditions. |
| App triggers | It indicates the total number of times all flows under an integration app are triggered through triggers such as Scheduler, HTTP Listener, and Kafka Consumer. Once an app is triggered, all referenced flows will be executed. Therefore, the number of times an app is triggered is not greater than the number of flow executions. | |
| App executions | It indicates the total number of times all flows under an integration app are executed and consists of the total number of executions, number of successful executions, and number of failed executions. Taking the total number in the last 24 hours at a 10-minute granularity as an example, each value on the line indicates the total number of app executions in the last 10 minutes. | |
| App execution duration in milliseconds | It indicates how long it takes to execute an integration app. Taking the 99.9th percentile in the last 24 hours at a 10-minute granularity as an example, each value on the line indicates the 99.9th percentile of all durations of the selected app in the last 10 minutes sorted in ascending order, that is, 99.9% of the durations are not greater than the value, which is also the case for other Nth percentile values. | |
| App traffic usage in KB | It indicates the amount of traffic generated by executing an app. Taking the 99.9th percentile in the last 24 hours at a 10-minute granularity as an example, each value on the line indicates the 99.9th percentile of all traffic usage values of the selected app in the last 10 minutes sorted in ascending order, that is, 99.9% of the traffic usage values are not greater than the value, which is also the case for other Nth percentile values. | |
| Flow | Flow monitoring overview | It aggregates the data by flow and allows you to view the data and charts of the selected flow based on the filter conditions. |
| Flow executions | It indicates the number of times a flow is executed and consists of the total number of executions, number of successful executions, and number of failed executions. Taking the total number in the last 24 hours at a 10-minute granularity as an example, each value on the line indicates the total number of flow executions in the last 10 minutes. | |
| Flow execution duration in milliseconds | It indicates how long it takes to execute a flow. Taking the 99.9th percentile in the last 24 hours at a 10-minute granularity as an example, each value on the line indicates the 99.9th percentile of all durations of the selected flow in the last 10 minutes sorted in ascending order, that is, 99.9% of the durations are not greater than the value, which is also the case for other Nth percentile values. | |
| Flow traffic usage in KB | It indicates the amount of traffic generated by executing a flow. Taking the 99.9th percentile in the last 24 hours at a 10-minute granularity as an example, each value on the line indicates the 99.9th percentile of all traffic usage values of the selected flow in the last 10 minutes sorted in ascending order, that is, 99.9% of the traffic usage values are not greater than the value, which is also the case for other Nth percentile values. | |
| Trigger | Connector monitoring overview | It aggregates the data for an executed connector and allows you to view the data and charts of the selected connector of the selected flow of the selected app based on the filter conditions. |
| Connector executions | It indicates the number of times a connector of a flow is executed and consists of the total number of executions, number of successful executions, and number of failed executions. Taking the total number in the last 24 hours at a 10-minute granularity as an example, each value on the line indicates the total number of connector executions in the last 10 minutes. | |
| Connector execution duration in milliseconds | It indicates how long it takes to execute a connector of a flow. Taking the 99.9th percentile in the last 24 hours at a 10-minute granularity as an example, each value on the line indicates the 99.9th percentile of all durations of the selected connector in the last 10 minutes sorted in ascending order, that is, 99.9% of the durations are not greater than the value, which is also the case for other Nth percentile values. | |
| Connector traffic usage in KB | It indicates the amount of traffic generated by executing a connector. Taking the 99.9th percentile in the last 24 hours at a 10-minute granularity as an example, each value on the line indicates the 99.9th percentile of all traffic usage values of the selected connector in the last 10 minutes sorted in ascending order, that is, 99.9% of the traffic usage values are not greater than the value, which is also the case for other Nth percentile values. |


 Yes
Yes
 No
No
Was this page helpful?