TDMQ for RocketMQ allows you to monitor resources created under your account, including clusters, topics, and groups. Based on these metrics, you can analyze the cluster usage and promptly address any possible risks. Moreover, you can set alarm rules for the monitoring metrics to receive notifications in case of abnormal data, allowing you to manage risks promptly and ensure stable system performance.
Monitoring Metrics
The monitoring metrics supported by TDMQ for RocketMQ are as follows:
Metric
Unit
Remarks
Supported Dimensions
Total TPS
Count/s
The total number of API calls for producing and consuming messages (calculated based on the billing rules).
Cluster and Topic
Production TPS
Count/s
The total number of API calls for producing messages (calculated based on the billing rules).
Cluster and Topic
Consumption TPS
Count/s
The total number of API calls for consuming messages (calculated based on the billing rules).
Cluster, Topic, and group
Message storage space
GB
Cluster and Topic
Number of heaped messages
Count/s
Cluster, Topic, group, and Topic&group
TPS of production under traffic throttling
Count/s
Cluster and Topic
TPS of consumption under traffic throttling
Count/s
Cluster, Topic, and group
Number of produced messages
Count/s
Cluster and Topic
Number of consumed messages
Count/s
Cluster, Topic, and group
Message production traffic
MB/s
Cluster and Topic
Message consumption traffic
MB/s
Cluster, Topic, and group
Number of Producers
Count
Only online producer clients are involved.
Cluster and Topic
Production success rate
%
Cluster and Topic
Average message production time (sending response time)
ms
Time consumed for successfully calling the API for sending messages via SDK, which means the response time (RT) of message production. Data of this metric is collected only from clients that have installed TDMQ for RocketMQ 5.x.
Cluster and Topic
Average message size
Bytes
Cluster and Topic
Changes in the number of various types of messages
Count
Cluster
Number of messages added to the dead letter queue (DLQ) per second
Count
The number of messages added to the DLQ per second. These messages still fail to be consumed after being retried for allowed times and are saved to a specified Topic
Cluster, Topic, group, and Topic&group
Queue time of ready messages
ms
The difference between the ready time of the first ready message and the current time, reflecting the timeliness of message pulling by consumers.
Cluster, Topic, group, and Topic&group
Number of messages under processing
Count
The number of messages in the Inflight state. These messages are being consumed on servers, no consumption result is returned.
Cluster, Topic, group, and Topic&group
Queue time of ready messages
ms
The difference between the ready time of the first ready message and the current time, reflecting the timeliness of message pulling by consumers.
Cluster, Topic, group, and Topic&group
Message processing delay
ms
The difference between the ready time of the first message that has not returned any response and the current time, reflecting the timeliness of completing message consumption by consumers.
Cluster, Topic, group, and Topic&group
Average queue time in the local cache queue
ms
Data of this metric is collected only from PushConsumer clients that have installed TDMQ for RocketMQ 5.x. SimpleConsumer clients do not have a cache queue.
Cluster, Topic, group, and Topic&group
Average message consumption time (sending RT)
ms
Time consumed for successfully calling the API for sending messages via SDK, which means the response time (RT) of message production. Data of this metric is collected only from clients that have installed TDMQ for RocketMQ 5.x.
Cluster, Topic, group, Topic&group, and consumer client
Number of retried messages
Count
Topic, group, and Topic&group
Consumption time distribution
-
Thermal distribution diagram for consumption time of different messages (Pro and Platinum Editions only)
Cluster, Topic, group, Topic&group, and consumer client
Production time distribution
-
Thermal distribution diagram for production time of different messages (Pro and Platinum Editions only)
Cluster and Topic
Produced message size distribution
-
Thermal distribution diagram for size of different messages (Pro and Platinum Editions only)
Cluster and Topic
Public network outbound/inbound traffic
MB/s
Cluster
Public network outbound/inbound bandwidth
Mbps/s
Cluster
Public network outbound/inbound bandwidth utilization
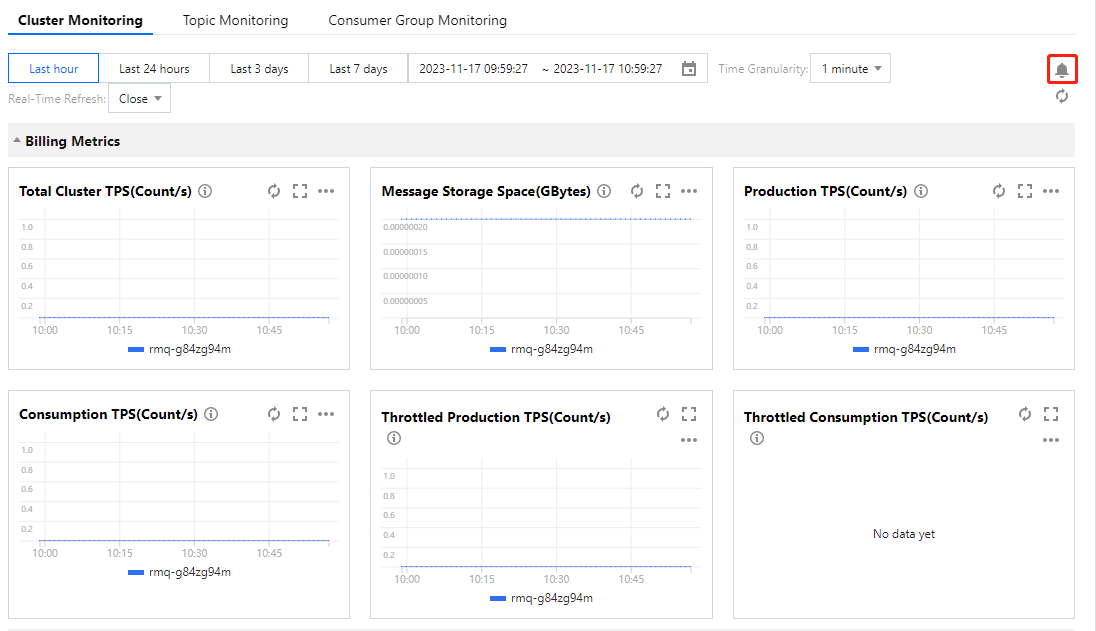
2. On the left sidebar, click Monitoring Dashboard and select the region and cluster to be viewed.
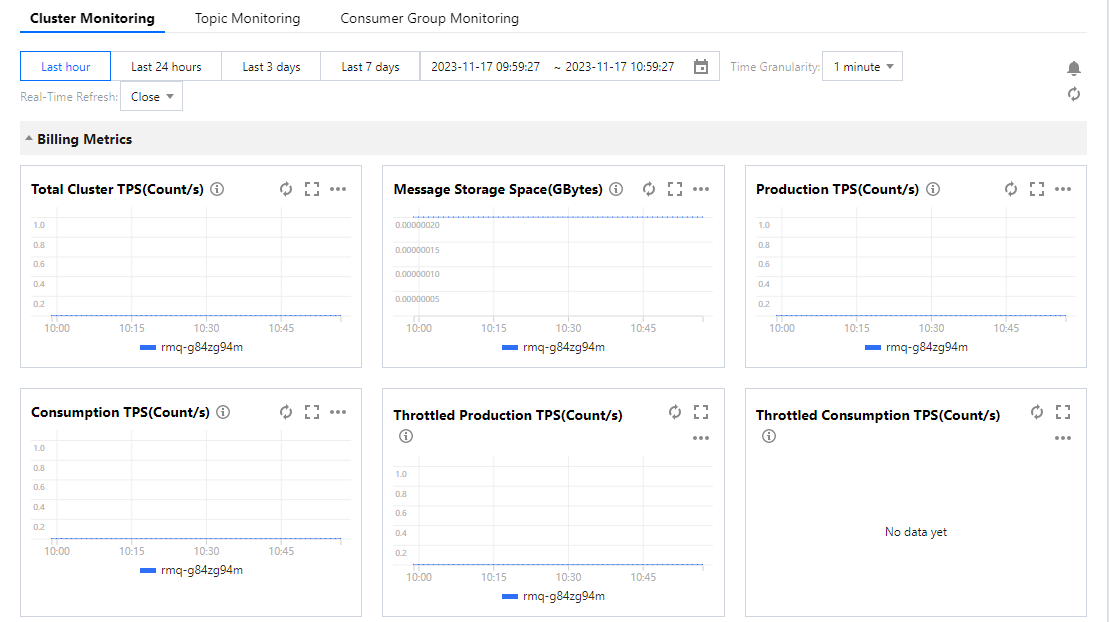
3. On the monitoring page, select the desired resource tab and define the time range to access the corresponding monitoring data.
Icon
Description
Loading…
Click to adjust time granularity of the chart. 1 minute, 5 minutes, and 1 hour are supported.
Loading…
Click to fetch the latest monitoring data, it supports setting 30 seconds, 1 minute, and 5 minutes as automatic refresh intervals for the monitoring data.
Loading…
Click to copy the chart to the dashboard. For more information about the dashboard, please refer to What is Dashboard.
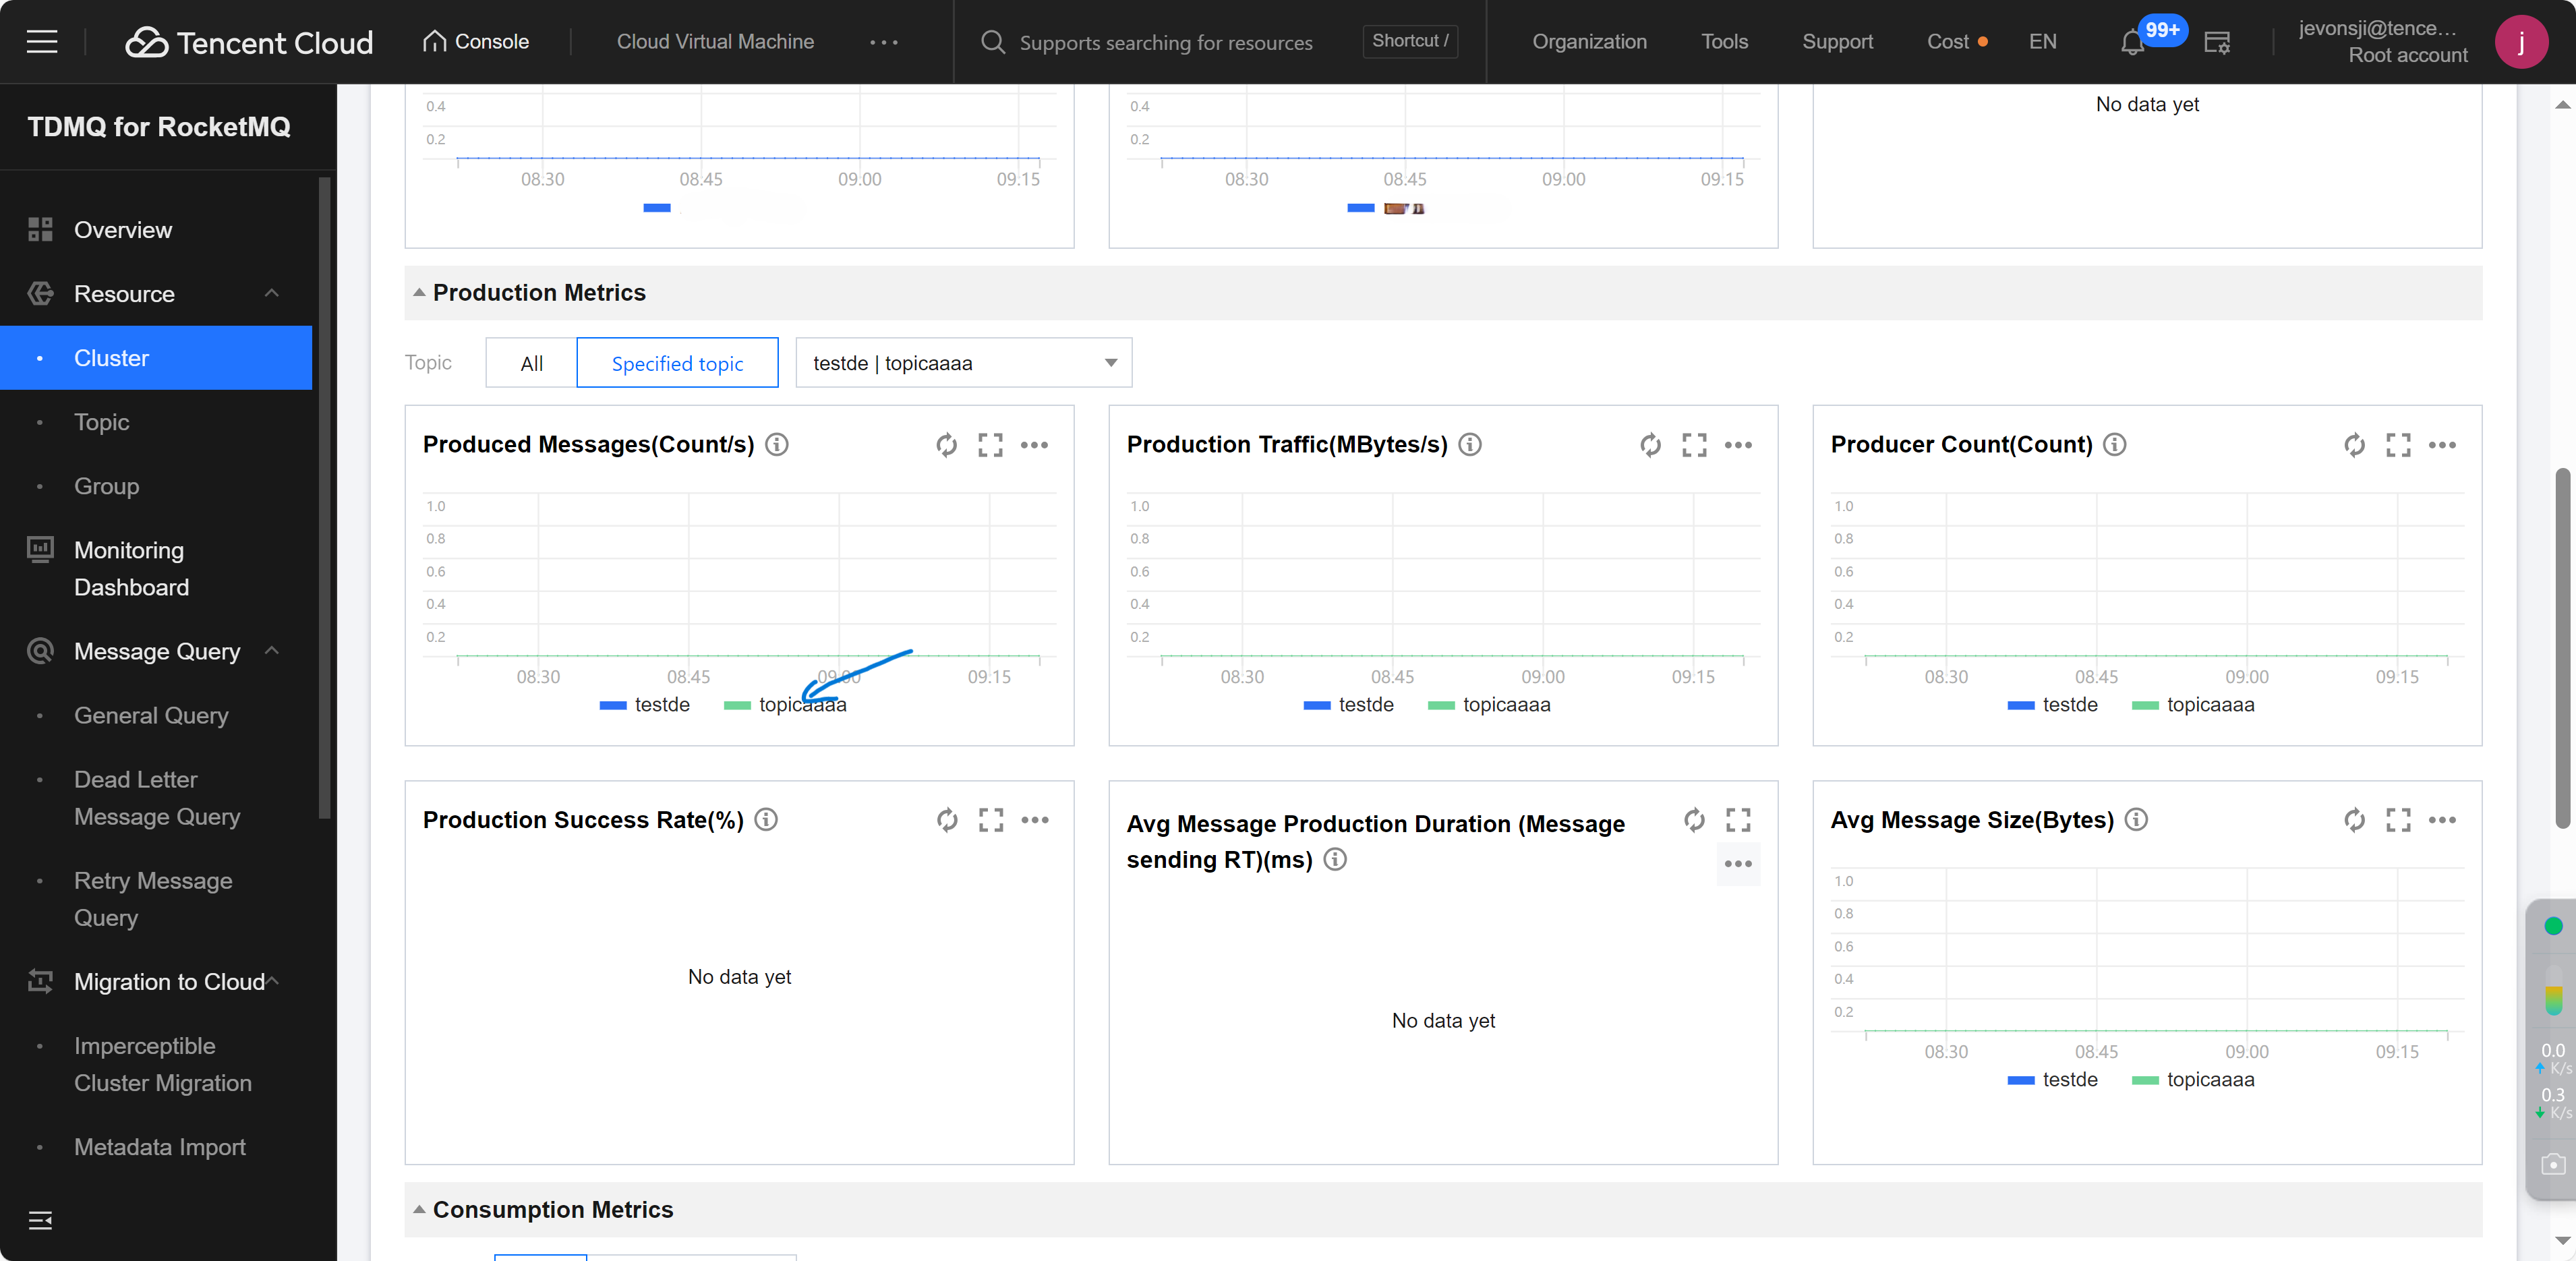
You can select multiple Topics of the cluster to compare their metrics on the cluster monitoring page, as shown below.
Similarly, you can compare metrics of multiple groups with the same subscriber under a Topic or metrics of multiple Topics with the same subscriber under a group.
Configure Alarm Rules
Create Alarm Rules
You can configure alarm rules for monitoring metrics. In the event that a monitoring metric hits the pre-set alarm threshold, TCOP can timely notify you of any exceptional circumstances through various mediums such as email, SMS, WeChat, and telephone.
1. On Monitoring page of the cluster, click the alarm icon as shown below to redirect to the TCOP Console for configuring an alarm policy.
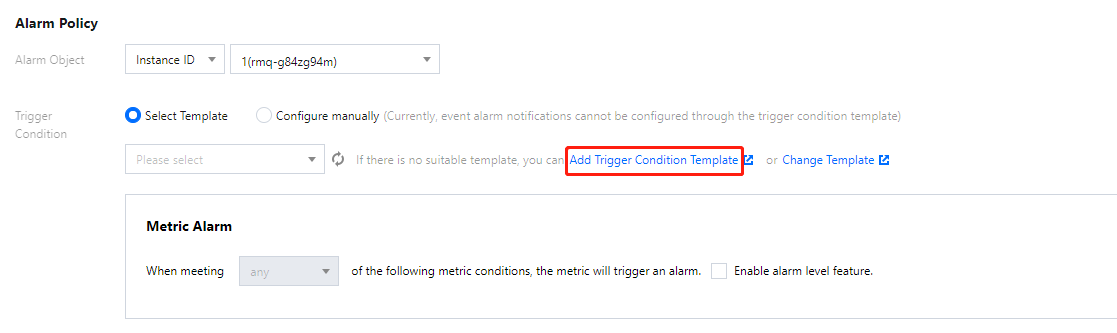
2. On the Alarm Policy page, choose the policy type and instance for alarm setting, establish the alarm rule, and set up the alarm notification template.
Policy Type: Select TDMQ/RocketMQ5 Cluster.
Alarm Object: Select the RocketMQ instance to configure the alarm policy.
Trigger Condition: You can select Select template or Configure manually. The latter is selected by default. For more information on manual configuration, see the description below. For more information on how to create a template, please refer to Creating trigger condition template.
Note:
Metric: For instance, if you select 1 minute as the statistical granularity for the "message production TPS" metric, then if the message production TPS exceeds the threshold for N consecutive data points in that minute, an alarm will be triggered.
Alarm Frequency: For instance, "Alarm once every 30 minutes" implies that if a metric surpasses the threshold during multiple consecutive statistical granularity in 30 minutes, then a single alarm will be activated. Within these 30 minutes, no further alarms will be triggered until the next 30-minute interval. If the metric consistently exceeds the threshold during this subsequent interval, another alarm will be dispatched.
Notification Template: You can select an existing notification template or create one to set the alarm receiving objects and receiving channels.
2. In Configure Alarm Rules, click Select Template> Add Trigger Condition Template to access the trigger condition list page.
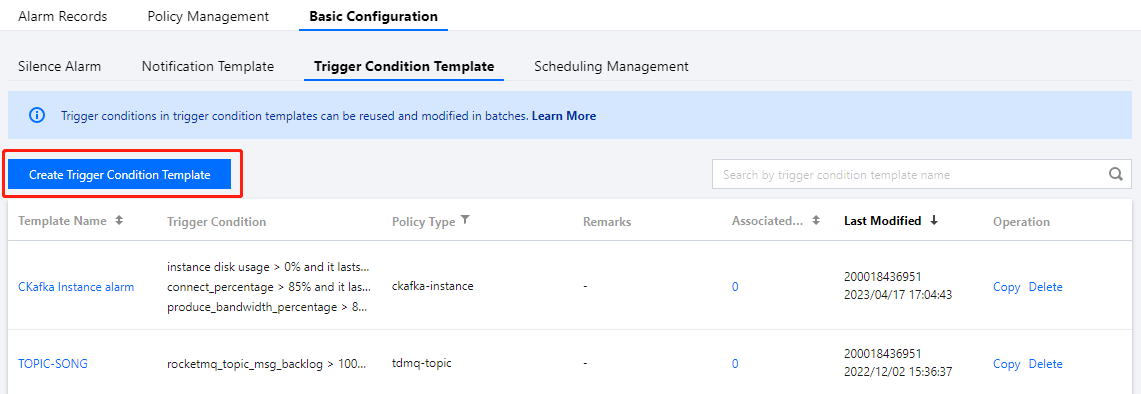
3. Click Create Trigger Condition Template on the trigger condition template page.
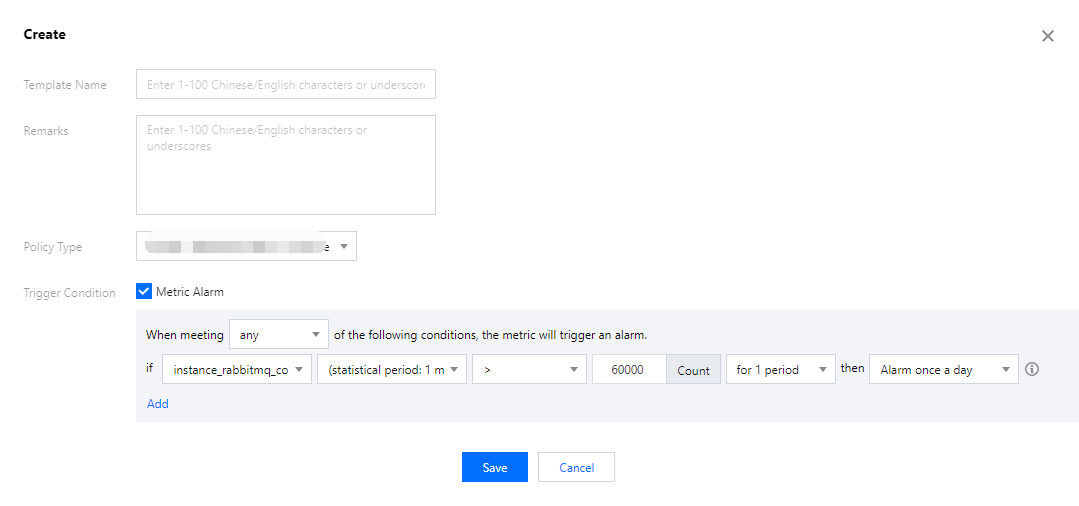
4. On the template creation page, configure the strategy type.
Policy Type: Select TDMQ/RocketMQ5.
Triggers Condition: By selecting this option, the suggested alarm policies from system will occur.
5. After ensuring all details are correct, click Save.
6. Navigate back to the alarm policy creation page and click Refresh. The newly configured alarm policy template will occur.
Connection to Cloud Monitor (Prometheus)
If you are using TCOP and Prometheus instances, you can monitor TDMQ for RocketMQ through Prometheus instances.
1. Log in to the TMP console and select the corresponding Prometheus instance from the instance list.
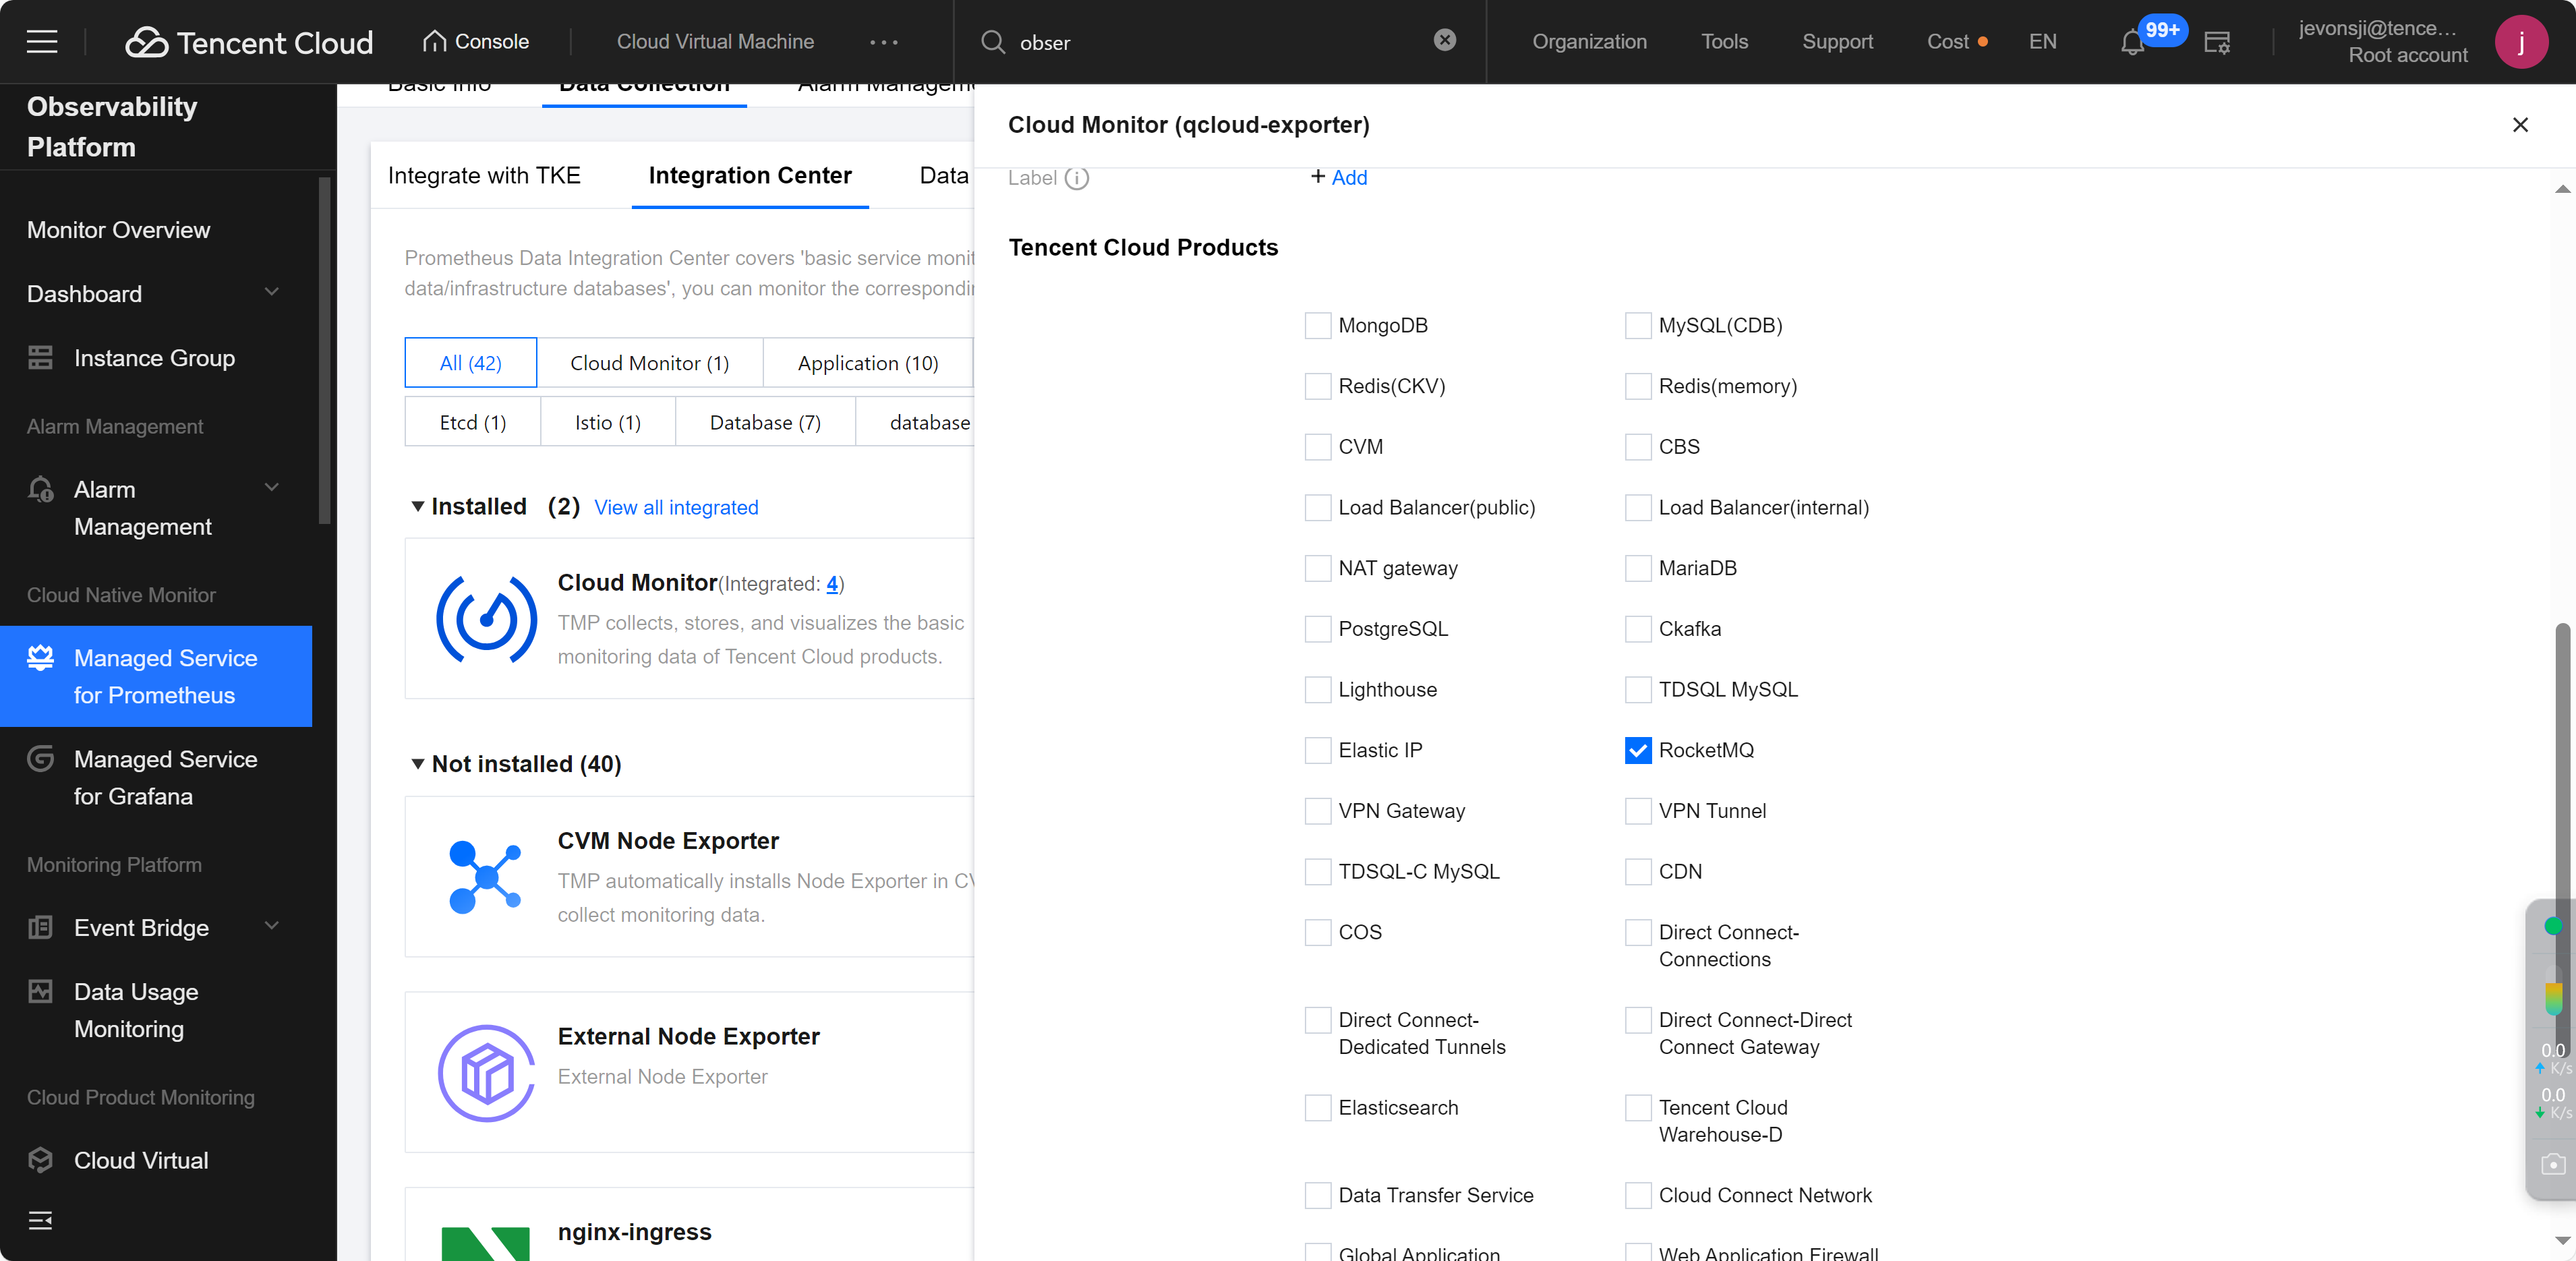
2. Enter the instance details page and choose Data Acquisition > Integration Center .
3. Find Cloud Monitor . You can directly click One-click Installation . If you only need to view the monitoring data of TDMQ for RocketMQ, as shown below, you can select RocketMQ in the Tencent Cloud Products area, and fill in relevant information, including the name and region. For detailed steps, visit Prometheus Integration Center.