Cluster Monitoring
Last updated: 2024-08-19 16:26:10
Overview
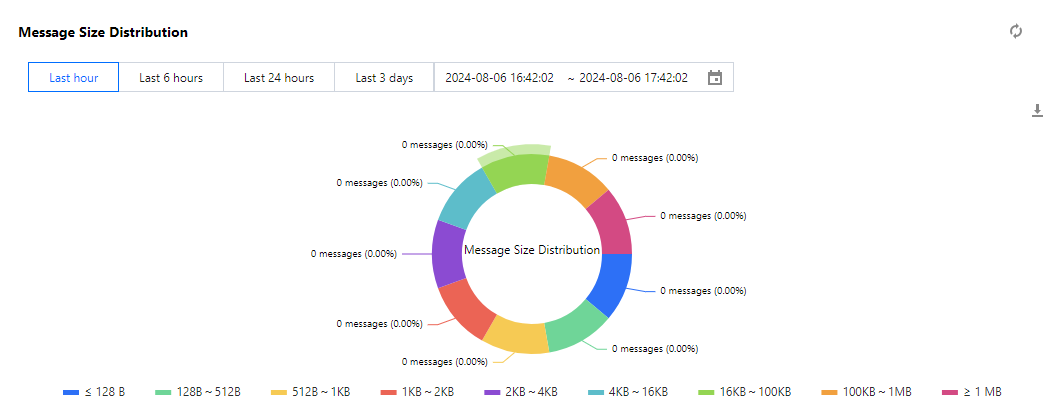
TDMQ for Apache Pulsar supports cluster monitoring features, including computing metrics, storage metrics, and statistical distribution of message size for clusters. You can analyze cluster usage based on these monitoring data and process potential risks promptly. You can also set alarm rules for monitoring item, so you can receive alarm messages when there are data exceptions, address risks promptly, and ensure the stable operation of the system.
Monitoring Metric
The cluster monitoring metrics supported by the TDMQ for Apache Pulsar are as follows:
Key Metric Monitoring
Metric Type | Metrics | Unit |
Computing Metrics | Pulsar Cluster TPS | Count/s |
| Production TPS Peak | Count/s |
| Consumption TPS Peak | Count/s |
| Production Bandwidth Peak | Bytes/s |
| Consumption Bandwidth Peak | Bytes/s |
Storage Metrics | Storage Usage | Bytes |
Message Size Distribution Statistics

Viewing Monitoring
1. Log in to the TDMQ for Apache Pulsar console.
2. Go to the Cluster Management page, and click the target cluster's ID to enter the basic information page.
3. Select the Monitoring Information tab. After selecting the time range and time granularity, you can view the cluster monitoring data.
Was this page helpful?
You can also Contact Sales or Submit a Ticket for help.
Yes
No
Feedback

