
Viewing and Modifying Basic Cluster Information

Last updated: 2025-08-11 11:16:13
Overview
After successfully creating a RabbitMQ cluster, you can view and adjust the basic information about the cluster in the console at any time, including instance name, description, resource Tag, and access address, to ensure the cluster configuration always meets your business requirements. This document describes how to view the basic information about the cluster in the console and modify and manage these basic configuration items.
Directions
1. Log in to RabbitMQ Console.
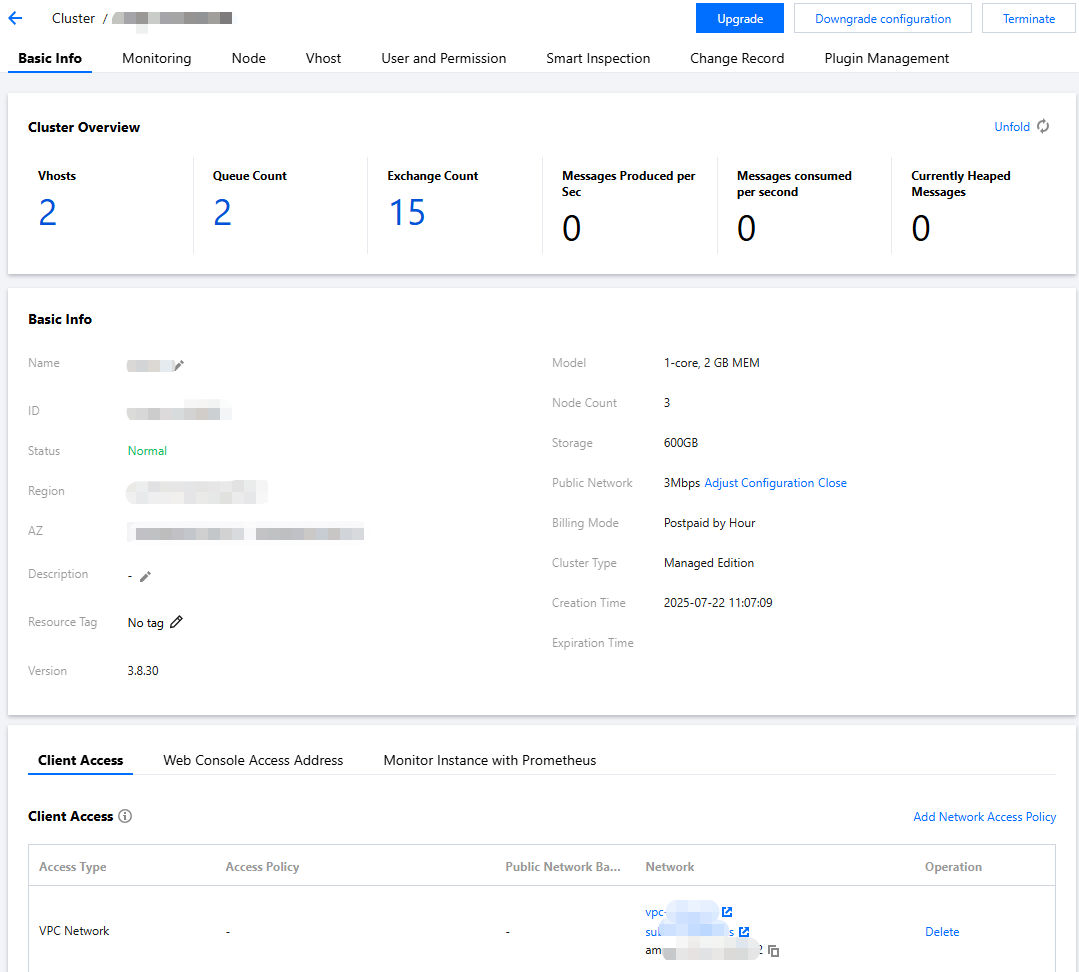
2. In the left navigation bar, select Cluster > Cluster, after selecting the region, click the ID of the target cluster, on the Basic Info page, you can view information such as the cluster's resource overview, health status, basic information, connection method, and Web console access address.
Category | Cluster Support Type | Description |
Cluster Overview | full series | Display the current overall resource usage and message production and consumption of the cluster. You can use these metrics to understand the running state of the cluster as a whole. If a significant increase in message backlog or exceptional fluctuations in production and consumption rate are detected, it indicates potential performance pressure or issues in the cluster. Scale-out, optimization, or troubleshooting is required to ensure service stability and availability. |
Inspection Result | Open-source Managed Edition | If you enable the Intelligent Patrol Function, the inspection results of the cluster will be displayed here. If high-risk or low-risk items appear, please visit the Intelligent Patrol page to view detailed risk descriptions and complete issue fixing or configuration optimization to ensure stable operation of the cluster. Immediate handling is suggested for high-risk issues, while low-risk issues can be optimized based on business conditions. |
Basic Information | full series | Display the detailed configuration information of the cluster. You can adjust some parameters in this module based on actual business needs. |
client access | full series | Display the public network and private network access point information of the cluster. For details, see Configure Network Connection. |
Web console access address | Open-source Managed Edition | Display the access address and username/password info of the open-source RabbitMQ console. It supports both public network and private network access. Public network access supports allowlist control. |
Monitor instances with Prometheus | Open-source Managed Edition | The Prometheus Exporter captures node metric information. Relevant metrics can be aggregated, displayed, and analyzed after data acquisition by Prometheus. For detailed operations, refer to Prometheus Monitoring Integration. |
Modifying Basic Cluster Information
On the cluster basic information page, you can modify the following parameters.
Parameter | Modification Method |
Name | Click the Edit Button next to "Name", enter the cluster name, then click Submit. The name must comply with the naming rule: 3-64 characters, and can only contain letters, numbers, '-', and '_'. |
Overview | Click the Edit Button next to "Description", enter description information, then click Submit. Cluster description cannot exceed 128 characters. |
Resource Tag | Click the Edit Button next to "Resource Tag". You can bind or modify tags for the cluster. For detailed usage about tags, refer to Configure Resource Tag. |
Public network | (Only supported in open-source managed version) Click the Edit Button next to "Public network" to enable or disable public network bandwidth manually. For details about public network, see Configure Public Network Access. |
Was this page helpful?
You can also Contact Sales or Submit a Ticket for help.
Yes
No
Feedback