This document mainly introduces the statistical results of Doris during query execution. With these statistical information, we can better understand the execution situation of Doris and carry out targeted debug and optimization tasks.
Definitions
FE: Frontend, the frontend node of Doris, responsible for metadata management and request access.
BE: Backend, the backend node of Doris, responsible for query execution and data storage.
Fragment: The FE will convert the execution of specific SQL statements into corresponding Fragments and distribute them to BE for execution. BE executes the corresponding Fragment and aggregates the results and sends them back to FE.
Basic Principles
FE splits the query plan into Fragments and sends them to BE for task execution. BE records statistics during runtime when executing the Fragments and outputs the statistical information of the Fragment execution into logs. FE can also collect these statistics recorded by each Fragment through a switch, and print the results on the FE Web page.
Flowchart
Turn on the Report switch on FE via the Mysql command.
mysql>setenable_profile=true;
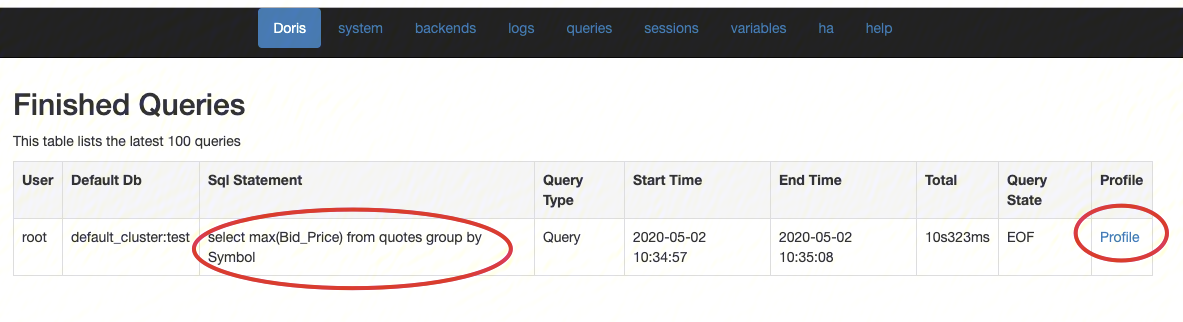
After executing the corresponding SQL statement (in older versions, it's is_report_success), you can see the Report information for the executed SQL statement on the FE Web page:
This will list the last executed 100 statements. We can use Profile to check the detailed statistics.
Query:
Summary:
Query ID: 9664061c57e84404-85ae111b8ba7e83a
Start Time: 2020-05-02 10:34:57
End Time: 2020-05-02 10:35:08
Total: 10s323ms
Query Type: Query
Query State: EOF
Doris Version: trunk
User: root
Default Db: default_cluster:test
Sql Statement: select max(Bid_Price) from quotes group by Symbol
This detailed list includes the ID of the query, execution time, execution statements, and many other summary information. The following content is printing the detailed information collected from each Fragment in BE.
hostname refers to the BE node executing the Fragment.
Active:10s270ms refers to the total execution time of this node.
non-child: 0.14% refers to the execution time of the node itself (excluding the execution time of child nodes) as a percentage of the total time.
PeakMemoryUsagerefers to the peak memory usage of the EXCHANGE_NODE.
RowsReturned refers to the number of rows returned by the EXCHANGE_NODE.
RowsReturnedRate=RowsReturned/ActiveTime.
These three items of statistics apply to other NODEs in the same way.
Subsequent prints of child node statistics, Here you can distinguish the parent-child relationship between nodes by indentation.
Profile Parameter Analysis
BE collects a variety of statistical information, the meaning of each parameter is explained below:
Fragment
AverageThreadTokens: The number of threads used to execute Fragment; exclude the situation of the use of Thread Pool.
Buffer Pool PeakReservation: The peak memory value usage of Buffer Pool.
MemoryLimit: Memory limit during the query.
PeakMemoryUsage: The peak memory usage of the entire Instance during a query.
RowsProduced: The number of rows processed with columns.
BlockMgr
BlocksCreated: The number of Blocks created by BlockMgr.
BlocksRecycled: The number of Blocks reused.
BytesWritten: Total volume of data written to disk.
MaxBlockSize: The size of a single Block.
TotalReadBlockTime: The total time it takes to read a Block.
DataStreamSender
BytesSent: The total volume of data sent = Receivers * Volume of sent data.
IgnoreRows: Number of filtered rows.
LocalBytesSent: During the Exchange process, records the spontaneous and self-received data volume of this node.
OverallThroughput: Total Throughput = BytesSent / Time.
SerializeBatchTime: The time taken to serialize the sent data.
UncompressedRowBatchSize: The size of the RowBatch before the sent data is compressed.
ODBC_TABLE_SINK
NumSentRows: The total number of rows written to the external table.
TupleConvertTime: Time consumed to serialize sent data into Insert statements.
ResultSendTime: The time it takes to write through the ODBC Driver.
EXCHANGE_NODE
BytesReceived: The amount of data received through the network.
MergeGetNext: When the underlying node is sorted, a unified merge sort is performed at the EXCHANGE NODE to output an ordered result. The indicator records the total time consumed in the Merge sort, including the time consumed by MergeGetNextBatch.
MergeGetNextBatch: The time Merge node takes to retrieve data. If it's a single-layer Merge sort, the object retrieved from the data is the network Queue. If it's multiple layers Merge sort, the object of the data retrieval is the Child Merger.
ChildMergeGetNext: When there are too many Senders sending data from the lower layer, the single-thread Merge will become a performance bottleneck. Doris will start multiple Child Merge threads for parallel merge sorting. This records the duration for sorting by Child Merge. This value is the sum of multiple threads.
ChildMergeGetNextBatch: The time it takes for the Child Merge node to retrieve data. If it takes too long, the possible bottleneck would be the data sending node of the lower layer.
DataArrivalWaitTime: The total waiting time for Sender to send data.
FirstBatchArrivalWaitTime: The time it takes to wait for the first batch obtained from the Sender.
DeserializeRowBatchTimer: Time used on deserializing network data.
SendersBlockedTotalTimer(*): The time it takes for the Sender to wait when the Queue memory of DataStreamRecv is filled.
ConvertRowBatchTime: The time it takes to convert received data into RowBatch.
RowsReturned: Number of rows returned.
RowsReturnedRate: Rate of rows returned.
SORT_NODE
InMemorySortTime: Time used on sorting in memory.
InitialRunsCreated: Number of initial sort runs (this number is 1 if it is in-memory sort).
SortDataSize: Total volumr of sorted data.
MergeGetNext: Time taken for MergeSort to access the next batch from multiple sort_runs (only timed when written to disk).
MergeGetNextBatch: Time taken for MergeSort to retrieve the next batch from a sort_run (only timed when written to disk).
TotalMergesPerformed: Number of times of performed external merge.
AGGREGATION_NODE
PartitionsCreated: Number of partitions split in aggregate query.
GetResultsTime: Time of obtaining aggregate results from partitions.
HTResizeTime: Time taken by HashTable to resize.
HTResize: Number of times HashTable is resized.
HashBuckets: Number of Buckets in the HashTable.
HashBucketsWithDuplicate: Number of Buckets with DuplicateNodes in the HashTable.
HashCollisions: Number of hash collisions in the HashTable.
HashDuplicateNodes: Number of Buckets with the same number of DuplicateNodes appeared in the HashTable.
HashFailedProbe: Number of failed Probe operations in the HashTable.
HashFilledBuckets: Number of Buckets in the HashTable filled with data.
HashProbe: Number of queries in the HashTable.
HashTravelLength: Number of steps moved during a HashTable query.
HASH_JOIN_NODE
ExecOption: Method of constructing HashTable for right child (synchronously or asynchronously), the right child in a Join can be a table or subquery, and the same applies to the left child.
BuildBuckets: Number of Buckets in the HashTable.
BuildRows: Number of rows in HashTable.
BuildTime: Time taken to build the HashTable.
LoadFactor: Load factor of the HashTable (i.e., number of non-empty Buckets).
ProbeRows: Number of rows of Hash Probe for transverse.
ProbeTime: Time taken for Hash Probe to transverse the left child, excluding the time taken to invoke GetNext on the left child's RowBatch
PushDownComputeTime: Time taken for computing predicate conditions for a push down.
PushDownTime: Total time taken to predicate push down. In a Join, change the suitable right child into an in-query left child.
CROSS_JOIN_NODE
ExecOption: Method for constructing RowBatchList for the right child (synchronously or asynchronously).
BuildRows: Number of rows in RowBatchList (i.e., the number of rows in the right child).
BuildTime: Time taken for constructing the RowBatchList.
LeftChildRows: Number of rows in the left child.
LeftChildTime: Time taken to transverse the left child and obtain the Cartesian product of the right child. It doesn't include the time taken to invoke GetNext on the left child's RowBatch.
UNION_NODE
MaterializeExprsEvaluateTime: When the field types of the two sides of the Union are inconsistent, it is the time of type conversion expression calculation and result materialization.
ANALYTIC_EVAL_NODE
EvaluationTime: Total time taken to compute analytical (Window) Functions.
GetNewBlockTime: Time taken to allocate a new Block at initialization. This Block is used to Cache Rows window or the entire partition, for analytical function calculation.
PinTime: Time taken to subsequent allocation of a new Block or re-reading the written disk Block back to memory.
UnpinTime: When a Block is not needed to be used temporarily or when the memory pressure in the current operator is high, this is the time to flush the Block data into the disk.
OLAP_SCAN_NODE
OLAP_SCAN_NODE node carries out the actual data scanning tasks. An OLAP_SCAN_NODE can generate one or more OlapScanners. Each Scanner thread is responsible for scanning part of the data.
Some or all predicate conditions in a query are pushed to the OLAP_SCAN_NODE. Some of these predicate conditions are further pushed to the Storage engine, to utilize the index of the Storage engine for data filtering. Others are retained in the OLAP_SCAN_NODE to filter data returning from the Storage engine.
The Profile of the OLAP_SCAN_NODE node is often used to analyze the efficiency of data scanning, divided into OLAP_SCAN_NODE, OlapScanner, SegmentIterator layers based on the calling relationship.
Here is a typical Profile for a OLAP_SCAN_NODE node. Some metrics will have different meanings depending on the storage format (V1 or V2).
- BytesRead: 265.00 B # The amount of data that has been read from the data file. If ten 32-bit integers are read, then the data amount is 10 x 4B = 40 Bytes. This number only represents the memory size when the data is fully expanded and does not represent the actual IO size.
- NumDiskAccess: 1# Number of disks that the ScanNode node has involved.
- NumScanners: 20# Number of Scanners that the ScanNode has generated.
- PeakMemoryUsage: 0.00# The peak memory usage during querying, currently not used
- RowsRead: 7# The number of rows returned from the Storage engine to the Scanner, excluding the rows filtered by the Scanner.
- RowsReturned: 7# The number of rows returned by the ScanNode to the upper node.
- TabletCount :20# The number of Tablets involved in this ScanNode.
- TotalReadThroughput: 74.70 KB/sec # BytesRead divided by the total running time of this node (from Open to Close). For IO-restricted queries, this value approaches the total throughput of the disk.
- ScannerBatchWaitTime: 426.886us # The time taken by the transfer thread to wait for the scanner thread to return rowbatch.
- ScannerWorkerWaitTime: 17.745us # The time taken by the scanner thread to wait for available worker threads in the Thread Pool.
OlapScanner:
- BlockConvertTime: 8.941us # The time taken to convert the vectorized Block to the row structure's RowBlock. In V1, the vectorized Block is VectorizedRowBatch, and in V2, it's RowBlockV2.
- BlockFetchTime: 468.974us # The time taken by the Rowset Reader to obtain the Block.
- ReaderInitTime: 5.475ms # The time taken by the OlapScanner to initialize the Reader. In V1, this includes the time taken to assemble MergeHeap. In V2, it includes the time to generate each level Iterator and read the first set of Blocks.
- RowsDelFiltered: 0# The number of rows filtered based on the Delete information in Tablet, as well as the number of rows marked for deletion filtered under the unique key model.
- RowsPushedCondFiltered: 0# The number of rows filtered based on the predicates pushed down, such as the conditions passed from BuildTable to ProbeTable in Join computation. This number is not accurate as the filtering will stop if it yields poor results.
- ScanTime: 39.24us # The time returned by the ScanNode to the upper node.
- ShowHintsTime_V1: 0ns # Meaningless in V2. In V1, it reads part of the data to split the ScanRange.
SegmentIterator:
- BitmapIndexFilterTimer: 779ns # The time taken to filter data using bitmap index.
- BlockLoadTime: 415.925us # The time taken by the SegmentReader(V1) or SegmentIterator(V2) to access the block.
- BlockSeekCount: 12# The number of performed block seek operations when reading the Segment.
- BlockSeekTime: 222.556us # The time taken to perform a block seek operation when reading the Segment.
- BlocksLoad: 6# The number of Blocks read
- CachedPagesNum: 30# Only in V2, when PageCache is enabled, the number of Pages that hit the Cache.
- CompressedBytesRead: 0.00# In V1, the size of the data read from the file before decompression. In V2, the size before compression of the Pages that were read and did not hit the PageCache.
- DecompressorTimer: 0ns # The time taken to decompress the data.
- IOTimer: 0ns # The IO time of actual data reading from the operating system.
- IndexLoadTime_V1: 0ns # Only in V1, the time taken to read the Index Stream.
- NumSegmentFiltered: 0# The number of Segments completely filtered out through column statistics and query conditions when generating the Segment Iterator.
- NumSegmentTotal: 6# The total number of Segments involved in the query.
- RawRowsRead: 7# The number of raw rows read in the Storage engine. See below for details.
- RowsBitmapIndexFiltered: 0# Only in V2, the number of rows filtered out using the Bitmap index.
- RowsBloomFilterFiltered: 0# Only in V2, the number of rows filtered out using the BloomFilter index.
- RowsKeyRangeFiltered: 0# Only in V2, the number of rows filtered out using the SortkeyIndex index.
- RowsStatsFiltered: 0# In V2, the number of rows filtered out using the ZoneMap index, includes deletion conditions. In V1, it also includes the number of rows filtered out using the BloomFilter.
- RowsConditionsFiltered: 0# Only in V2, the number of rows filtered out using various column indexes.
- RowsVectorPredFiltered: 0# The number of rows filtered by the vectorized conditional filter operation.
- TotalPagesNum: 30# Only in V2, the total number of Pages read.
- UncompressedBytesRead: 0.00# In V1, the size of the data file after decompression (If the file does not need to be decompressed, the file size is counted directly). In V2, only the sizes of Pages that did not hit the PageCache after decompression are counted (If a Page does not need to be decompressed, its size is counted directly)
- VectorPredEvalTime: 0ns # The time taken for a vectorized conditional filter operation.
Predicate push down and index usage can be inferred from the number of rows in the profile. The following only explains the profiles in the Segment V2 format data reading process. In the Segment V1 format, the meanings of these indicators are slightly different.
When reading a Segment in V2 format, if the query exists key_ranges (query range composed of prefix keys), it first filters data through the SortkeyIndex index, and the number of rows filtered is recorded in RowsKeyRangeFiltered.
Then, for columns with a bitmap index in the query conditions, use the Bitmap index for precise filtering, and the number of rows filtered is recorded in RowsBitmapIndexFiltered.
Afterwards, by the equality (eq, in, is) conditions in the query conditions, the BloomFilter index is used to filter data, which is recorded in RowsBloomFilterFiltered. The value of RowsBloomFilterFiltered is the difference between the total number of rows in the Segment (rather than the number of rows after the Bitmap index filtering) and the number of rows remaining after the BloomFilter filtering. Therefore, the data filtered by BloomFilter may overlap with the data filtered by Bitmap.
After that, it filters data using the ZoneMap index according to the query conditions and deletion conditions, which is recorded in RowsStatsFiltered.
RowsConditionsFiltered is the number of rows filtered by various indexes, including the value of RowsBloomFilterFiltered and RowsStatsFiltered.
At this point, the Init stage is completed, and the number of rows filtered by the Next stage deletion conditions is recorded in RowsDelFiltered. Therefore, the actual number of rows filtered by the deletion conditions is recorded in RowsStatsFiltered and RowsDelFiltered.
RawRowsRead is the final number of rows to be read after the above filtering.
RowsRead is the final number of rows returned to the Scanner. RowsRead is generally less than RawRowsRead because there may be a data aggregation from the Storage engine returned to the Scanner. If the difference between RawRowsRead and RowsRead is large, it indicates that many rows have been aggregated, and the aggregate operation may be time-consuming.
RowsReturned is the final number of rows returned by the ScanNode to the upper node. RowsReturned is usually less than RowsRead, because there are some predicate conditions on the Scanner that were not pushed to the Storage engine, so some additional filtering is carried out. If the difference between RowsRead and RowsReturned is large, it means many rows were filtered in the Scanner, indicating that many predicates with high selectivity were not pushed to the Storage engine. The filtering efficiency in the Scanner may be lower than that in the Storage engine.
Through the above indicators, we can roughly analyze the number of rows processed by the Storage engine and the final number of rows after filtering. By the Rows***Filtered set of indicators, it would also be possible to analyze whether the query conditions are pushed down to the Storage engine and the filtering effect of different indexes. Additionally, some simple analysis can be performed in the following aspects.
Many indicators under OlapScanner, such as IOTimer, BlockFetchTime, are cumulative to all Scanner thread indicators, so the values may be quite large. In addition, because Scanner threads read data asynchronously, these cumulative indicators only reflect the cumulative working time of the Scanner, not directly representing the processing time of the ScanNode. The proportion of time taken by the ScanNode in the entire query plan is the recorded value in the Active field. Sometimes, for example, IOTimer takes tens of seconds, while Active only takes several seconds. These situations are usually because:
IOTimer being the cumulative time of multiple Scanners and the number of Scanners being relatively high.
The upper node being more time-consuming. For instance, if the upper node takes 100 seconds while the underlying ScanNode only needs 10 seconds, the time for the Active field may only be several milliseconds. This is because the ScanNode asynchronously scans and prepares the data while the upper node is processing data. When the upper node accesses data from the ScanNode, it can access the data that has already been prepared, hence the Active time is short.
NumScanners represents the number of tasks submitted by the Scanner to the Thread Pool, scheduled by the Thread Pool in RuntimeState. The doris_scanner_thread_pool_thread_num and doris_scanner_thread_pool_queue_size parameters respectively control the size of the thread pool and the length of the queue. Too many or too few threads can affect query efficiency. You can also roughly estimate the time taken per thread by dividing some summarizing indicators by the number of threads.
TabletCount represents the number of tablets to be scanned. A high number could imply a need for a lot of random reads and data Merge operations.
UncompressedBytesRead indirectly reflects the amount of data read. If this value is large, it may indicate a lot of IO operations.
CachedPagesNum and TotalPagesNum can provide a glimpse into the PageCache hit situation. The higher the hit rate, the less time spent on IO and decompression operations.
Buffer pool
AllocTime: Time taken to allocate memory.
CumulativeAllocationBytes: Cumulative volume of memory allocated.
CumulativeAllocations: Cumulative number of memory allocations.
PeakReservation: The peak value of Reservation.
PeakUnpinnedBytes: The volume of unpin memory data.
PeakUsedReservation: The volume of memory used for Reservation.
ReservationLimit: The limit volume of Reservation for BufferPool.