Concurrency refers to the number of requests that can be processed by a function concurrently at a moment. If it can be sustained by other services of your business, you can increase the function concurrency from several to tens of thousands with simple configuration.
Use Cases
High QPS and short execution duration
A function can be used for simple data or file processing; for example, it can be triggered by COS to report information or process files. In such scenarios, the execution duration of a single request is short.
Computation-Intensive long execution
A function can be used in audio/video transcoding, data processing, and AI-based interference. Due to various operations such as model loading, the function initialization/execution and Java runtime environment initialization take more time.
Async message processing
A function can be used for async message processing in diverse scenarios, such as Tencent Cloud's proprietary WYSIWYG recording and TDMQ function trigger. It can connect the data at both ends of the message queue to the greatest extent and help implement the async event decoupling and peak shifting capabilities under the serverless system.
Strengths
By using reserved quota and provisioned concurrency together, you can flexibly allocate resources among multiple functions and warm up functions as needed.
Shared quota
If nothing is configured, all functions share the account quota by default. If a function generates a surge of business invocations, it can make full use of the unused quota to ensure that the surge will not cause overrun errors.
Guaranteed concurrency
If the business features of a specific function are sensitive or critical, and you need to do your best to ensure a high request success rate, then you can use the reserved quota feature to this end. Reserved quota can give the function exclusive quota to guarantee the concurrency reliability and avoid overruns caused by concurrency preemption by multiple functions.
Provisioned concurrency
If a function is sensitive to cold start, the code initialization process takes a long time, or many libraries need to be loaded, then you can set the provisioned concurrency for a specific function version to start function instances in advance and ensure smooth execution.
How Concurrency Expansion Works
For more information on concurrent instance reuse and repossession and concurrency expansion, please see Concurrency Overview. Samples
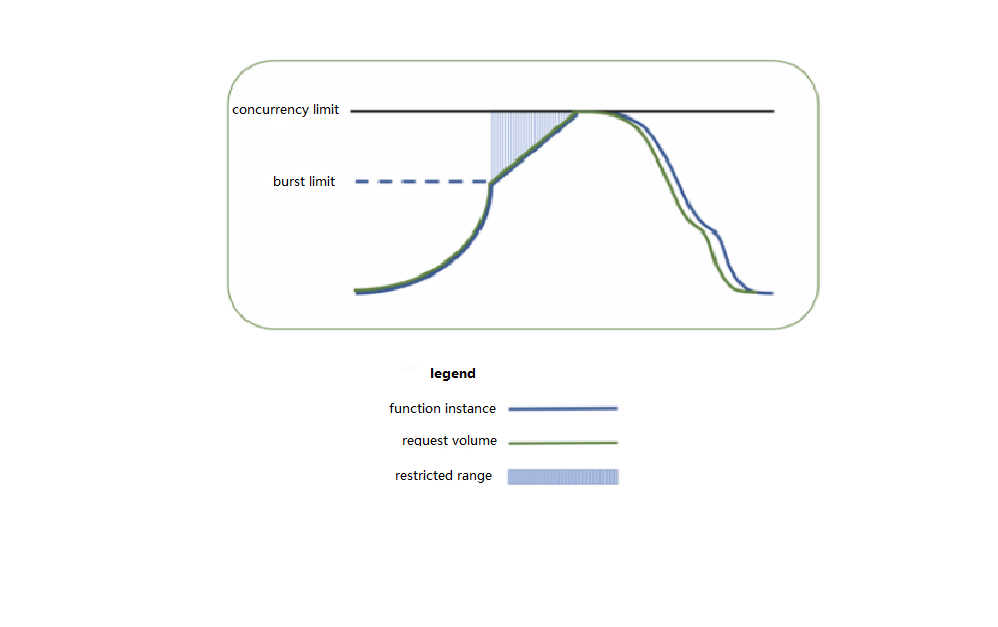
For example, the concurrency quota of an account in the Guangzhou region is 1,000 concurrent instances by default for a 128 MB function, and if many requests arrive, 500 concurrent instances can be started from 0 in the first minute. If there are still other requests to be processed, 500 more concurrent instances can be started to reach 1,000 instances in total in the second minute.
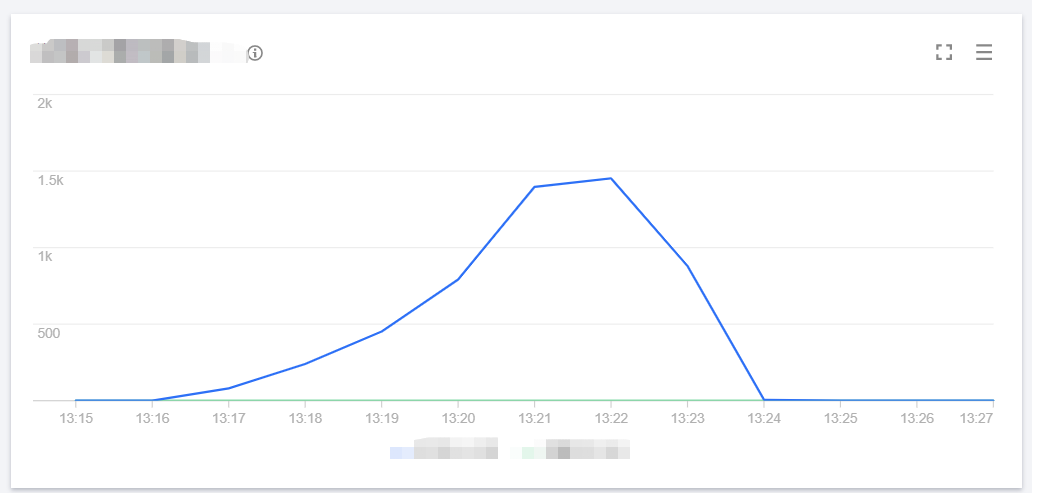
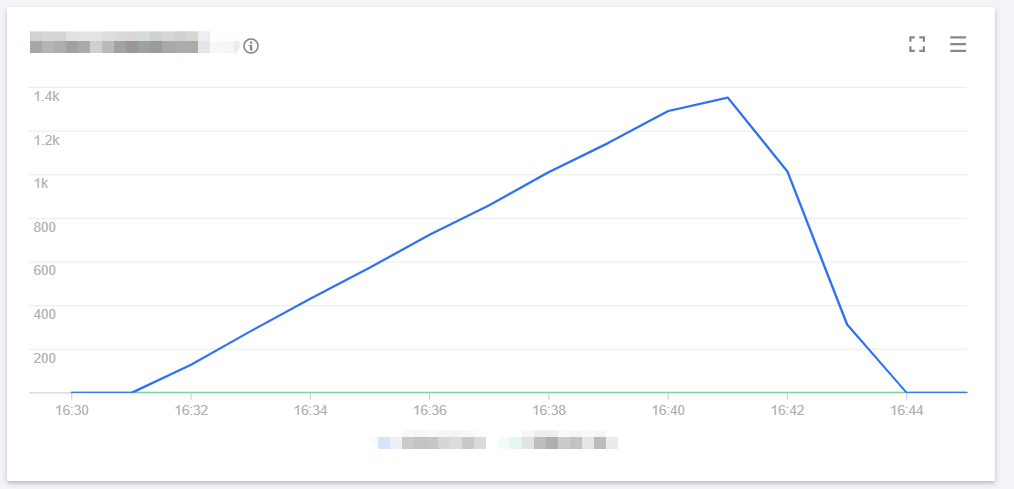
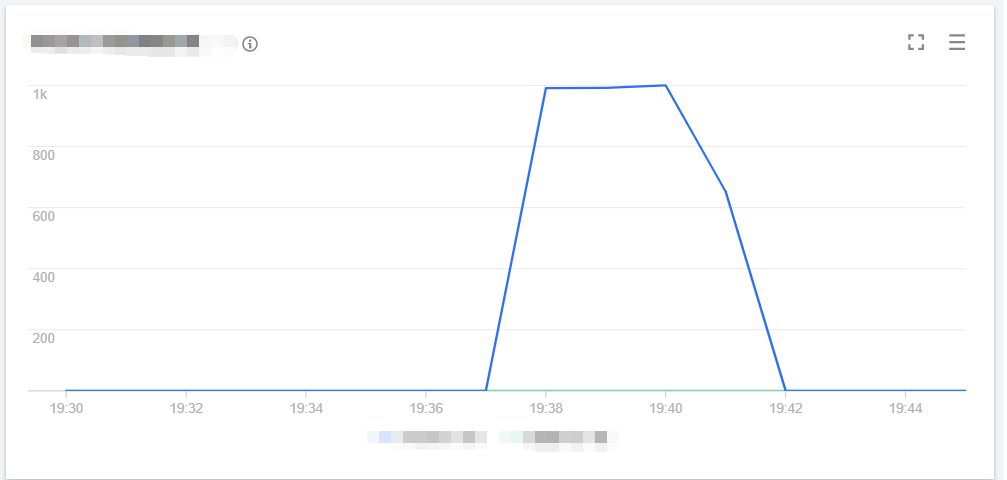
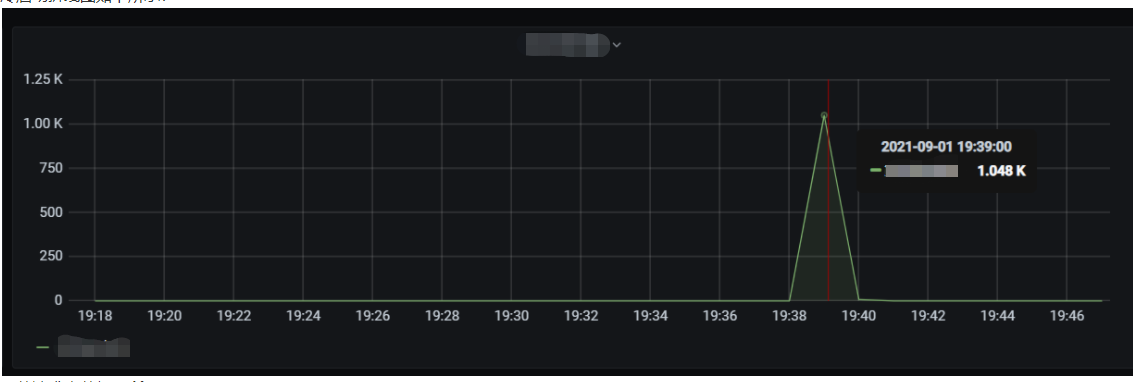
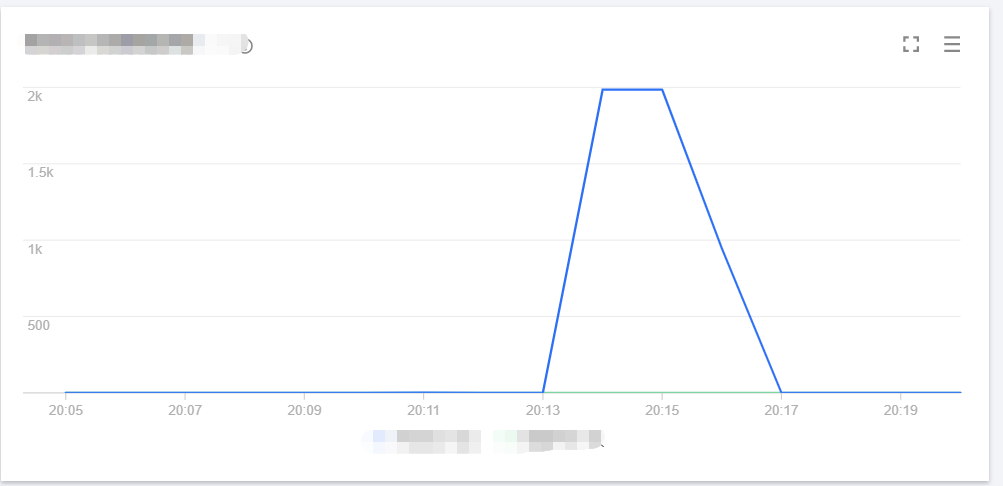
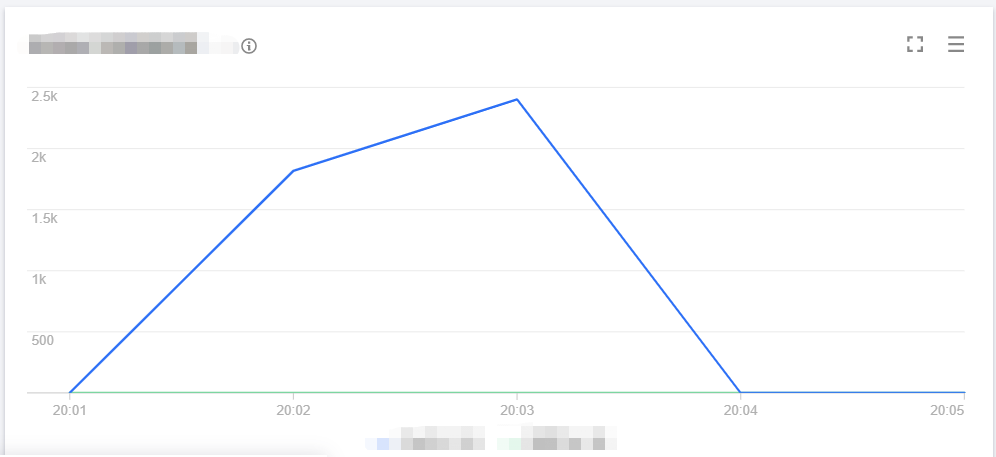
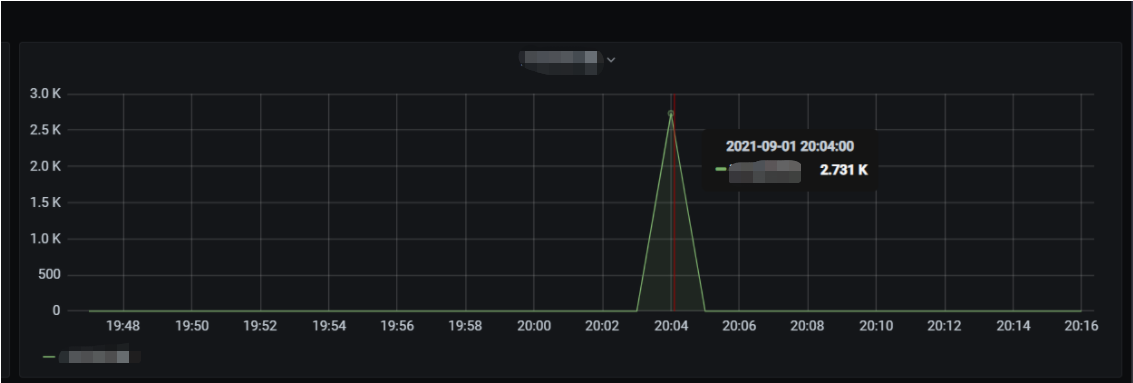
The following figure simulates the specific concurrent processing scenario of a function during business traffic peaks. As business requests constantly increase and there are no concurrent instances available to process new requests, the function will start new concurrent instances. When the expansion speed limit of elastic concurrency is reached, function expansion will gradually slow down, and new requests will be restricted and retried. Then, the function will continue expansion and eventually reach the account-level concurrency limit in the current region. Finally, after the business needs are satisfied, the number of requests will gradually decrease, and the unused concurrent instances of the function will gradually stop.
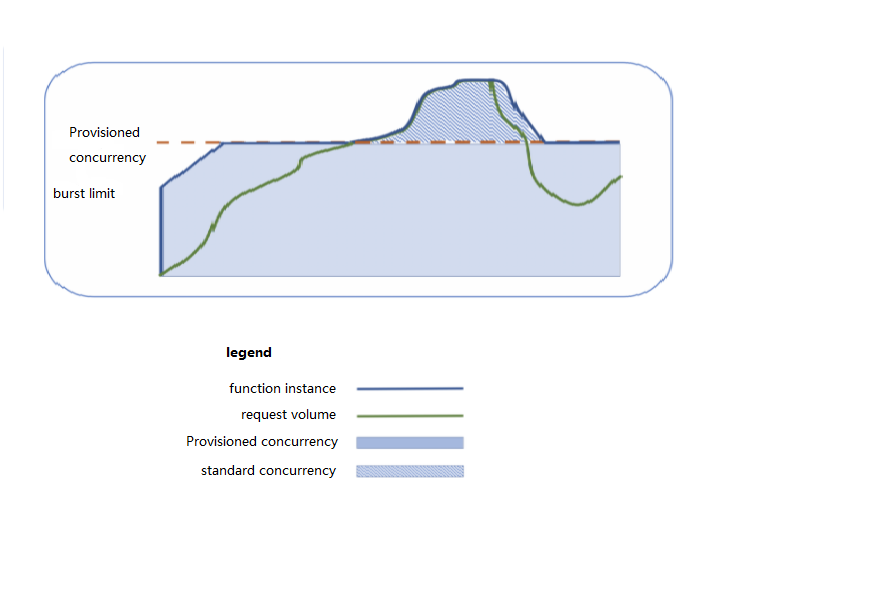
Provisioned concurrency can start concurrent instances in advance according to the configuration. SCF will not repossess these instances; instead, it will ensure as much as possible that a sufficient number of concurrent instances are available to process requests. You can use this feature to set the quota of provisioned concurrent instances for a specified function version, so as to prepare computing resources in advance and expedite cold start and initialization of the runtime environment and business code. The following figure simulates the actual provisioned concurrency conditions of a function when handling business traffic peaks.
Use Case-Based Stress Tests
Use case 1. High QPS and short execution duration
In this scenario, the QPS is high, the execution duration of a single request is short, and the business experiences a concurrency peak in one or two seconds after cold start. Next, you can carry out tests and observe whether gradually switching traffic or configuring provisioned concurrency can ease the cold start concurrency peak.
Business conditions
|
Function initialization duration | The function doesn't require initialization |
Business execution duration | |
| |
Stress test task
We plan three stress test tasks for complete cold start, gradual traffic switch, and provisioned concurrency configuration respectively.
Each stress test task needs to start from cold start with no hot instances and impact of other functions present.
Stress test goal
The business with a high QPS experiences a concurrency peak in one or two seconds after cold start, and gradually switching traffic or configuring provisioned concurrency can ease the cold start concurrency peak.
Stress test configuration
a. Memory: 128 MB, with async execution, status tracking, and log delivery disabled b. Concurrency quota: 4,000 * 128 MB c. Duration: 5 ms d. Burst: 2,000 |
Directly call the `RegionInvoke` API with the `go-wrk` tool. |
Complete cold start
Start 2,000 concurrent requests on the client, call the API 2,000 * 5,000 times, and collect the statistics of concurrent executions and cold start concurrency.
Performance
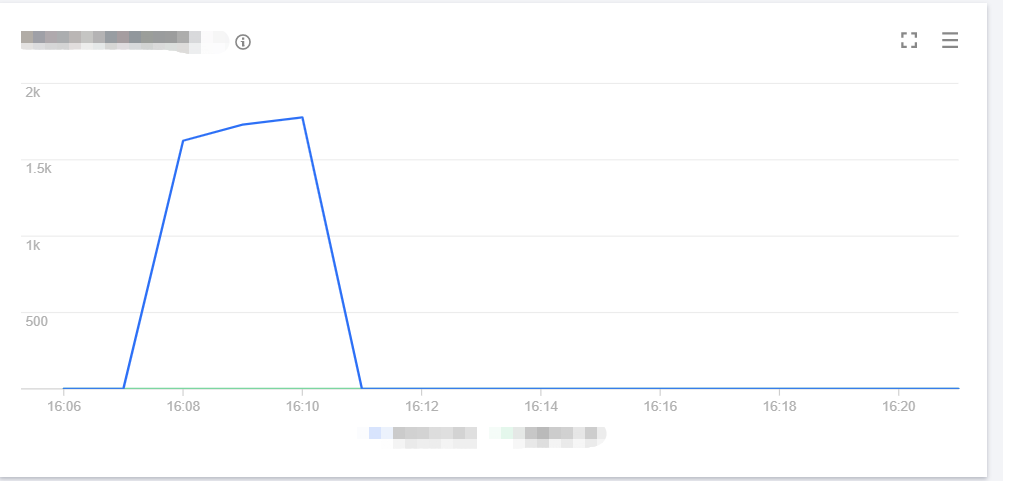
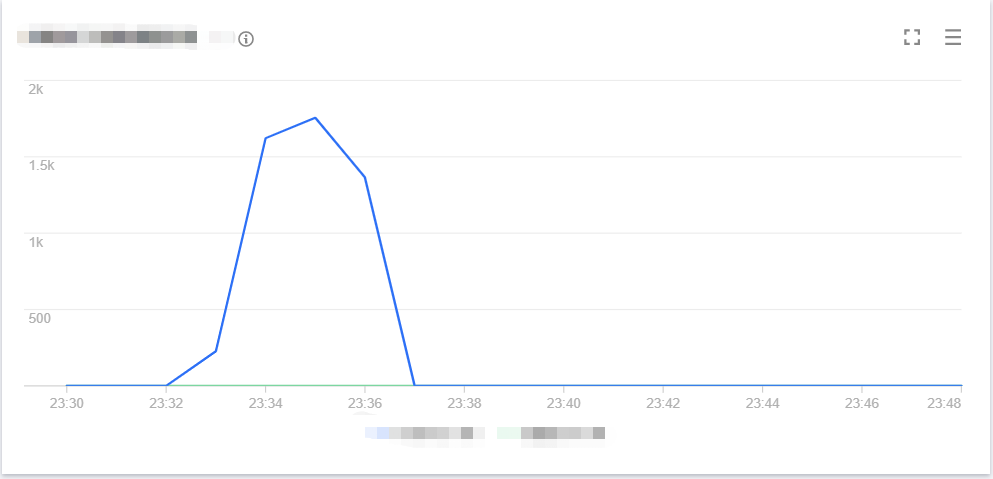
The number of concurrent executions of the function is as shown below, and the entire concurrency expansion and reduction process is completed within 3 minutes.
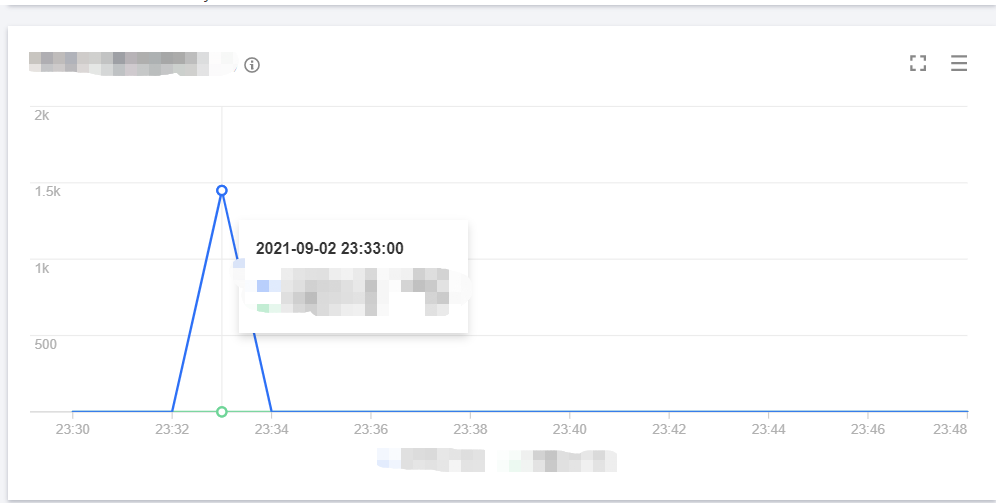
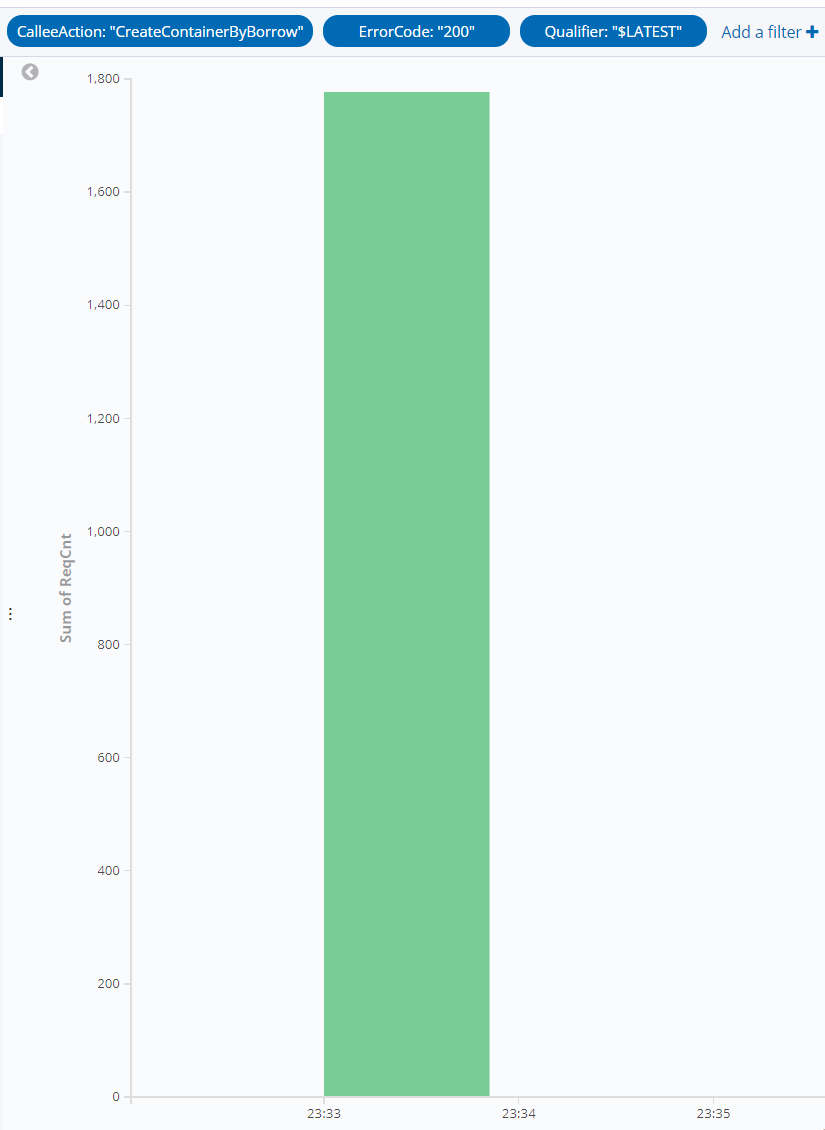
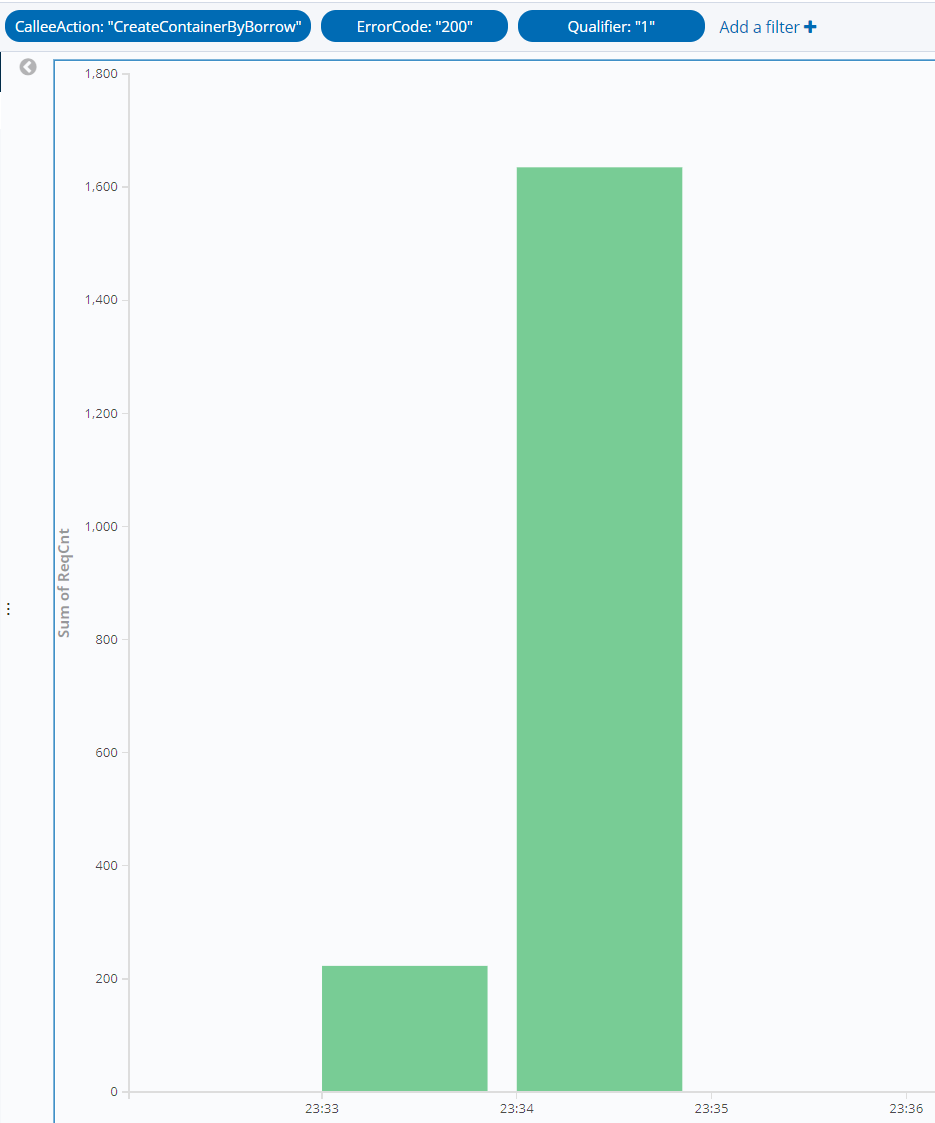
The cold start data of the function is as shown below. Concurrent instances can be started instantly and reach the set cold start limit for the burst of 2,000 within 1 minute.
In this scenario, the average QPS reaches around 60,000, concurrent instances are started instantly within 1 minute, the cold start limit for the burst is normal, and the entire concurrency expansion and reduction process is completed within 3 minutes.
Gradual traffic switch after new version release
Start 2,000 concurrent requests on the client and call the API 2,000 * 5,000 times.
Increase the request concurrency of the new version from 0 to 1,000 and then to 2,000, reduce the concurrency of the old version from 2,000 to 1,000 and then to 0, and collect the statistics of the concurrency count and cold start concurrency of the new and old versions.
Performance
The line chart of concurrency on the old version is as shown below:
The line chart of concurrency on the new version is as shown below:
The line chart of cold start on the old version is as shown below:
The line chart of cold start on the old version is as shown below:
As can be seen from the above data, the sudden concurrency peak can be lowered by gradually publishing versions to switch traffic. Provisioned concurrency configuration
Provision 2,000 concurrent instances for the function.
After the provisioned instances are launched successfully, start 2,000 requests and call the API 5,000 times and collect the statistics of the concurrency count and cold start concurrency.
Performance
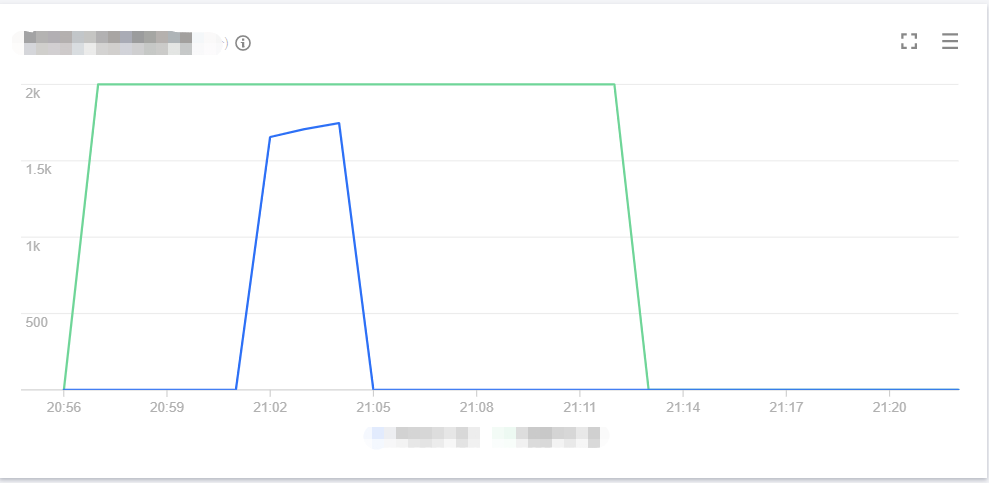
The line chart of concurrency is as shown below:
Cold start concurrency is as shown below:
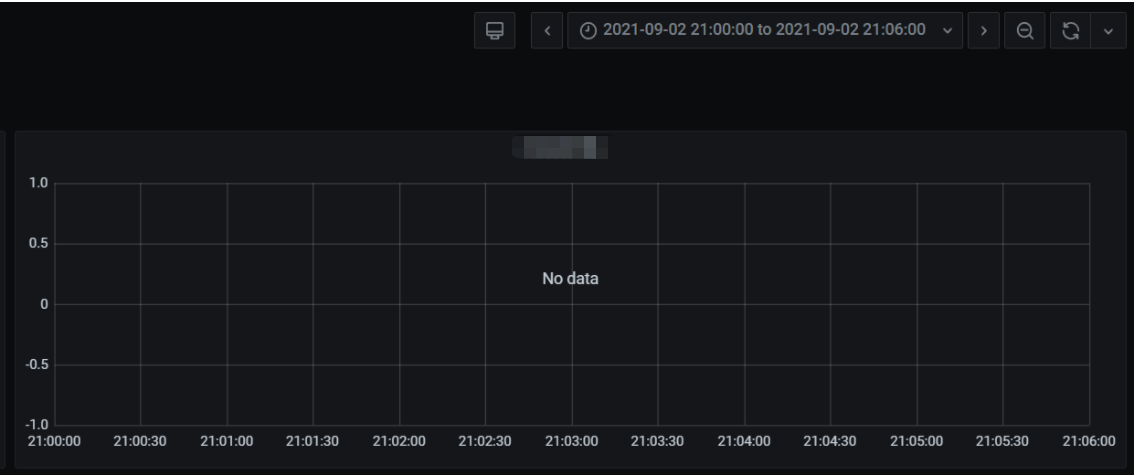
As can be seen, the number of cold starts in the entire range is 0.
The number of function requests is as shown below:
As can be seen from the above data, the number of concurrent cold starts can be reduced to zero by configuring provisioned instances. We recommend you configure provisioned concurrency to guarantee the performance and avoid lengthy initialization. Conclusion
In summary, in scenarios with high QPS and short execution duration, gradually switching traffic can ease the cold start concurrency peak, and configuring provisioned concurrency can address the problem of lengthy initialization (including cold function start).
Use case 2. Computation-intensive long execution
Business conditions
|
Function initialization duration | |
Business execution duration | |
| |
Stress test goal
The average QPS of the lengthy computing tasks is not high, but due to the lengthy computation process, a high number of instances are running, leading to a high function concurrency. This stress test scenario is designed to test the task scheduling and processing speeds of the function when processing a high number of lengthy execution tasks.
Stress test configuration
a. Memory: 128 MB, with async execution and status tracking enabled but log delivery disabled b. Concurrency quota: 2,000 * 128 MB c. Duration: 2m d. Burst: 2,000 |
Use the ab tool to simulate messages in COS and invoke the function through a COS trigger. |
Stress test task
Each stress test task needs to start from cold start with no hot instances and impact of other functions present.
Deliver 1 message for each concurrent instance in a scenario involving a lengthy initialization and execution duration
Start 2,000 concurrent instances, each of which delivers 1 message (2,000 requests in total). Collect the statistics of the start time when the first request arrives, end time when the last request returns, and distribution of the total processing time of the requests.
Performance
The line chart of concurrency is as shown below:
The line chart of cold start is as shown below:
The number of function requests is as shown below:
Why are not all cold starts completed in the same minute?
a. In an async scenario, the number of requests does not reach RegionInvoke at the same time; instead, RegionInvoke is invoked through the worker of the async trigger.
b. The function duration is 2 minutes and the initialization process takes 10 seconds, amounting to below 3 minutes; therefore, as the number of function requests continuously increases but the previously started containers have not been released, it is necessary to keep starting containers to complete the requests. As a result, the rate of increase in the number of function requests per minute is basically consistent with the number of cold starts.
c. The number of cold starts begins to drop when the function concurrency reaches the peak, which is generally normal.
Deliver 2 messages for each concurrent instance in a scenario involving a lengthy initialization and execution duration
Start 2,000 concurrent instances, each of which delivers 2 messages (4,000 requests in total). Collect the statistics of the start time when the first request arrives, end time when the last request returns, and distribution of the total processing time of the requests.
Performance
The line chart of concurrency is as shown below:
The line chart of cold start is as shown below:
The number of function requests is as shown below:
Result analysis
The case with 4,000 messages can better demonstrate the conclusion drawn in the case of 2,000 messages. Because the previous function is not released in the first two seconds, the number of cold starts is the same as the number of function requests, and subsequently, the increase in the number of cold starts and the increase in the number of function requests are generally consistent.
Conclusion
Business involving a lengthy initialization and execution duration can run stably, and the system can scale instantly based on the number of requests.
Use case 3. Async message processing
Business background
SCF functions are widely used for async message processing. Here, the execution duration of 100 ms is used as the average value.
|
Function initialization duration | |
Business execution duration | |
Stress test goal
The consumption of async messages is related to production. Suppose a high number of messages have been retained. View the consumption of the function, including the retries during consumption due to concurrency overrun. You can flexibly adjust the reserved concurrency of the function to control its consumption speed, i.e., the stress on the downstream backend.
Stress test configuration
a. Memory: 128 MB, with async execution and status tracking enabled but log delivery disabled b. Concurrency quota: X * 128 MB c. Duration: 100 ms d. Burst: 2,000 |
Use the ab tool to simulate messages in COS and invoke the function through a COS trigger. |
Stress test task
Each stress test task needs to start from cold start with no hot instances present.
1,000 concurrent instances for async messages
Reserve 1,000 concurrent instances for the function, deliver 1,000,000 messages for consumption, record the total consumption time and the distribution of message processing, and monitor the concurrency.
Performance
The line chart of concurrency is as shown below:
The line chart of cold start is as shown below:
The number of function requests is as shown below:
All messages are processed in 3 minutes. 2,000 concurrent instances for async messages
Reserve 2,000 concurrent instances for the function, deliver 1,000,000 messages for consumption, record the total consumption time and the distribution of message processing, and monitor the concurrency.
Performance
The line chart of concurrency is as shown below:
The line chart of cold start is as shown below:
The number of function requests is as shown below:
All messages are processed in 2 minutes. 4,000 concurrent instances for async messages
Reserve 4,000 concurrent instances for the function, deliver 1,000,000 messages for consumption, record the total consumption time and the distribution of message processing, and monitor the concurrency.
Performance
The line chart of concurrency is as shown below:
The line chart of cold start is as shown below:
The dashboard displays the cold function start data, which overruns the burst.
The number of function requests is as shown below:
All messages are processed in 1 minute. Result analysis
1. When the concurrency quota is increased from 1,000 to 2,000, it can be seen that the processing speed of the function, including function concurrency, increases significantly; therefore, when there are many async messages, increasing the concurrency quota can increase the message processing speed.
2. When the concurrency quota is increased from 2,000 to 4,000, the message processing speed and function concurrency also increase, but the overall processing time is also below 2m, which indicates that when there are 1,000,000 async messages, the 4,000 quota value certainly can increase the message processing speed and function concurrency, but the 2,000 quota value can basically meet the needs in the scenario.
3. The burst of 2,000 will be overrun when the concurrency quota is 4,000 and there are a high number of messages.
Conclusion
In scenarios involving high numbers of async messages, increasing the function concurrency quota can significantly increase the message processing speed, which is in line with the expectations.
You can flexibly control function concurrency so as to control the consumption speed of async messages.
Notes
Provisioned concurrency is available free of charge during the beta test. This feature is expected to be officially launched in November 2021, and small fees will be charged when provisioned concurrent instances are idle, and fees will be charged based on the actual execution duration of requests when they process requests. For more information, please see Billing Overview. 


