- Release Notes and Announcements
- Product Introduction
- Purchase Guide
- Quick Start
- Cloud Product Monitoring
- Tencent Cloud Service Metrics
- TKE
- Microservice
- On-cloud network
- CVM
- CBS
- TencentDB
- TencentDB for SQL Server Monitoring Metrics
- TencentDB for MySQL Monitoring Metrics
- TencentDB for Redis Monitoring Metrics
- TencentDB for MongoDB Monitoring Metrics
- TencentDB for PostgreSQL Monitoring Metrics
- TDSQL-C for MySQL Monitoring Metrics
- TencentDB for TcaplusDB Monitoring Metrics
- TencentDB for MariaDB Monitoring Metrics
- TDSQL for MySQL Monitoring Metrics (Legacy)
- TDSQL for MySQL Monitoring Metrics
- SCF
- CKafka
- TDMQ
- CLB
- COS
- CFS
- CPM
- ECM
- CDN And EdgeOne
- Direct Connect
- GAAP
- CMQ
- Elasticsearch
- WAF
- CLS
- Data Analysis
- CVM Agents
- Tencent Cloud Service Metrics
- Operation Guide
- Prometheus Monitoring
- Mobile App Performance Monitoring
- Practical Tutorial
- API Documentation
- History
- Introduction
- API Category
- Making API Requests
- Alarm APIs
- DescribeAlarmPolicies
- DescribeAlarmMetrics
- DescribeAlarmHistories
- CreateAlarmPolicy
- DeleteAlarmPolicy
- DescribeAlarmPolicy
- ModifyAlarmPolicyStatus
- SetDefaultAlarmPolicy
- BindingPolicyObject
- UnBindingPolicyObject
- UnBindingAllPolicyObject
- ModifyAlarmPolicyCondition
- ModifyAlarmPolicyNotice
- ModifyAlarmPolicyTasks
- DescribeMonitorTypes
- DescribeAllNamespaces
- DescribeAlarmEvents
- DescribeBindingPolicyObjectList
- ModifyAlarmPolicyInfo
- DescribeConditionsTemplateList
- Notification Template APIs
- Monitoring Data Query APIs
- Legacy Alert APIs
- Prometheus Service APIs
- DescribePrometheusInstanceUsage
- DescribeServiceDiscovery
- CreateServiceDiscovery
- UpdateAlertRuleState
- UpdateAlertRule
- DescribeAlertRules
- DeleteAlertRules
- CreateAlertRule
- DescribePrometheusInstances
- UpgradeGrafanaDashboard
- UpdatePrometheusScrapeJob
- UpdatePrometheusAgentStatus
- UpdateExporterIntegration
- UninstallGrafanaDashboard
- UnbindPrometheusManagedGrafana
- TerminatePrometheusInstances
- ModifyPrometheusInstanceAttributes
- GetPrometheusAgentManagementCommand
- DestroyPrometheusInstance
- DescribePrometheusScrapeJobs
- DescribePrometheusAgents
- DescribeExporterIntegrations
- DeletePrometheusScrapeJobs
- DeleteExporterIntegration
- CreatePrometheusScrapeJob
- CreatePrometheusAgent
- CreateExporterIntegration
- BindPrometheusManagedGrafana
- UpdateRecordingRule
- DescribeRecordingRules
- DeleteRecordingRules
- CreateRecordingRule
- CreatePrometheusMultiTenantInstancePostPayMode
- DescribePrometheusZones
- Grafana Service APIs
- UpgradeGrafanaInstance
- UpdateSSOAccount
- UpdateGrafanaWhiteList
- UpdateGrafanaNotificationChannel
- UpdateGrafanaIntegration
- UpdateGrafanaEnvironments
- UpdateGrafanaConfig
- UpdateDNSConfig
- UninstallGrafanaPlugins
- ResumeGrafanaInstance
- ModifyGrafanaInstance
- InstallPlugins
- EnableSSOCamCheck
- EnableGrafanaSSO
- EnableGrafanaInternet
- DescribeSSOAccount
- DescribeInstalledPlugins
- DescribeGrafanaWhiteList
- DescribeGrafanaNotificationChannels
- DescribeGrafanaIntegrations
- DescribeGrafanaInstances
- DescribeGrafanaEnvironments
- DescribeGrafanaConfig
- DescribeDNSConfig
- DeleteSSOAccount
- DeleteGrafanaNotificationChannel
- DeleteGrafanaIntegration
- DeleteGrafanaInstance
- CreateSSOAccount
- CreateGrafanaNotificationChannel
- CreateGrafanaIntegration
- CreateGrafanaInstance
- CleanGrafanaInstance
- DescribeGrafanaChannels
- Event Center APIs
- TencentCloud Managed Service for Prometheus APIs
- CheckIsPrometheusNewUser
- CreatePrometheusTemp
- CreatePrometheusAlertPolicy
- CreatePrometheusClusterAgent
- CreatePrometheusGlobalNotification
- DeletePrometheusTemp
- DeletePrometheusTempSync
- DeletePrometheusAlertPolicy
- DeletePrometheusClusterAgent
- DescribePrometheusAgentInstances
- DescribePrometheusAlertPolicy
- DescribePrometheusInstanceDetail
- DescribePrometheusClusterAgents
- DescribePrometheusInstanceInitStatus
- DescribePrometheusGlobalConfig
- DescribePrometheusInstancesOverview
- DescribePrometheusGlobalNotification
- DescribePrometheusRecordRules
- DescribePrometheusTemp
- DescribePrometheusTempSync
- DescribePrometheusTargetsTMP
- ModifyPrometheusTemp
- ModifyPrometheusAgentExternalLabels
- ModifyPrometheusAlertPolicy
- ModifyPrometheusGlobalNotification
- RunPrometheusInstance
- DescribeClusterAgentCreatingProgress
- SyncPrometheusTemp
- Monitoring APIs
- Data Types
- Error Codes
- Troubleshooting
- FAQs
- Alarm Management
- Documentation Guide
- Policy
- Glossary
This document describes the use cases and operations directions of bar charts.
Use Cases
Bar chart: is applicable to the comparison between metrics in each statistical period.
Configuration effects of bar charts: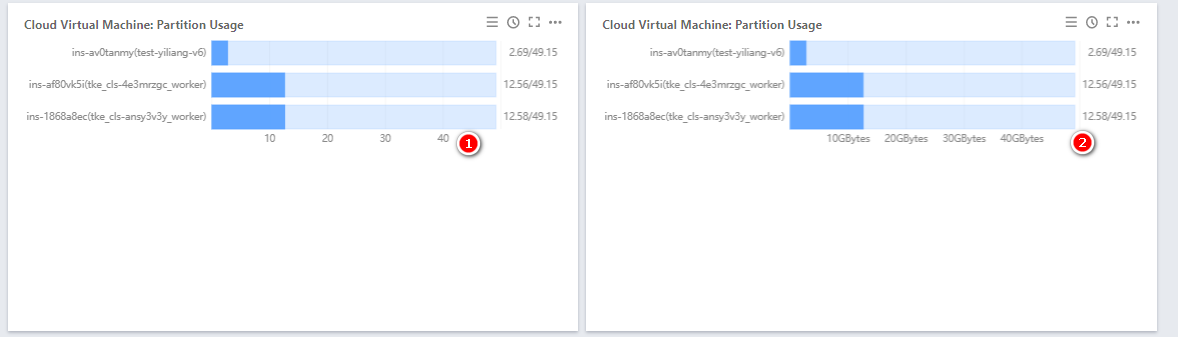
Directions
1. Log in to the Tencent Cloud Observability Platform console and click Dashboard > Default Dashboard on the left sidebar.
2. Click 
3. In the chart configuration section, select “Bar Chart” as the chart type.
4. (Optional) Under “Chart Elements,” you can specify whether to display units. For more information on the meanings of units, see List of Units.
5. After the configuration is completed, click Save in the upper-right corner.

 はい
はい
 いいえ
いいえ
この記事はお役に立ちましたか?