Network issues are analyzed using metrics such as Throughput, Requests, Network Response Time, Slow Request Proportion, HTTP Error Rate, Network Error Rate, and TCP Connection Establishment Time.
2. In the left navigation bar, select Mobile App Performance Monitoring > Network, You can check network issue analysis from multiple dimensions such as business system, app, and time range.
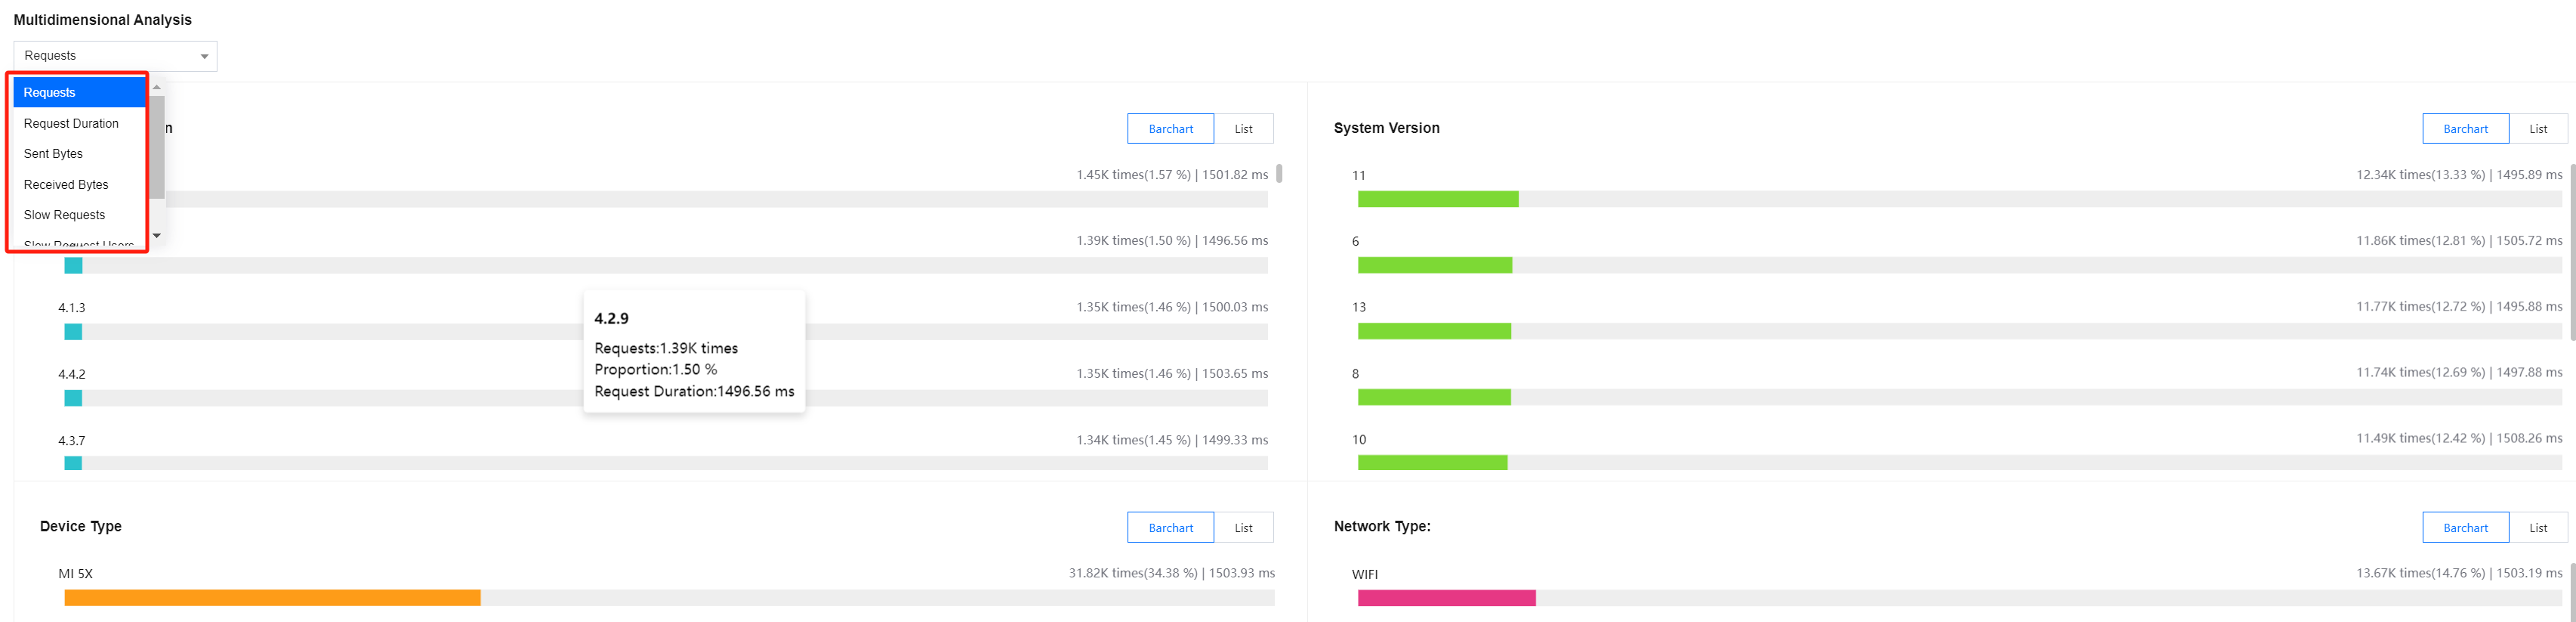
Multidimensional Analysis
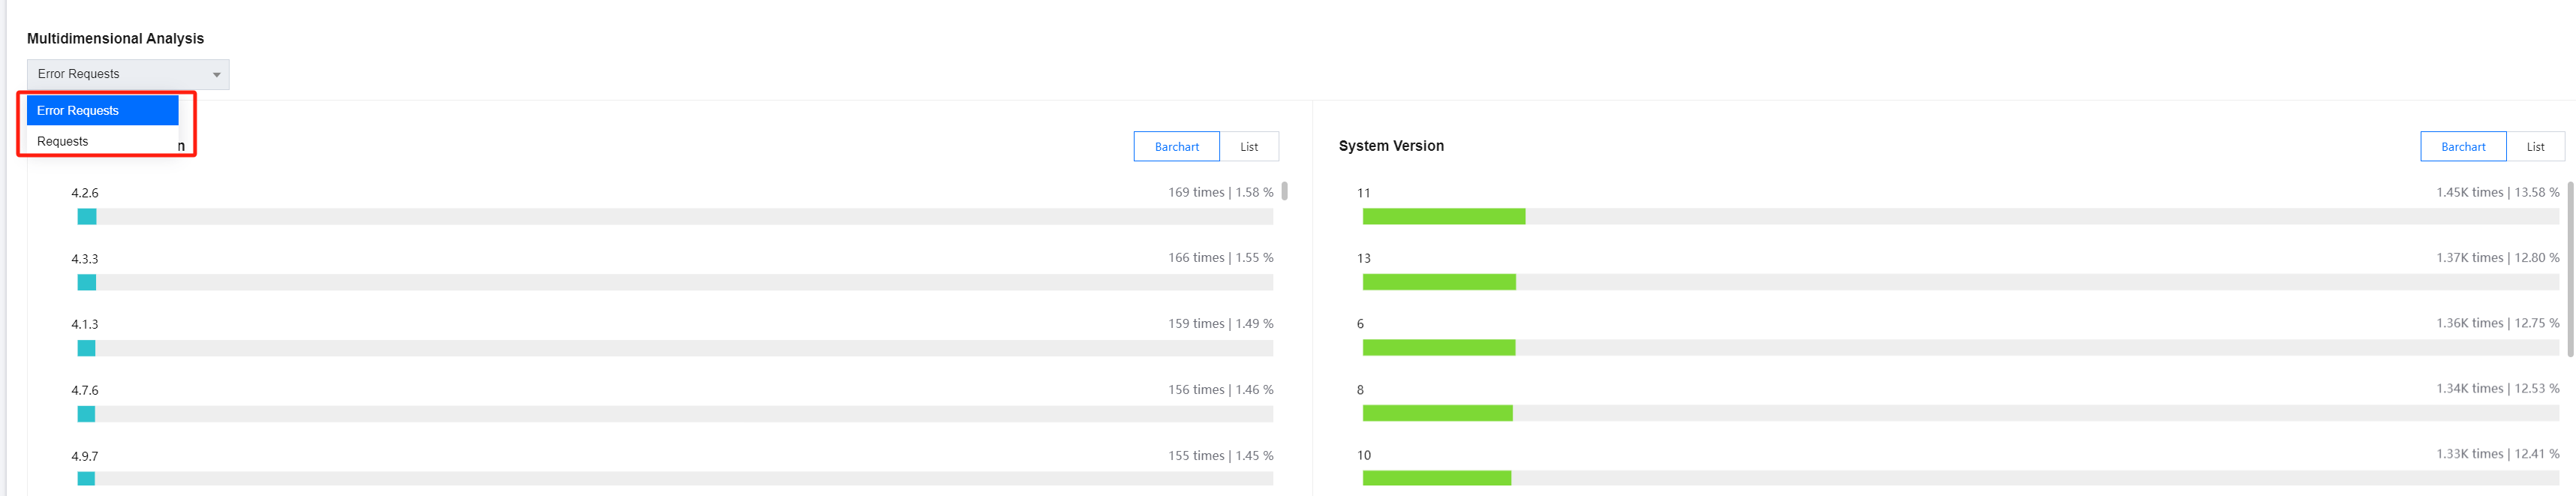
The multidimensional analysis page shows the analysis of key metrics from multiple dimensions such as app version, system version, domain name, URL, device type, network type, region, and internet service provider. It facilitates targeted root cause analysis of specific slow/error requests.
Slow Requests
Error Requests
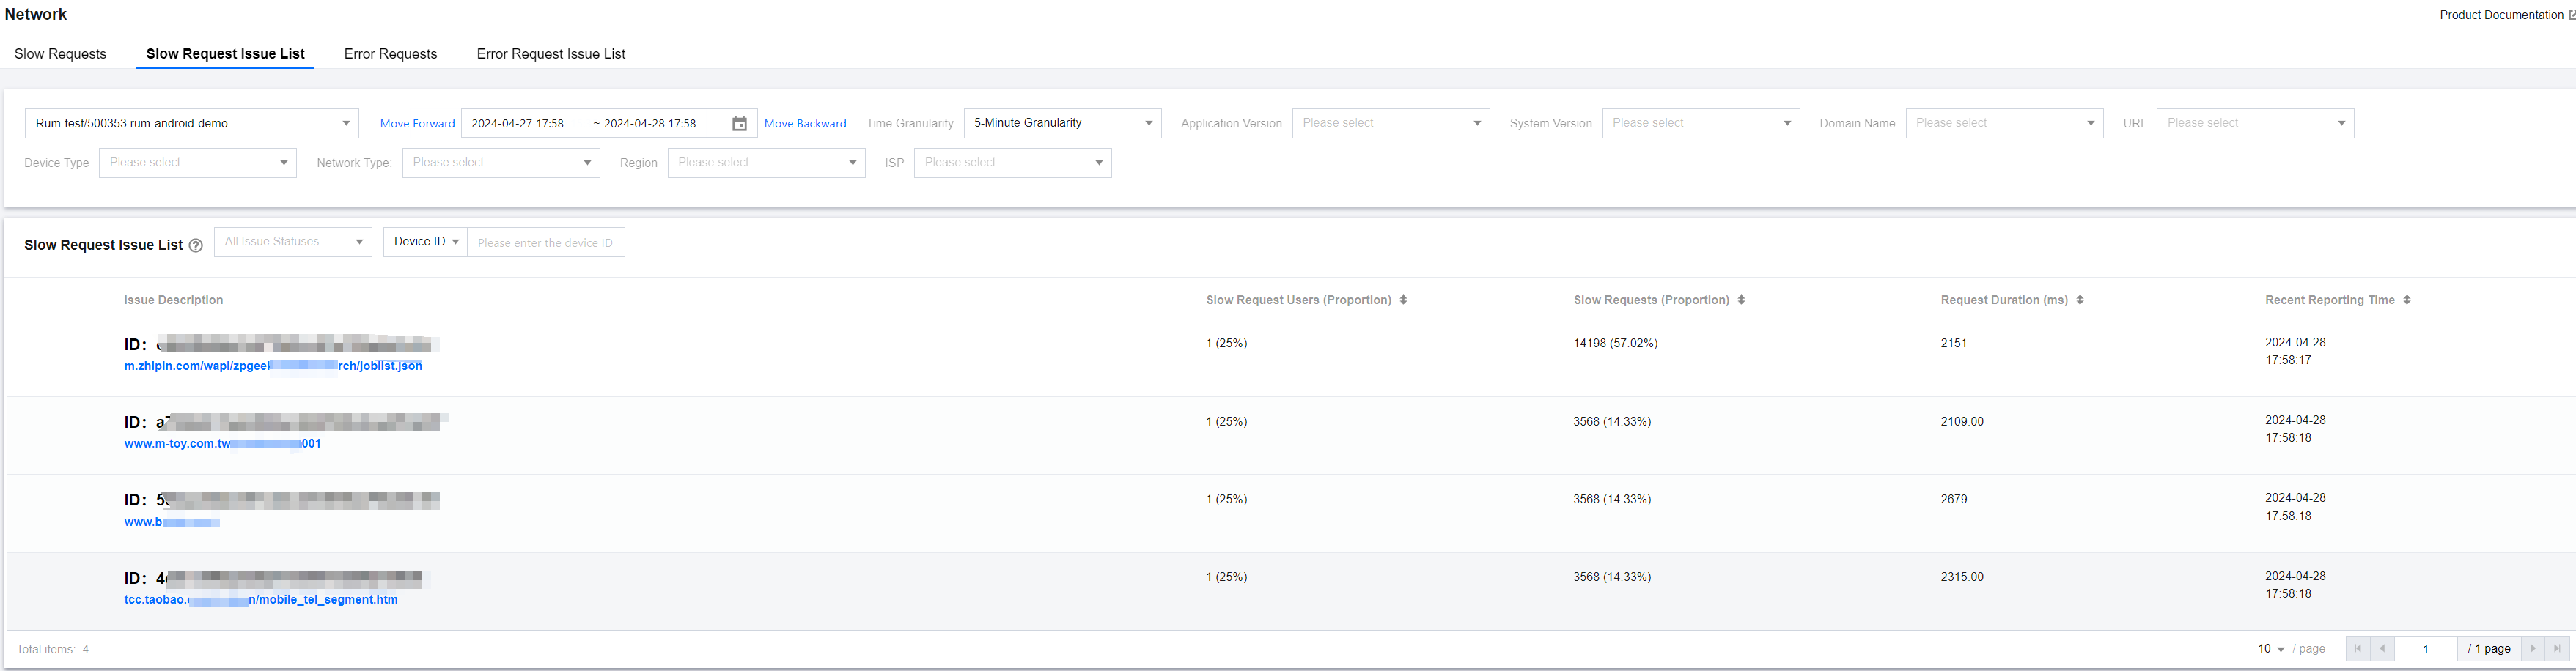
Slow Request Issue List
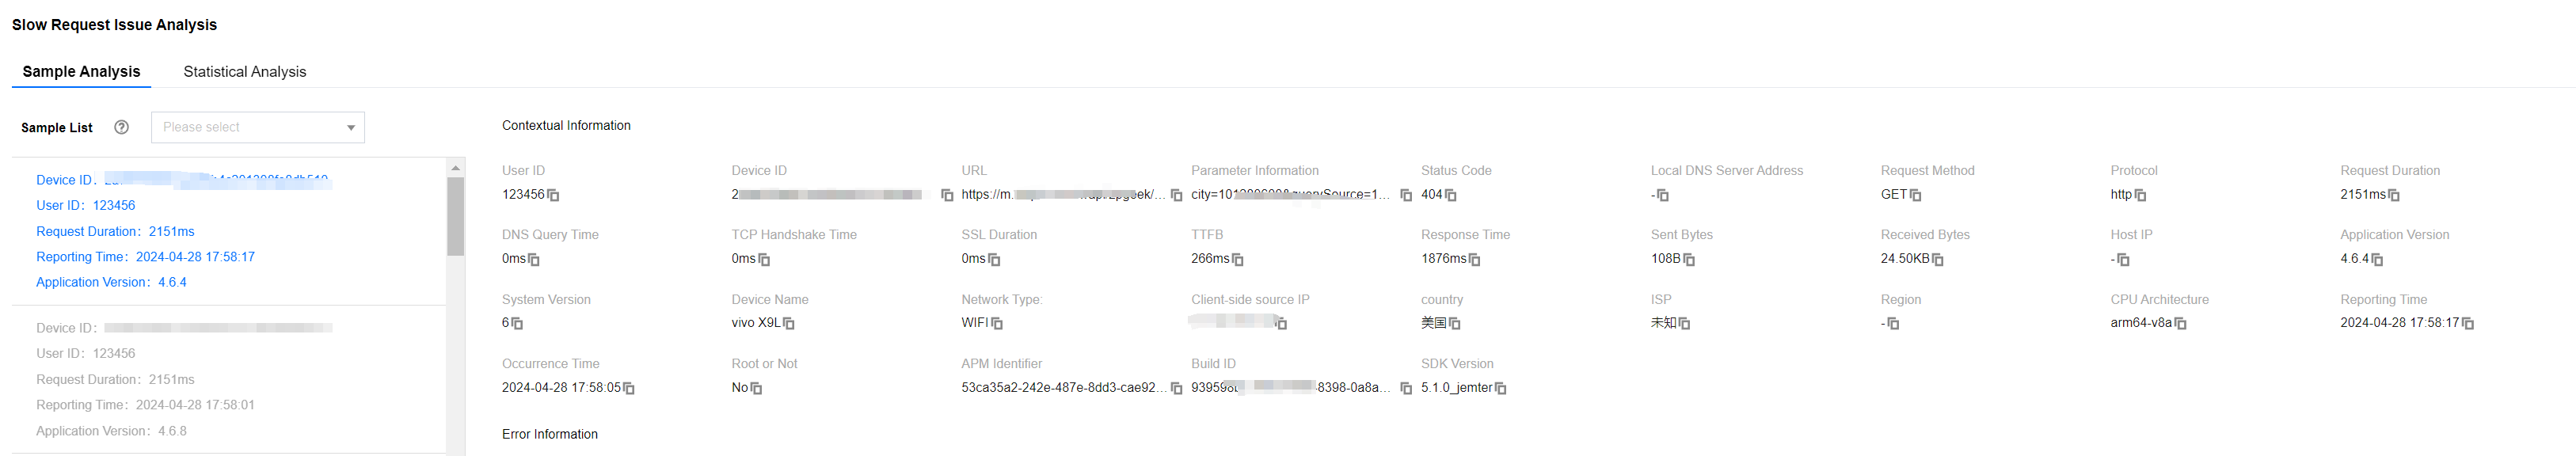
The slow request list shows slow requests of all devices. You can quickly filter slow-loading devices by issue type, device ID, specific function, or file name. You can also click the related link under Issue Description to view details of slow requests and pinpoint the root cause of slow app requests.
An HTTP request sample is considered a slow request if the transmitted data is over 50 KB and the transfer speed is below 10 KB/s, or if the transmitted data is 50 KB or less and the response time is over 2s. Slow request samples will be shown in the issue list.
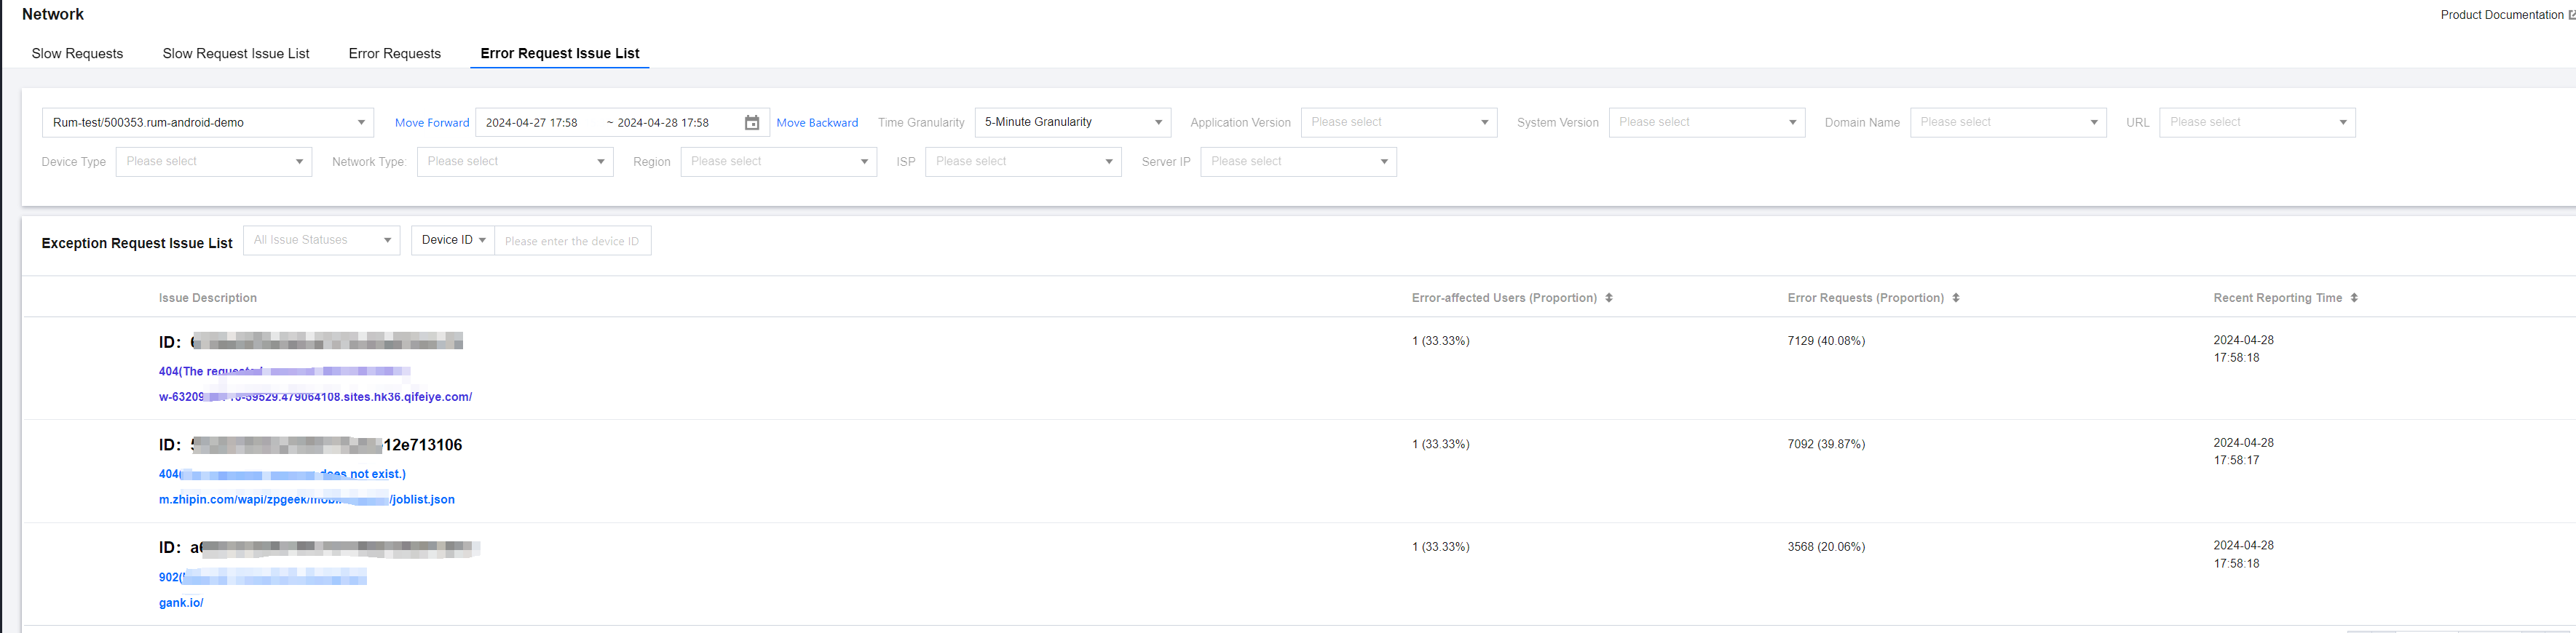
Error Request Issue List
Network errors such as HTTP request errors, DNS resolution errors, failure to establish connection, and connection timeout will be displayed in the error request list. You can click the related link under Issue Description to view error request details and pinpoint the root cause of error requests.
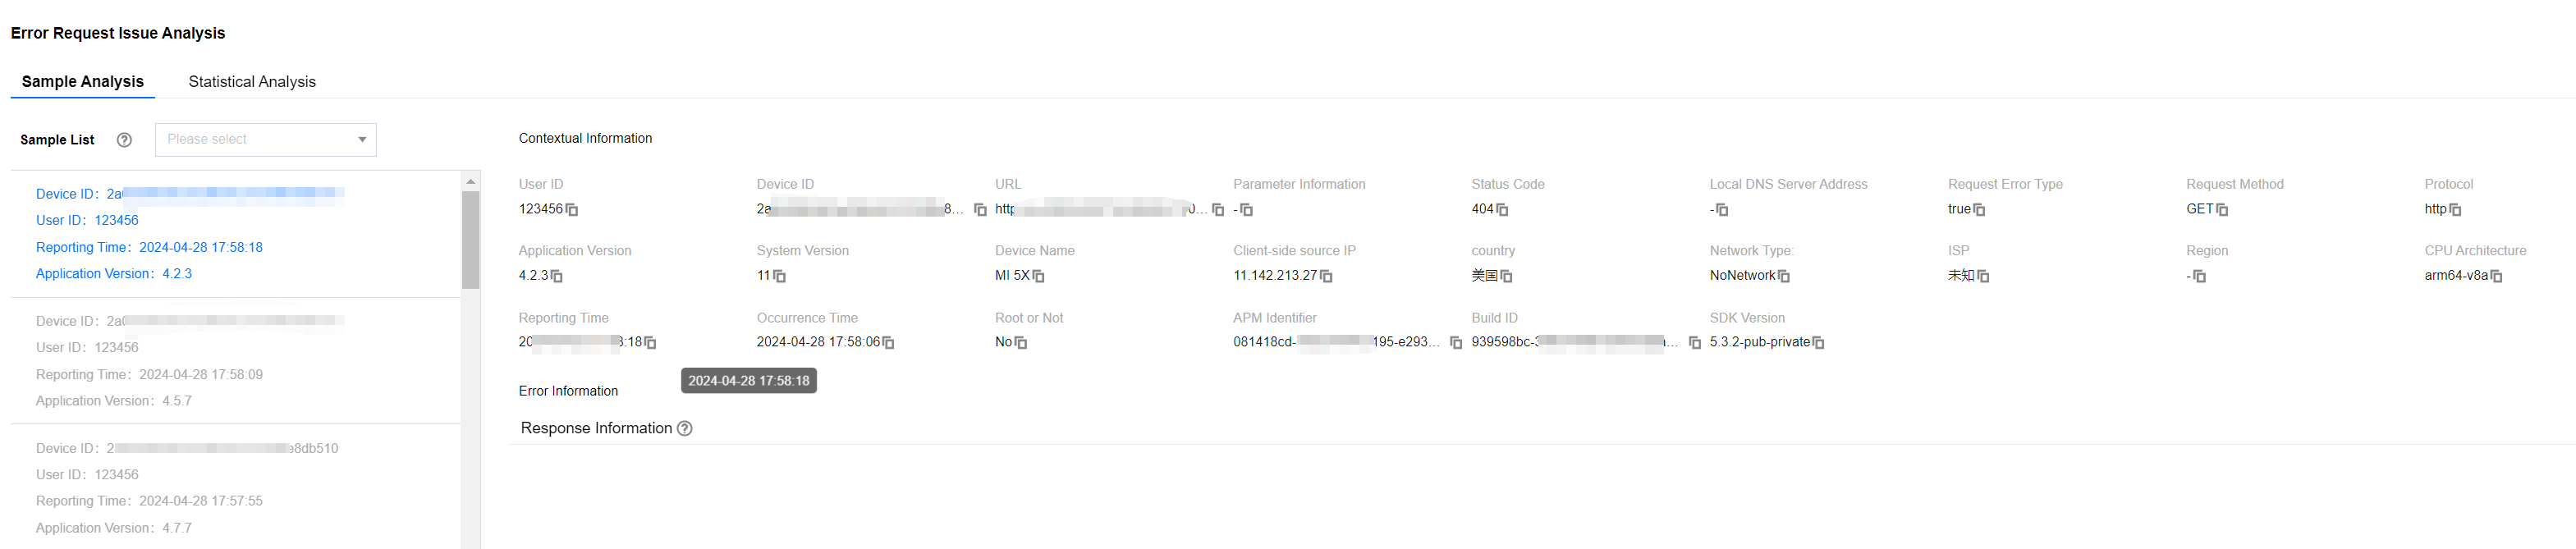
You can also click Issue Description to view error request details and analyze the cause of errors.
Metrics Description
Related Metrics are as follows:
Metric Name
Metrics Description
Request Duration
App request duration
Slow Request Proportion
The proportion of slow requests to the total number of requests within a selected time range. A request is considered a slow request:
When the transmitted data is over 50 KB and the transmission speed is below 10 KB/s.
When the transmitted data is 50 KB or less and the response time is over 2s.
Slow Requests
The number of slow requests within a selected time range. A request is considered a slow request:
When the transmitted data is over 50 KB and the transmission speed is below 10 KB/s.
When the transmitted data is 50 KB or less and the response time is over 2s.
Requests
Total application requests
Slow-request Users Proportion
The ratio of the number of users affected by slow requests to the total number of users within a specified time range
Slow Request Users
The number of users affected by slow requests within a specified time range
Request Error Rate
Number of error requests / Total number of requests
Error Requests
Number of network errors in the selected time period
Error requests refer to HTTP request errors, DNS resolution errors, inability to establish connection, connection timeout, and other network-related errors
Error-affected User Proportion
Ratio of users affected by error requests to total users within a specified time range
Error-affected Users
Number of users affected by error requests within a specified time range

 はい
はい
 いいえ
いいえ
この記事はお役に立ちましたか?