- Release Notes and Announcements
- Product Introduction
- Purchase Guide
- Quick Start
- Cloud Product Monitoring
- Tencent Cloud Service Metrics
- CVM
- CBS
- TencentDB
- TencentDB for SQL Server Monitoring Metrics
- TencentDB for MySQL Monitoring Metrics
- TencentDB for Redis Monitoring Metrics
- TencentDB for MongoDB Monitoring Metrics
- TencentDB for PostgreSQL Monitoring Metrics
- TDSQL-C for MySQL Monitoring Metrics
- TencentDB for TcaplusDB Monitoring Metrics
- TencentDB for MariaDB Monitoring Metrics
- TDSQL for MySQL Monitoring Metrics (Legacy)
- TDSQL for MySQL Monitoring Metrics
- SCF
- CKafka
- TDMQ
- VPC
- NAT Gateway Monitoring Metrics
- VPN Gateway Monitoring Metrics
- VPN Tunnel Monitoring Metrics
- Direct Connect Gateway Monitoring Metrics
- CCN Monitoring Metrics
- Peering Connection Monitoring Metrics
- Bandwidth Packet Monitoring Metrics
- EIP Monitoring Metrics
- Anycast EIP Monitoring Metrics
- Network Detection Monitoring Metrics
- CLB
- COS
- CFS
- CPM
- ECM
- EMR
- CDN And EdgeOne
- Direct Connect
- TKE
- GAAP
- CMQ
- API Gateway
- Elasticsearch
- WAF
- CLS
- Tencent Cloud Service Metrics
- Operation Guide
- Prometheus Monitoring
- Mobile App Performance Monitoring
- Best Practice
- API Documentation
- History
- Introduction
- API Category
- Making API Requests
- Monitoring Data Query APIs
- Alarm APIs
- DescribeAlarmHistories
- CreateAlarmPolicy
- DeleteAlarmPolicy
- DescribeAlarmPolicies
- DescribeAlarmPolicy
- ModifyAlarmPolicyStatus
- SetDefaultAlarmPolicy
- BindingPolicyObject
- UnBindingPolicyObject
- UnBindingAllPolicyObject
- ModifyAlarmPolicyCondition
- ModifyAlarmPolicyNotice
- ModifyAlarmPolicyTasks
- DescribeMonitorTypes
- DescribeAllNamespaces
- DescribeAlarmMetrics
- DescribeAlarmEvents
- DescribeBindingPolicyObjectList
- ModifyAlarmPolicyInfo
- DescribeConditionsTemplateList
- Legacy Alert APIs
- Notification Template APIs
- Prometheus Service APIs
- DescribePrometheusInstanceUsage
- DescribeServiceDiscovery
- CreateServiceDiscovery
- UpdateAlertRuleState
- UpdateAlertRule
- DescribeAlertRules
- DeleteAlertRules
- CreateAlertRule
- DescribePrometheusInstances
- UpgradeGrafanaDashboard
- UpdatePrometheusScrapeJob
- UpdatePrometheusAgentStatus
- UpdateExporterIntegration
- UninstallGrafanaDashboard
- UnbindPrometheusManagedGrafana
- TerminatePrometheusInstances
- ModifyPrometheusInstanceAttributes
- GetPrometheusAgentManagementCommand
- DestroyPrometheusInstance
- DescribePrometheusScrapeJobs
- DescribePrometheusAgents
- DescribeExporterIntegrations
- DeletePrometheusScrapeJobs
- DeleteExporterIntegration
- CreatePrometheusScrapeJob
- CreatePrometheusAgent
- CreateExporterIntegration
- BindPrometheusManagedGrafana
- UpdateRecordingRule
- DescribeRecordingRules
- DeleteRecordingRules
- CreateRecordingRule
- CreatePrometheusMultiTenantInstancePostPayMode
- DescribePrometheusZones
- Grafana Service APIs
- UpgradeGrafanaInstance
- UpdateSSOAccount
- UpdateGrafanaWhiteList
- UpdateGrafanaNotificationChannel
- UpdateGrafanaIntegration
- UpdateGrafanaEnvironments
- UpdateGrafanaConfig
- UpdateDNSConfig
- UninstallGrafanaPlugins
- ResumeGrafanaInstance
- ModifyGrafanaInstance
- InstallPlugins
- EnableSSOCamCheck
- EnableGrafanaSSO
- EnableGrafanaInternet
- DescribeSSOAccount
- DescribeInstalledPlugins
- DescribeGrafanaWhiteList
- DescribeGrafanaNotificationChannels
- DescribeGrafanaIntegrations
- DescribeGrafanaInstances
- DescribeGrafanaEnvironments
- DescribeGrafanaConfig
- DescribeDNSConfig
- DeleteSSOAccount
- DeleteGrafanaNotificationChannel
- DeleteGrafanaIntegration
- DeleteGrafanaInstance
- CreateSSOAccount
- CreateGrafanaNotificationChannel
- CreateGrafanaIntegration
- CreateGrafanaInstance
- CleanGrafanaInstance
- DescribeGrafanaChannels
- Event Center APIs
- TencentCloud Managed Service for Prometheus APIs
- CheckIsPrometheusNewUser
- CreatePrometheusTemp
- CreatePrometheusAlertPolicy
- CreatePrometheusClusterAgent
- CreatePrometheusGlobalNotification
- DeletePrometheusTemp
- DeletePrometheusTempSync
- DeletePrometheusAlertPolicy
- DeletePrometheusClusterAgent
- DescribePrometheusAgentInstances
- DescribePrometheusAlertPolicy
- DescribePrometheusInstanceDetail
- DescribePrometheusClusterAgents
- DescribePrometheusInstanceInitStatus
- DescribePrometheusGlobalConfig
- DescribePrometheusInstancesOverview
- DescribePrometheusGlobalNotification
- DescribePrometheusRecordRules
- DescribePrometheusTemp
- DescribePrometheusTempSync
- DescribePrometheusTargetsTMP
- ModifyPrometheusTemp
- ModifyPrometheusAgentExternalLabels
- ModifyPrometheusAlertPolicy
- ModifyPrometheusGlobalNotification
- RunPrometheusInstance
- DescribeClusterAgentCreatingProgress
- SyncPrometheusTemp
- Monitoring APIs
- Data Types
- Error Codes
- Troubleshooting
- FAQs
- Alarm Management
- Documentation Guide
- Policy
- Glossary
This feature provides WebView metric analysis based on page loading time, slow loading proportion, and JavaScript error rate. It allows you to drill down into WebView and JavaScript errors through the issue list.
Feature Entry
1. log in to Mobile App Performance Monitoring Console.
2. In the left navigation bar, select WebView. Select the business system, app, and time range to analyze WebView issues.
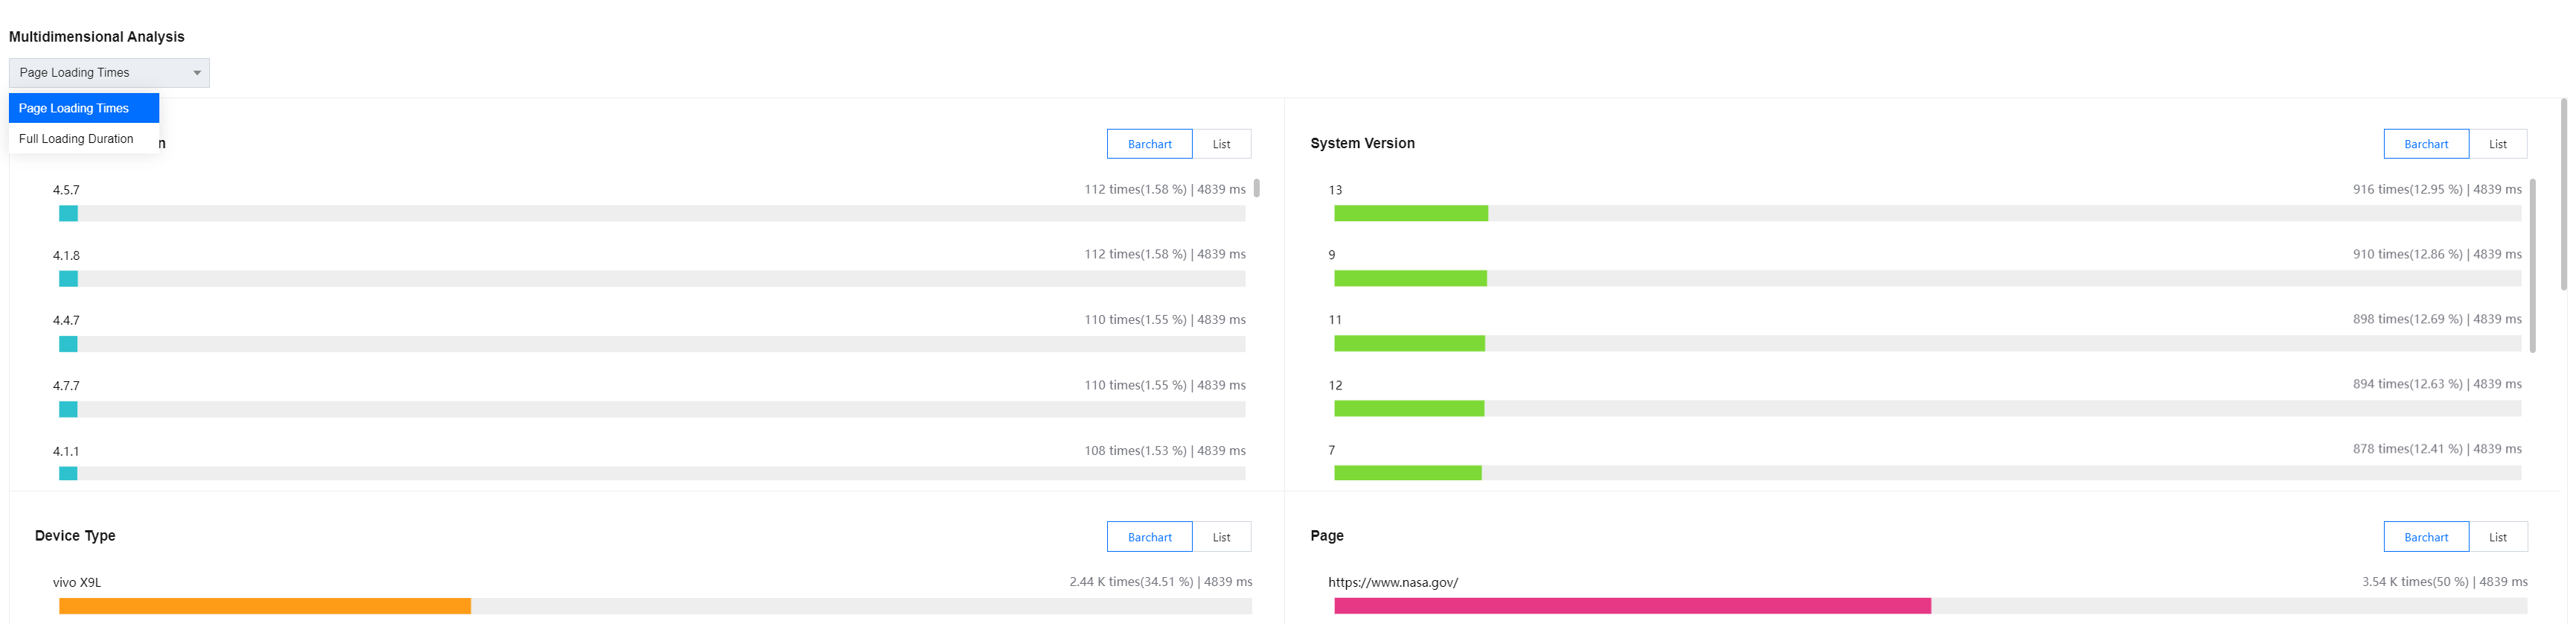
Slow loading and JavaScript Error Multidimensional Analysis
The multidimensional analysis page shows the analysis of key metrics from multiple dimensions such as app version, system version, device type, page, network type, internet service provider, and region. It facilitates targeted root cause analysis of specific slow loading issues or JavaScript errors.
Slow Loading Issues List
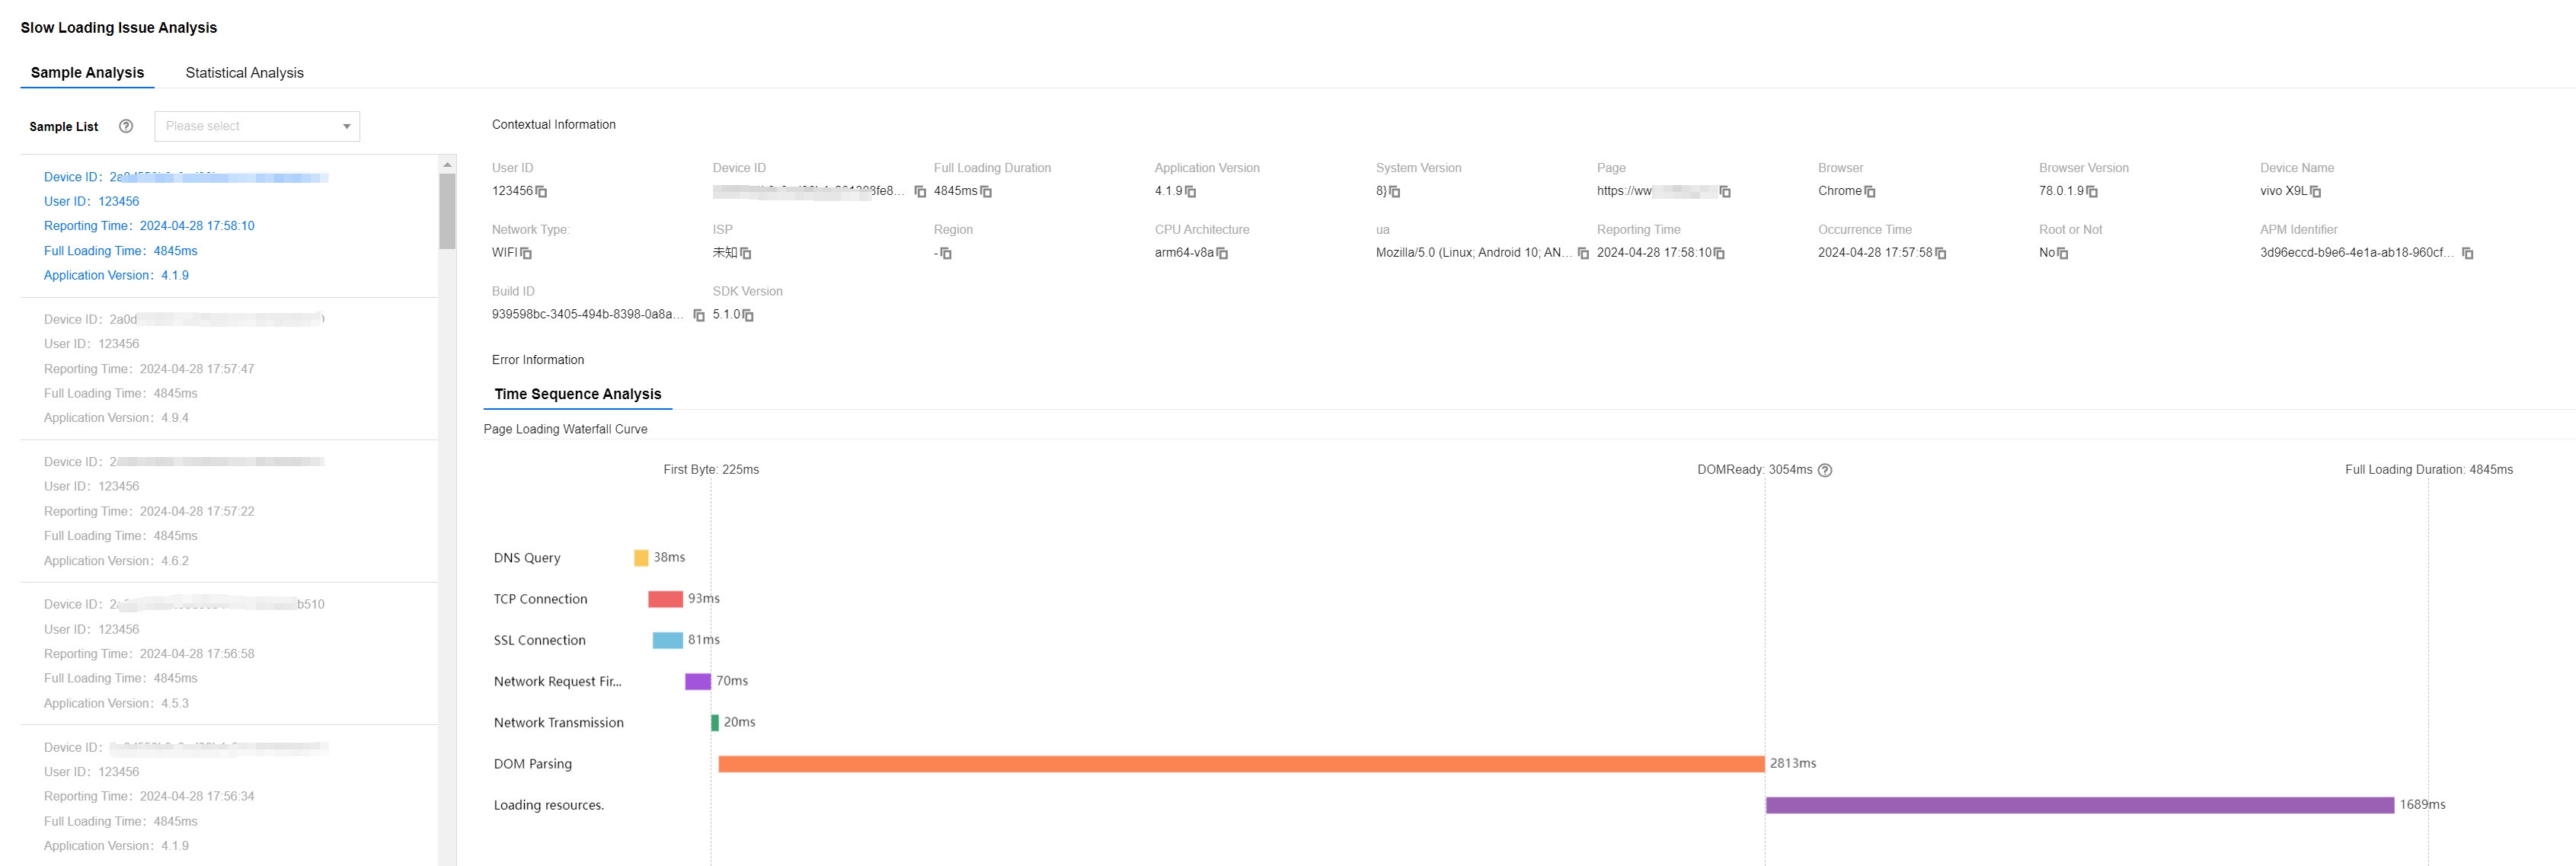
The slow loading issue list shows slow loading issues of all devices. You can quickly filter slow-loading devices by error type and device ID. You can also click Issue Description to view the details of slow loading and pinpoint and analyze the root causes of slow loading for your app.
Note:
The default sampling rate for slow loading sample reporting is 0.1%, so it is normal for the number of issue samples in the issue list to not match the metric statistics.
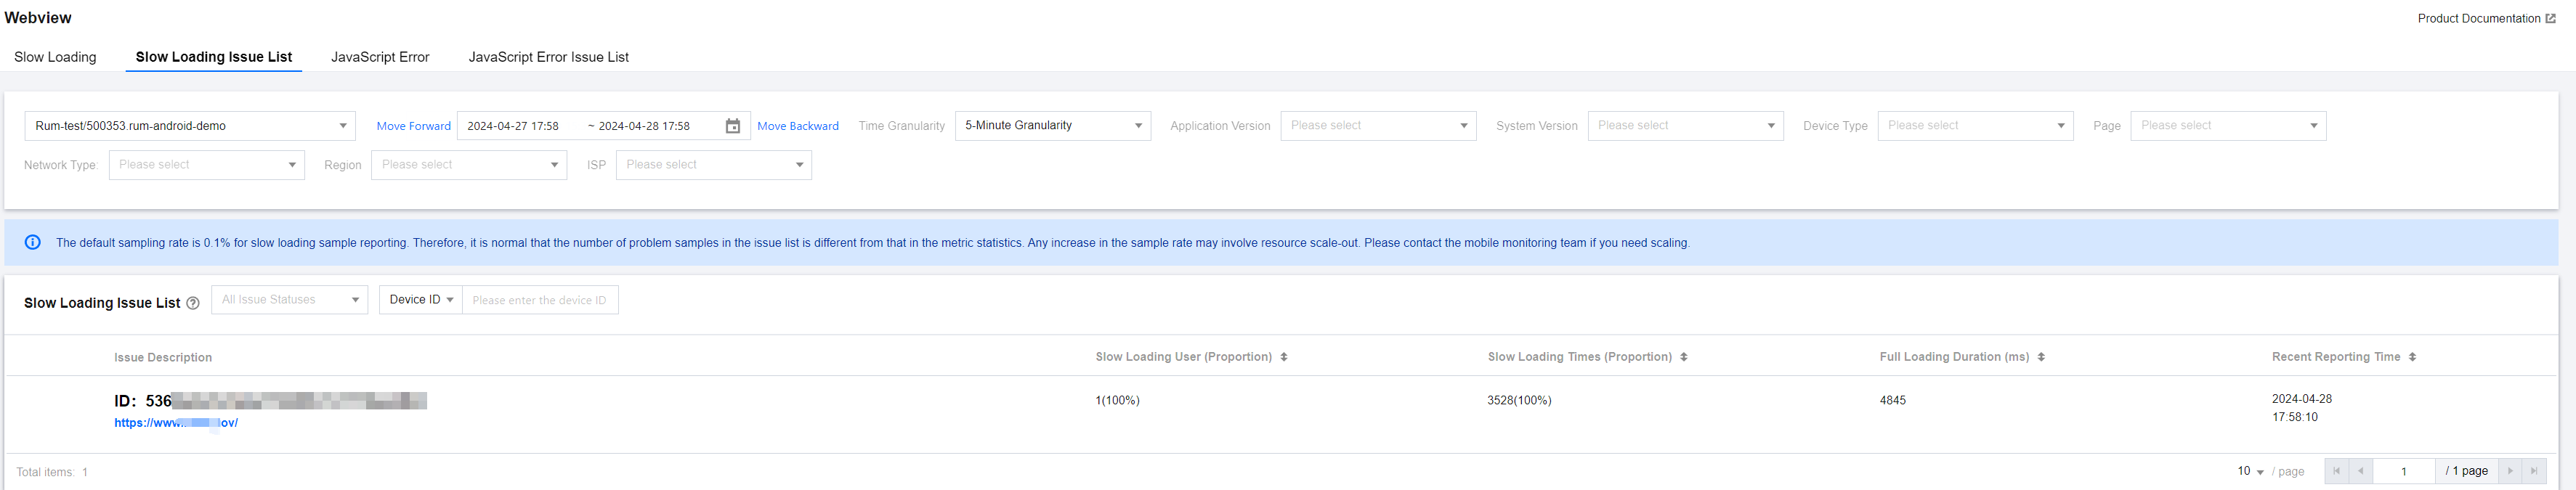
For each page loading sample, a full loading time greater than 3,500 ms is considered slow loading, and slow loading samples will be displayed in the issue list.
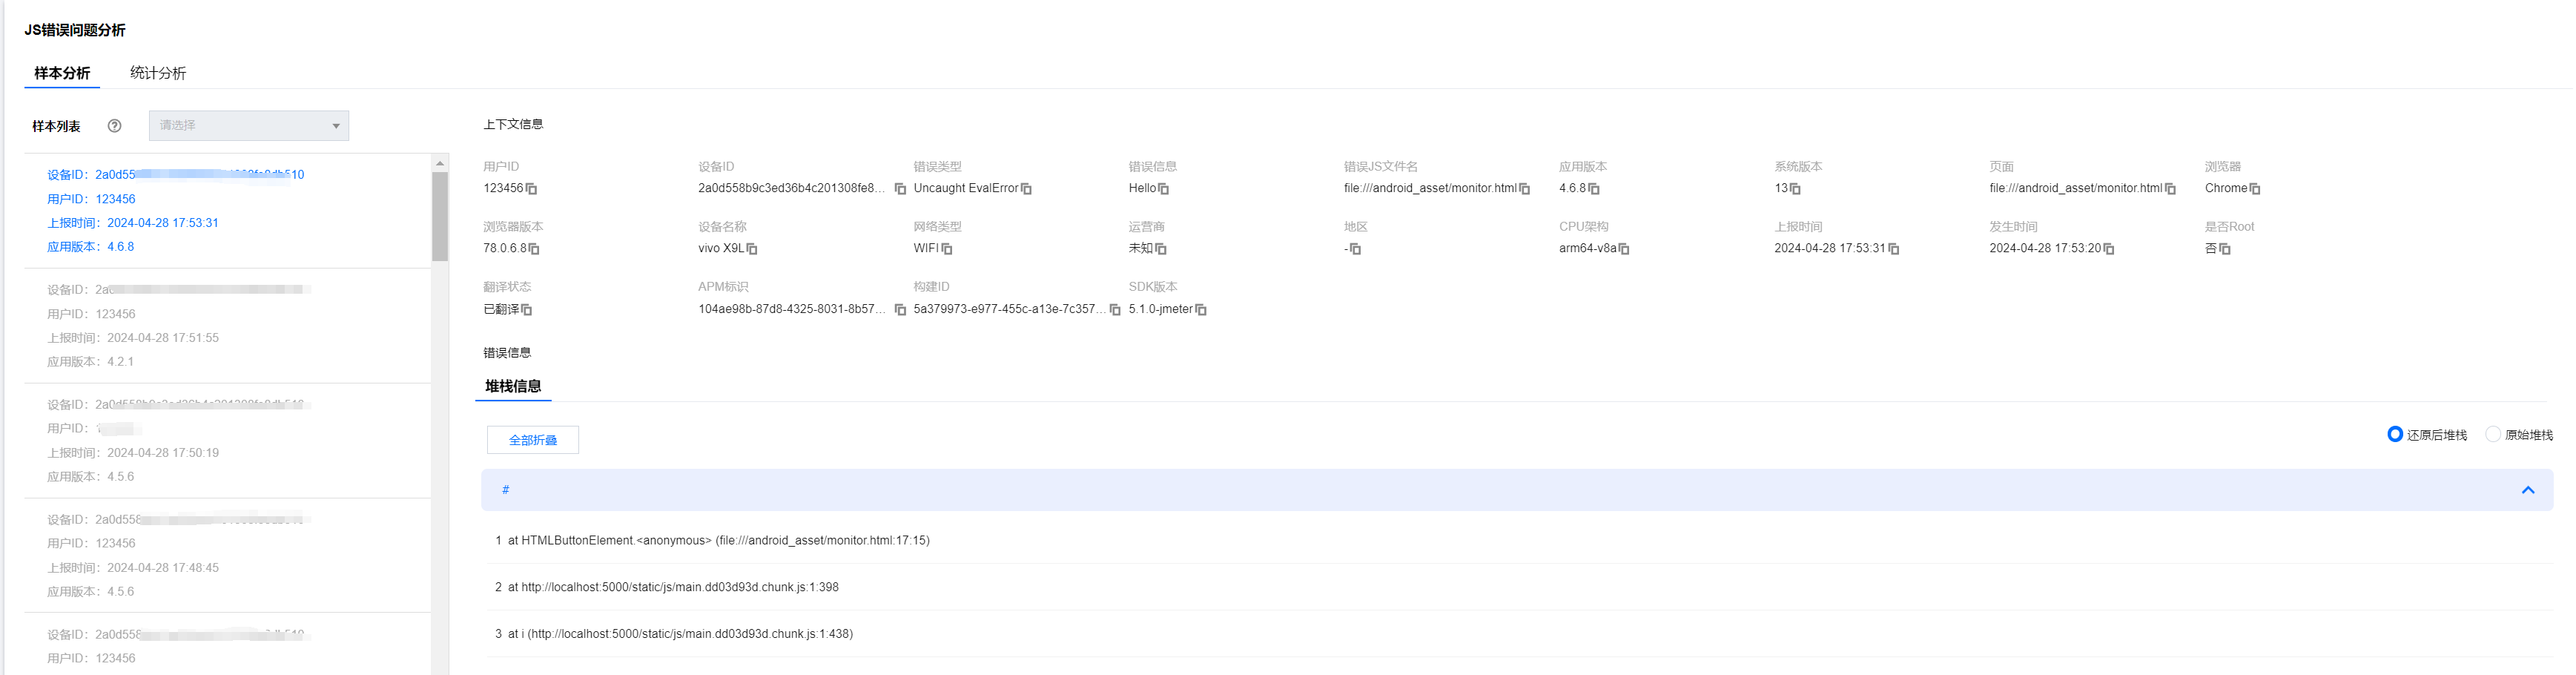
JavaScript Error Issues List
You can view all JavaScript errors in the JavaScript error Issues list.
Note:
The default sampling rate for JavaScript error reporting is 0.1%, so it is normal for the number of issue samples in the issue list to not match the metric statistics.
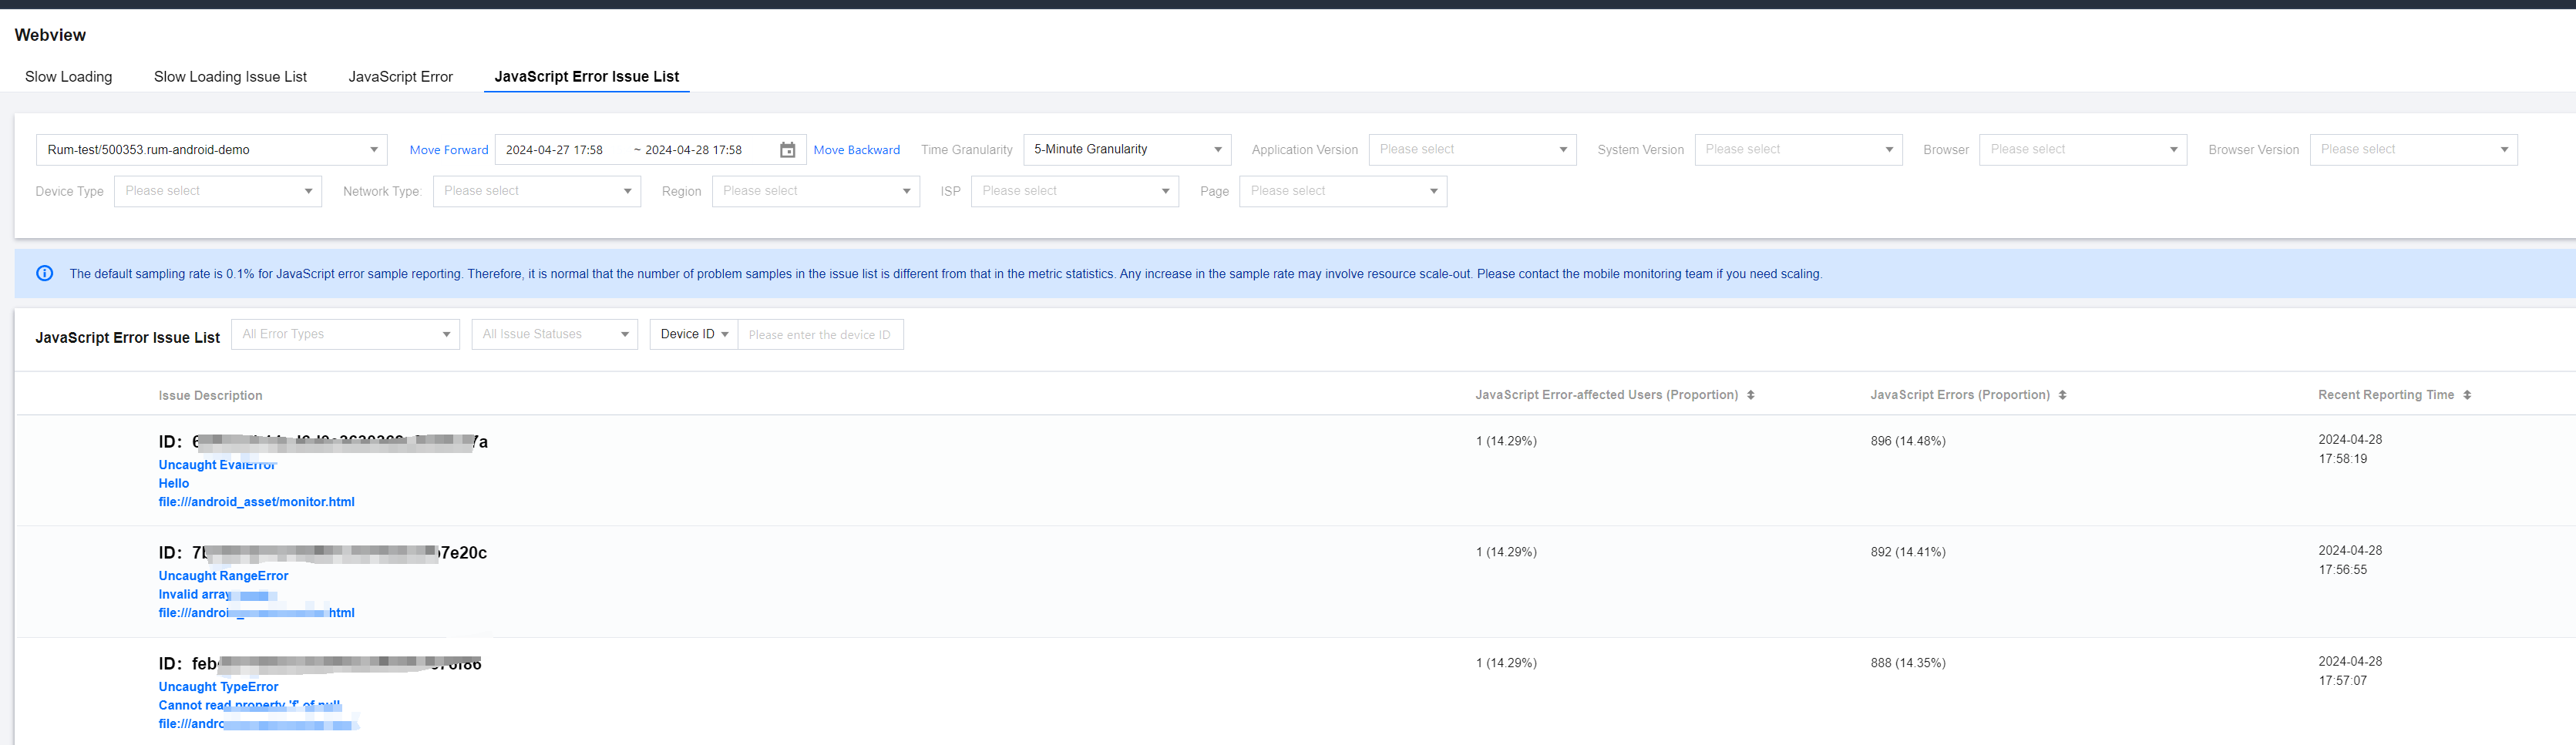
You can also click Issue Description to view details of JavaScript errors and pinpoint and analyze the causes of JavaScript errors.
Metrics Description
Related Metrics are as follows:
Metric Name | Metrics Description |
Page Loading Times | Number of times a page is opened or refreshed |
Full Loading Duration | Time taken for the entire web page to be fully loaded |
JavaScript Errors | Total number of JavaScript errors within a specified time range |
JavaScript Error Rate | Number of users experiencing JavaScript errors/Total number of users accessing the WebView page. Due to computational resource limitations, the numerator and denominator of this metric are not deduplicated. |
JavaScript Error-affected User Proportion | Number of users affected by JavaScript errors/Total number of users within a specified time range |
JavaScript Error-affected Users | Number of users affected by JavaScript errors within a specified time range |

 はい
はい
 いいえ
いいえ
この記事はお役に立ちましたか?