- Release Notes and Announcements
- User Guide
- Product Introduction
- Purchase Guide
- Getting Started
- Operation Guide
- Resource Management
- Permission Management
- Log Collection
- Collection Overview
- Collecting Logs in Self-Built Kubernetes Cluster
- Collecting Syslog
- Collection by LogListener
- Collecting Text Log
- Uploading Log over Kafka
- Uploading Logs via Anonymous Write
- Uploading Logs via Logback Appender
- Uploading Logs via Log4j Appender
- Uploading Log via SDK
- Uploading Log via API
- Importing Data
- Tencent Cloud Service Log Access
- Metric Collection
- Log Storage
- Metric Storage
- Search and Analysis (Log Topic)
- Syntax and Rules
- Statistical Analysis (SQL)
- Quick Analysis
- SQL Syntax
- SQL Functions
- String Function
- Date and Time Functions
- IP Geographic Function
- URL Function
- Mathematical Calculation Functions
- Mathematical Statistical Function
- General Aggregate Function
- Geospatial Function
- Binary String Function
- Estimation Function
- Type Conversion Function
- Logical Function
- Operators
- Bitwise Operation
- Regular Expression Function
- Lambda Function
- Conditional Expressions
- Array Functions
- Interval-Valued Comparison and Periodicity-Valued Comparison Functions
- JSON Functions
- Window Functions
- Sampling Analysis
- Configuring Indexes
- Reindexing
- Context Search and Analysis
- Downloading Log
- Search and Analysis (Metric Topic)
- Dashboard
- Data Processing documents
- Data Processing
- Creating Processing Task
- Viewing Data Processing Details
- Data Processing Functions
- Function Overview
- Key-Value Extraction Functions
- Enrichment Functions
- Flow Control
- Row Processing Functions
- Field Processing Functions
- Value Structuring Functions
- Regular Expression Processing Functions
- Time Value Processing Functions
- String Processing Functions
- Type Conversion Functions
- Logical and Mathematical Functions
- Encoding and Decoding Functions
- IP Parsing Functions
- Processing Cases
- Scheduled SQL Analysis
- SCF
- Data Processing
- Shipping and Consumption
- Monitoring Alarm
- Historical Documentation
- Practical Tutorial
- Developer Guide
- API Documentation
- History
- Introduction
- API Category
- Making API Requests
- Topic Management APIs
- Log Set Management APIs
- Index APIs
- Topic Partition APIs
- Machine Group APIs
- Collection Configuration APIs
- Log APIs
- Metric APIs
- Alarm Policy APIs
- Data Processing APIs
- Kafka Protocol Consumption APIs
- CKafka Shipping Task APIs
- Kafka Data Subscription APIs
- COS Shipping Task APIs
- SCF Delivery Task APIs
- Scheduled SQL Analysis APIs
- COS Data Import Task APIs
- Data Types
- Error Codes
- FAQs
- CLS Service Level Agreement
- CLS Policy
- Contact Us
- Glossary
Metric topics use Prometheus’ PromQL syntax to query metric data. For detailed syntax, see the Prometheus official documentation. This document mainly describes some common syntax and directions to help you quickly understand the basic usage.
There are two types of metric queries:
Range queries: Also known as Prometheus Range queries. This method queries metric data at each time point within a specified time range based on the step. It is commonly used to observe trends in metric changes.
Note:
When the query step is less than the metric collection interval, the query results may contain duplicate data. For example, if the CPU utilization is reported every 15 seconds, and the query interval is set to 1 second, you will see 15 identical duplicate data.
Instant queries: Also known as Prometheus Instant queries, this method returns the latest metric data within the query time range. It is commonly used to retrieve the current value of a metric.
Common syntax
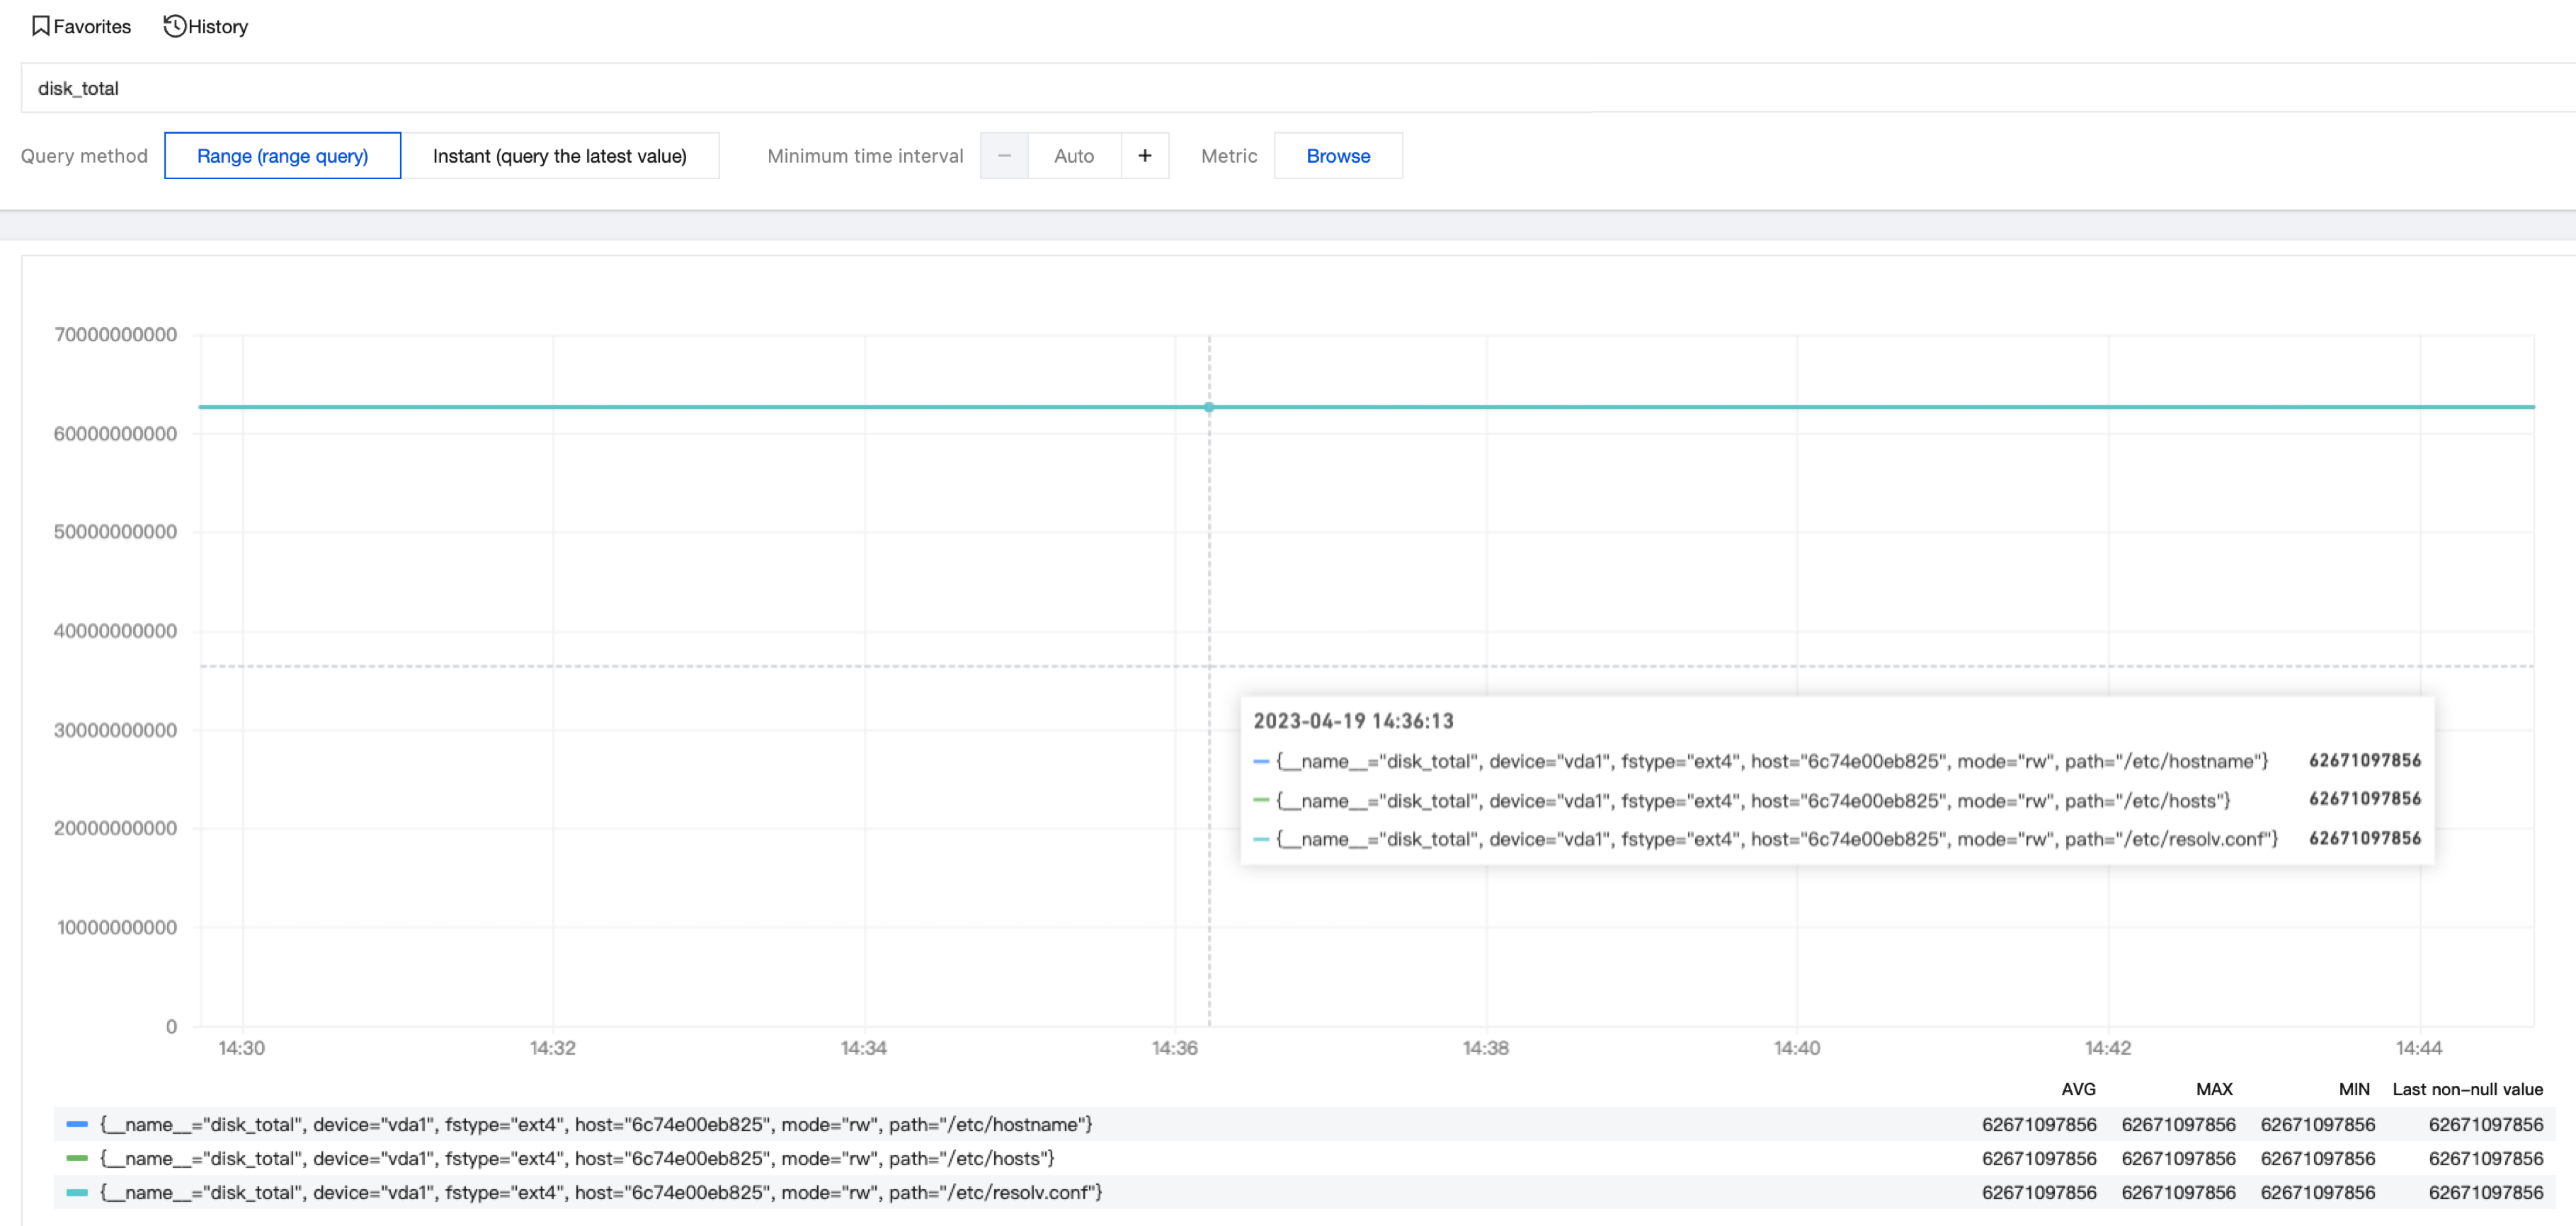
1. Specifies the metric name to query the trend of metric values for each dimension under that metric name. For example, querying the disk capacity (disk_total):
disk_total
Search for the required CAM policy as needed, and click to complete policy association.

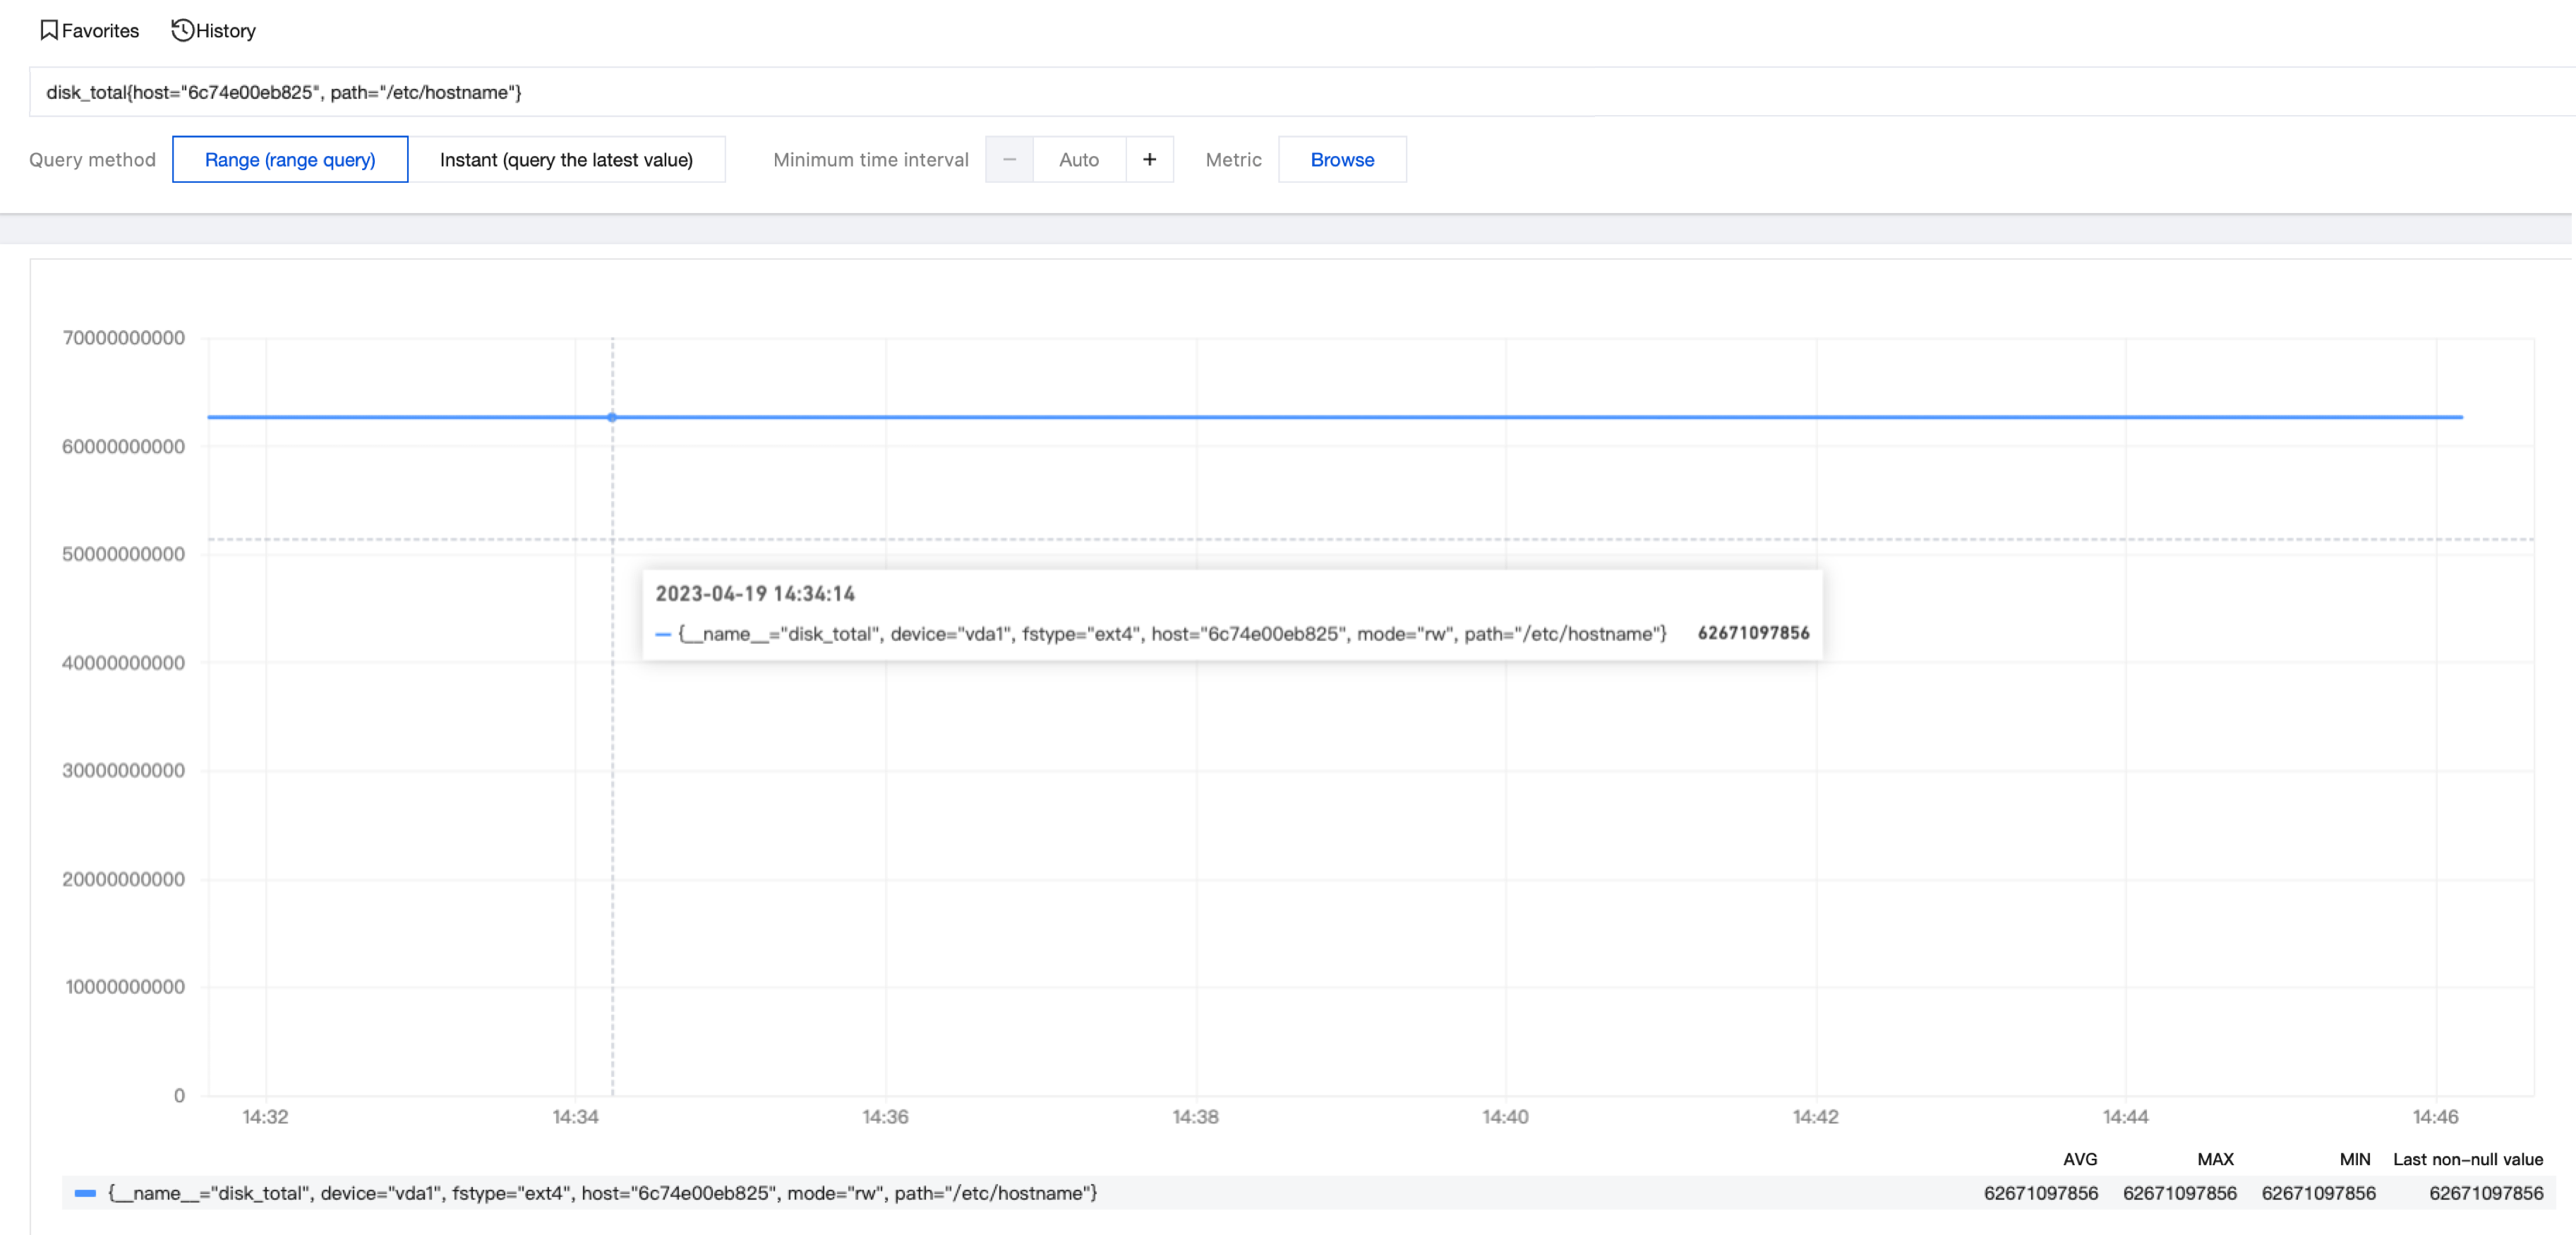
2. Specifies the metric name and dimensions to query the trend of metric values for a specific dimension combination. For example, querying the disk capacity where the hostname is 6c74e00eb825 and the path is /etc/hostname:
disk_total{host="6c74e00eb825", path="/etc/hostname"}
Search for the required CAM policy as needed, and click to complete policy association.

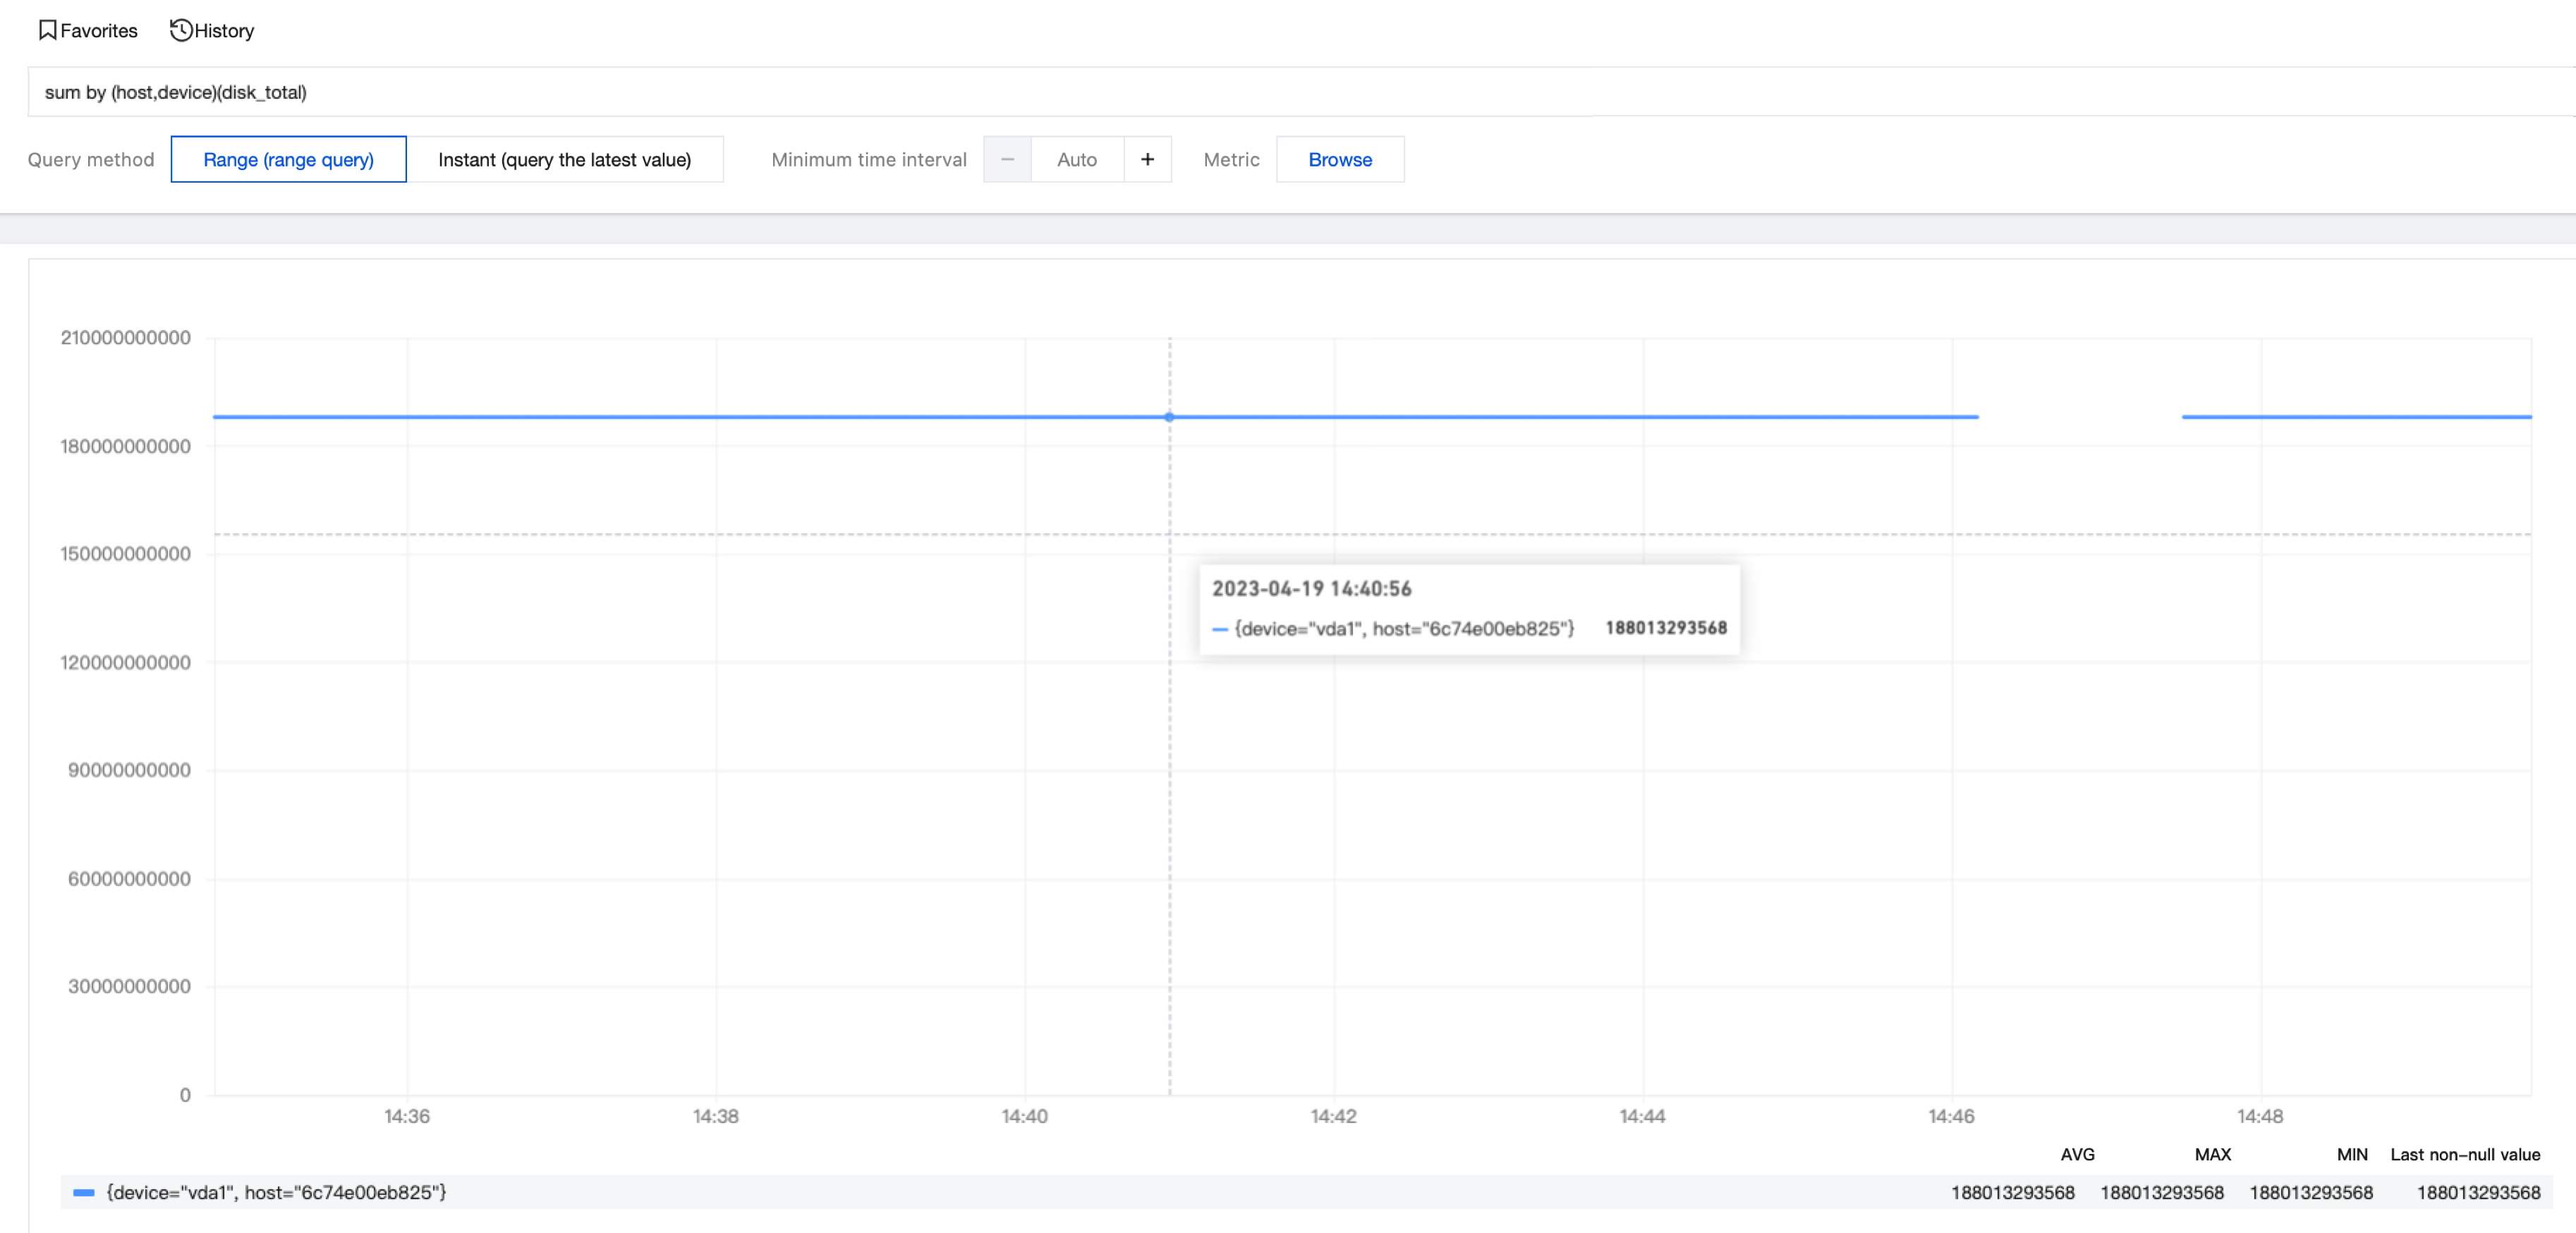
3. Aggregates metric data by specific dimensions. For example, querying the total disk capacity for each host and each device:
sum by (host,device)(disk_total)
Search for the required CAM policy as needed, and click to complete policy association.

Note:
Directions
1. Log in to the Cloud Log Service console.
2. In the left navigation bar, select Search and Analysis, at the top, select the region where the metric topic is located, choose "Metric topic" as the subject type, and then select the required metric topic.
3. Enter the query statement in the input box, then click the 


 예
예
 아니오
아니오
문제 해결에 도움이 되었나요?