- Release Notes and Announcements
- Product Introduction
- Purchase Guide
- Getting Started
- Operation Guide
- Instance Management
- Creating Instance
- Naming with Consecutive Numeric Suffixes or Designated Pattern String
- Viewing Instance
- Upgrading Instance
- Downgrading Instance Configuration
- Terminating/Returning Instances
- Change from Pay-as-You-Go to Monthly Subscription
- Upgrading Instance Version
- Adding Routing Policy
- Public Network Bandwidth Management
- Connecting to Prometheus
- AZ Migration
- Setting Maintenance Time
- Setting Message Size
- Topic Management
- Consumer Group
- Monitoring and Alarms
- Smart Ops
- Permission Management
- Tag Management
- Querying Message
- Event Center
- Migration to Cloud
- Data Compression
- Instance Management
- CKafka Connector
- Practical Tutorial
- Practical Tutorial of CKafka Client
- Connector Practical Tutorial
- Connecting Flink to CKafka
- Connecting Schema Registry to CKafka
- Connecting Spark Streaming to CKafka
- Connecting Flume to CKafka
- Connecting Kafka Connect to CKafka
- Connecting Storm to CKafka
- Connecting Logstash to CKafka
- Connecting Filebeat to CKafka
- Multi-AZ Deployment
- Log Access
- Replacing Supportive Route (Old)
- Practice Tutorial for Cluster Bandwidth in High CPU Utilization Scenarios
- Practice Tutorial for Cluster Capacity Planning
- Troubleshooting
- API Documentation
- History
- Introduction
- API Category
- Making API Requests
- DataHub APIs
- ACL APIs
- Topic APIs
- DescribeTopicProduceConnection
- BatchModifyGroupOffsets
- BatchModifyTopicAttributes
- CreateConsumer
- CreateDatahubTopic
- CreatePartition
- CreateTopic
- CreateTopicIpWhiteList
- DeleteTopic
- DeleteTopicIpWhiteList
- DescribeDatahubTopic
- DescribeTopic
- DescribeTopicAttributes
- DescribeTopicDetail
- DescribeTopicSubscribeGroup
- FetchMessageByOffset
- FetchMessageListByOffset
- ModifyDatahubTopic
- ModifyTopicAttributes
- DescribeTopicSyncReplica
- Instance APIs
- Route APIs
- Other APIs
- Data Types
- Error Codes
- SDK Documentation
- General References
- Conducting Production and Consumption Pressure Testing on CKafka
- Configuration Guide for Common Parameters in CKafka
- Connecting to Legacy Self-Built Kafka
- Suggestions for CKafka Version Selection
- CKafka Data Reliability Description
- Connector
- FAQs
- Service Level Agreement
- Contact Us
- Glossary
Overview
CKafka producers and consumers generate a large number of requests or produce/consume large amounts of data at an extremely high speed, which consumes Broker resources, causing high Network I/O. Therefore, CKafka provides a traffic throttling scheme to protect nodes and avoid impact on businesses due to high resource consumption.
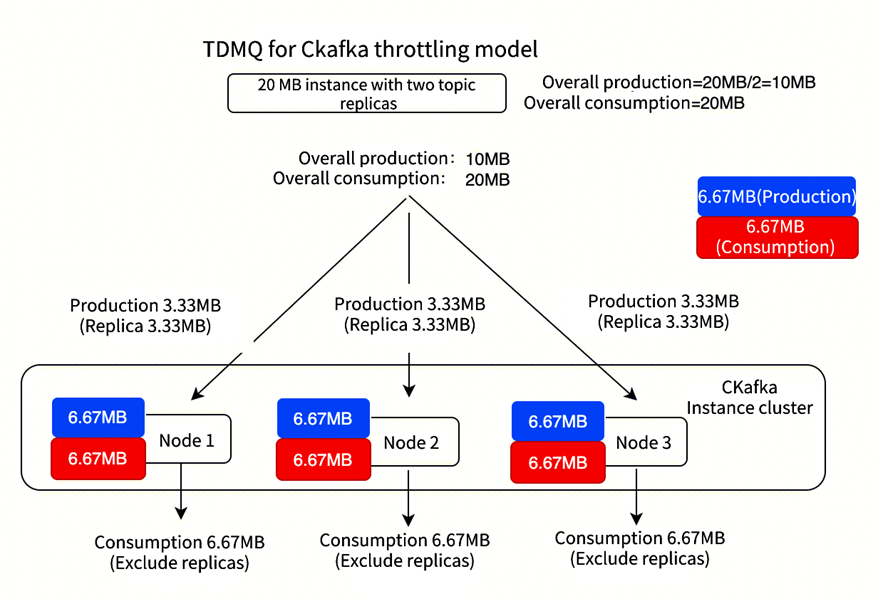
Take an instance with the specification of 20 MB as an example. Notes:
1. CKafka requires at least three nodes based on customer use cases and requirements. Therefore, with a traffic of 20 MB, each node is designed to handle 6.67 MB of read and write traffic. It is recommended to set the number of partitions to be two to three times the number of nodes to balance request traffic and achieve optimal efficiency.

2. Currently, traffic throttling capabilities are provided at two levels, as described below:
Cluster-level traffic throttling
The overall write traffic throttling is 20 MB/s, indicating the maximum write traffic (including replicas) tested by the customer is around 20 MB/s. However, with three nodes and the traffic of 6.67 MB/s for each node, the maximum write traffic for individual partitions is 6.67 MB/s. If a node has two partitions, the maximum write traffic is 3.33 MB/s when the replica traffic is also counted.
The overall read traffic throttling is 20 MB/s, indicating the maximum read traffic (excluding replicas) tested by the customer is around 20 MB/s.
Topic-level traffic throttling
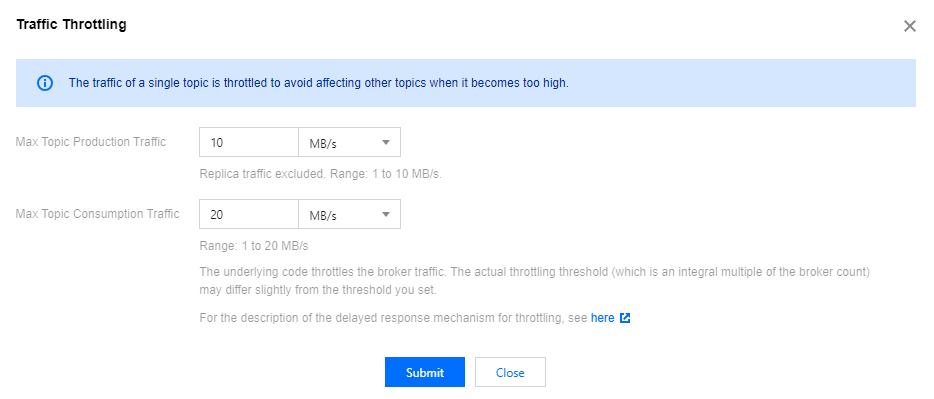
Customers can configure traffic throttling for Topics. For example, for a Topic with 2 replicas, the production traffic can be limited to 7 MB/s (including replicas), and the consumption traffic to 20 MB/s.
Production traffic throttling: 7 MB/s
Consumption traffic throttling: 20 MB/s

Traffic Throttling Mechanism Explanation
CKafka's traffic throttling mechanism adopts soft throttling, which means that when user traffic exceeds the quota, the server delays packet response instead of returning an error to the client.
Take API traffic throttling as an example:
Hard throttling : Assume that the call frequency is 100 times/s. The server will return an error when client calls exceed 100 times per second, and the client needs to handle the error according to the business logic.
Soft throttling : Assume that the call frequency is 100 times/s, and the normal time consumption is 10 ms. When client calls exceed 100 times per second:
The request takes 20 ms if frequency exceeds 110 times per second.
The request takes 50 ms if frequency exceeds 200 times per second. This is friendly to the client. No error or alarm will be triggered due to traffic surges or fluctuations, and the business can run normally.
Therefore, soft throttling is better for users in high-traffic scenarios like Kafka.
Relationship between the purchased bandwidth and production/consumption bandwidth:
Maximum production bandwidth (per second) = purchased bandwidth / number of replicas
Maximum consumption bandwidth (per second) = purchased bandwidth
Delayed Response Packet Traffic Throttling Principles
The underlying traffic throttling mechanism of CKafka instances is implemented based on the token bucket principle. Each second is divided into multiple time buckets, measured in millisecond.
The traffic throttling policy divides each second (1,000 ms) into several time buckets. For example, if there are 10 time buckets, each bucket is 100 ms. The traffic throttling for each time bucket is 1/10 of the total instance traffic. If the traffic of a TCP request in a certain time bucket exceeds the traffic throttling, the packet response delay for that request will be increased according to the internal traffic throttling algorithm. In this way, the client cannot quickly receive the TCP response, thus achieving traffic throttling.

CKafka Traffic Throttling Best Practices
Partition Quantity Planning and Local Traffic Throttling
CKafka instances have multiple nodes in distributed deployment mode to provide overall production and consumption services, and fixed read and write traffic throttling quotas are set for each node. To better utilize CKafka traffic, customers need to ensure the number of partitions is a multiple of that of nodes (in such case, CKafka will try to configure the same number of partitions on each node) to balance traffic as much as possible. (The write traffic may be uneven in special scenes such as specifying the message key. By default, the CKafka client tries to balance traffic across partitions when sending requests to the server). This effectively avoids local traffic throttling issues caused by local hotspots.
Explanation of Instance Traffic Throttling Count and Delayed Packet Response Monitoring
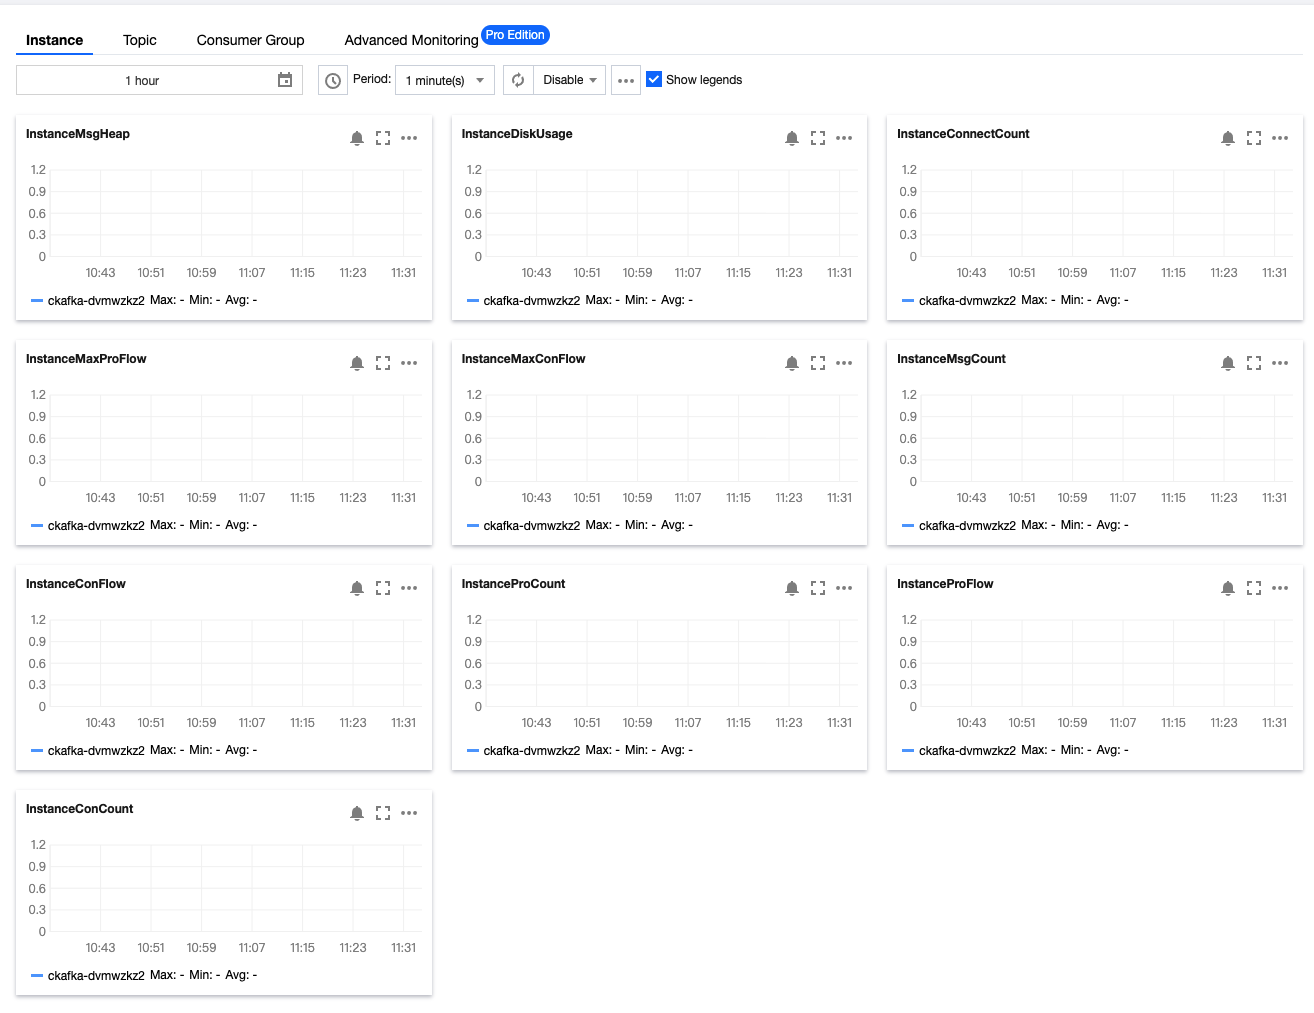
The instance traffic throttling count of CKafka refers the sum of traffic throttling operations on all nodes. It does not reflect the overall production and consumption performance of the instance, nor does it indicate that all nodes have triggered traffic throttling. Therefore, when the number of traffic throttling operations is high but the overall throttled traffic appears lower than the specification, customers can view the traffic throttling count on each node on the Advanced Monitoring tab to check the nodes on which traffic throttling has been performed.
When such issue occurs, it is recommended to adjust the number of partitions to be a multiple of the number of nodes to improve the overall bandwidth utilization of the instance. Currently, CKafka adopts the delayed packet response policy. Therefore, after traffic throttling is performed, you need to pay attention to the metric packet response delay . This metric can be viewed on the Advanced Monitoring tab in Pro Edition.
Traffic Throttling Difference Between Production and Consumption
Production involves replica synchronization. Therefore, the number of replicas is counted. Consumption only pulls data from the leader, so the number of replicas is not counted. Maximum production traffic of a single node = specification / number of nodes / number of replicas; maximum consumption traffic of a single node = specification / number of nodes.
Explanation of Occasional Throttling
Replicas consume traffic, which means that the write traffic decreases as the number of replicas increases. Throttling is actually performed on nodes and monitored by second, while customers view the data of monitoring by minute. Therefore, traffic throttling is more sensitive. When the overall write traffic exceeds 70% (excluding replicas) of the specification, second-level local throttling may occur on some nodes. Customers can view the specific node traffic on the Advanced Monitoring tab. If the requirement for response time is high, try to reserve 30% of the specification as buffer.
Explanation of Continuous Throttling count
Instance traffic throttling has been performed, Advanced Monitoring shows that continuous traffic throttling occurs on all nodes and the instance traffic is 10% higher than the specification, and the impact of Topic traffic throttling rules is excluded. This is unexpected. For such issues, submit a ticket.
FAQs
Why is traffic throttling triggered
Why is traffic throttling triggered when the monitored production/consumption traffic is lower than the instance specification?
As mentioned above, traffic throttling is measured in milliseconds, but the monitoring platform in the console collects data at the second level and aggregates the data at the minute level (maximum or average value).
According to the principle of token bucket, a single bucket does not forcibly throttle the traffic. Suppose the bandwidth specification of instance A is 100 MB/sec, then the traffic throttling threshold of each 100-ms time bucket is 100 MB/10 = 10 MB/bucket. If the production traffic of instance A reaches 30 MB in the first 100-ms time bucket of a certain second (3 times the threshold), then the broker's traffic throttling policy will be triggered to increase the delayed response time. Suppose the original normal TCP response time is 100 ms, then the delay may be increased by 500 ms before response after the threshold is exceeded. The final traffic in this second is 30 MB 1 + 0 MB 5 + 10 MB * 4 = 70 MB, so the traffic speed in this second (70 MB/sec) is lower than the instance specification (100 MB/sec).

Why is the peak production/consumption traffic higher than the instance specification?
Suppose again the bandwidth specification of instance A is 100 MB/sec, then the traffic throttling threshold of each 100-ms time bucket is 10 MB. If the production traffic of instance A reaches 70 MB in the first 100-ms time bucket of a certain second (7 times the threshold), then the broker's traffic throttling policy will be triggered to increase the delayed response time. Suppose the original normal TCP response time is 100 ms, then the delay may be increased by 800 ms before response after the threshold is exceeded. After the response is returned at the 900th ms, the client immediately injects 70 MB of traffic into the 10th time bucket. The final traffic in this second is (70 MB 1 + 0 MB 8 + 70 MB * 1) = 140 MB, so the traffic speed in this second (140 MB/sec) is higher than the instance specification (100 MB/sec).

Why does the number of traffic throttling events surge?
The number of traffic throttling events is counted based on TCP requests. If instance A exceeds the traffic threshold in the first time bucket in a certain second, all TCP requests in the remaining time of this time bucket after the threshold is exceeded will be throttled and counted as traffic throttling events.
How does CKafka throttle traffic?
To ensure service stability, CKafka implement network traffic control strategies on both input and output messages.
Throttling occurs when the total traffic of a user’s replicas exceeds the purchased peak traffic.
When the producer traffic is throttled, CKafka will extend the response time of a TCP connection. The delay period depends on how much the instantaneous traffic exceeds the limit. It is similar to the principle of road traffic control. The more traffic flow, the higher the delay value from the delay algorithm, up to 5 minutes.
When the consumer traffic is throttled, CKafka will reduce the size of each
fetch.request.max.bytes request to control the traffic.How do I determine whether CKafka has been throttled?
1. In the instance list, you can see the health status of each cluster. If it’s “Warning”, you can hover your mouse over it to view the detailed data. The data displays your peak traffic and the number of throttling occurrences, based on which you can determine whether this instance has been throttled.
2. You can click the Monitoring tab to view the max traffic value. If the value of max traffic multiplied by replica count is greater than that of the purchased peak bandwidth, you can determine that throttling has occurred at least once.

3. View the instance monitoring data on the monitoring page in the CKafka console. If the number of traffic throttling occurrences is greater than 0, traffic throttling has occurred.


 예
예
 아니오
아니오
문제 해결에 도움이 되었나요?