- Release Notes and Announcements
- Product Introduction
- Purchase Guide
- Getting Started
- Operation Guide
- Instance Management
- Creating Instance
- Naming with Consecutive Numeric Suffixes or Designated Pattern String
- Viewing Instance
- Upgrading Instance
- Downgrading Instance Configuration
- Terminating/Returning Instances
- Change from Pay-as-You-Go to Monthly Subscription
- Upgrading Instance Version
- Adding Routing Policy
- Public Network Bandwidth Management
- Connecting to Prometheus
- AZ Migration
- Setting Maintenance Time
- Setting Message Size
- Topic Management
- Consumer Group
- Monitoring and Alarms
- Smart Ops
- Permission Management
- Tag Management
- Querying Message
- Event Center
- Migration to Cloud
- Data Compression
- Instance Management
- CKafka Connector
- Practical Tutorial
- Practical Tutorial of CKafka Client
- Connector Practical Tutorial
- Connecting Flink to CKafka
- Connecting Schema Registry to CKafka
- Connecting Spark Streaming to CKafka
- Connecting Flume to CKafka
- Connecting Kafka Connect to CKafka
- Connecting Storm to CKafka
- Connecting Logstash to CKafka
- Connecting Filebeat to CKafka
- Multi-AZ Deployment
- Log Access
- Replacing Supportive Route (Old)
- Practice Tutorial for Cluster Bandwidth in High CPU Utilization Scenarios
- Practice Tutorial for Cluster Capacity Planning
- Troubleshooting
- API Documentation
- History
- Introduction
- API Category
- Making API Requests
- DataHub APIs
- ACL APIs
- Topic APIs
- DescribeTopicProduceConnection
- BatchModifyGroupOffsets
- BatchModifyTopicAttributes
- CreateConsumer
- CreateDatahubTopic
- CreatePartition
- CreateTopic
- CreateTopicIpWhiteList
- DeleteTopic
- DeleteTopicIpWhiteList
- DescribeDatahubTopic
- DescribeTopic
- DescribeTopicAttributes
- DescribeTopicDetail
- DescribeTopicSubscribeGroup
- FetchMessageByOffset
- FetchMessageListByOffset
- ModifyDatahubTopic
- ModifyTopicAttributes
- DescribeTopicSyncReplica
- Instance APIs
- Route APIs
- Other APIs
- Data Types
- Error Codes
- SDK Documentation
- General References
- Conducting Production and Consumption Pressure Testing on CKafka
- Configuration Guide for Common Parameters in CKafka
- Connecting to Legacy Self-Built Kafka
- Suggestions for CKafka Version Selection
- CKafka Data Reliability Description
- Connector
- FAQs
- Service Level Agreement
- Contact Us
- Glossary
Overview
Tencent Cloud provides the monitoring service for all users by default; therefore, you do not need to manually activate it. Tencent Cloud Observability Platform (TCOP) will start collecting monitoring data only after a Tencent Cloud product is used.
CKafka allows you to monitor the resources created under your account, including instances, topics, and consumer groups, so that you can keep track of the status of your resources in real time. You can configure alarm rules for monitoring metrics. When a monitoring metric reaches the set alarm threshold, TCOP will notify you of exceptions in time via email, SMS, WeChat, phone call, etc.
Directions
Configuring an alarm policy
The created alarm can determine whether an alarm notification should be sent based on the comparison between the monitoring metric and the given threshold in the selected time period. You can take appropriate precautionary or remedial measures in a timely manner when the alarm is triggered because the status of CKafka changes. Properly creating alarm policies can help improve the robustness and reliability of your applications.
Note
Be sure to configure alarms for your instance to prevent exceptions caused by traffic spikes or specification limits.
1. Log in to the CKafka console.
2. In the instance list, click Configure Alarm Policy in the Operation column to enter the alarm configuration page.
3. On the alarm configuration page, select a policy type and instance, and set the alarm rule and notification template.
Monitoring Type: Select Tencent Cloud services.
Policy Type: Select CKafka.
Alarm Object: Select the CKafka resource for which to configure the alarm policy.
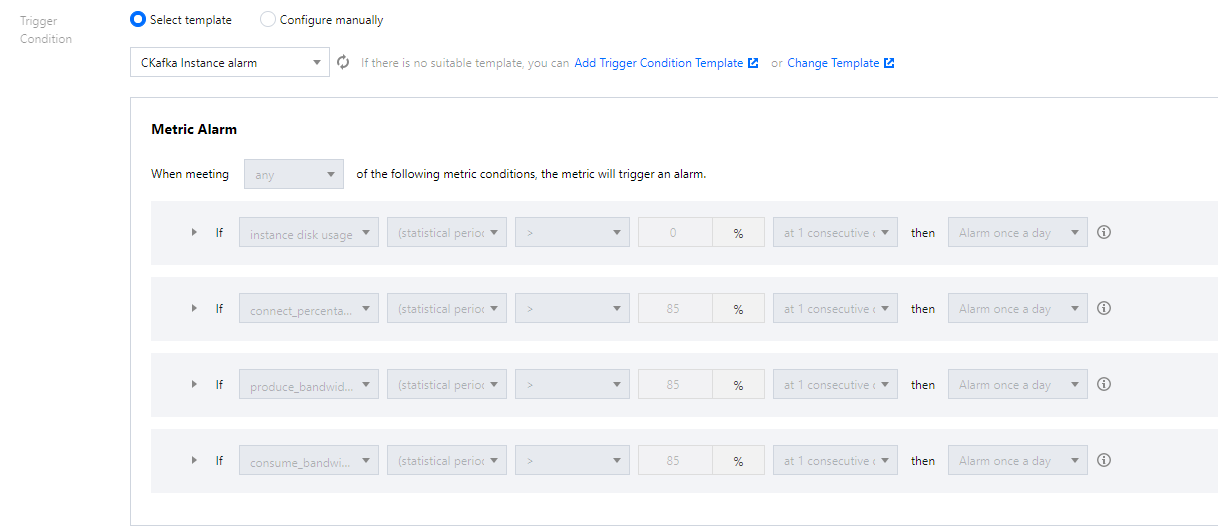
Trigger Condition: You can select Select template or Configure manually. The latter is selected by default. For more information on manual configuration, see the description below. For more information on how to create a template, see Creating a trigger condition template.
Note
Metric: For example, if you select 1 minute as the statistical period for the "Disk Utilization" metric, then if the disk utilization exceeds the threshold for N consecutive data points, an alarm will be triggered.
Alarm Frequency: For example, "Alarm once every 30 minutes" means that there will be only one alarm triggered every 30 minutes if a metric exceeds the threshold in several consecutive statistical periods. Another alarm will be triggered only if the metric exceeds the threshold again in the next 30 minutes. For the metrics for which we recommend that you configure an alarm policy, see Monitoring and Alarm Policies Recommended for CKafka.
Notification Template: You can select an existing notification template or create one to set the alarm recipient objects and receiving channels.
4. Click Complete.
Note
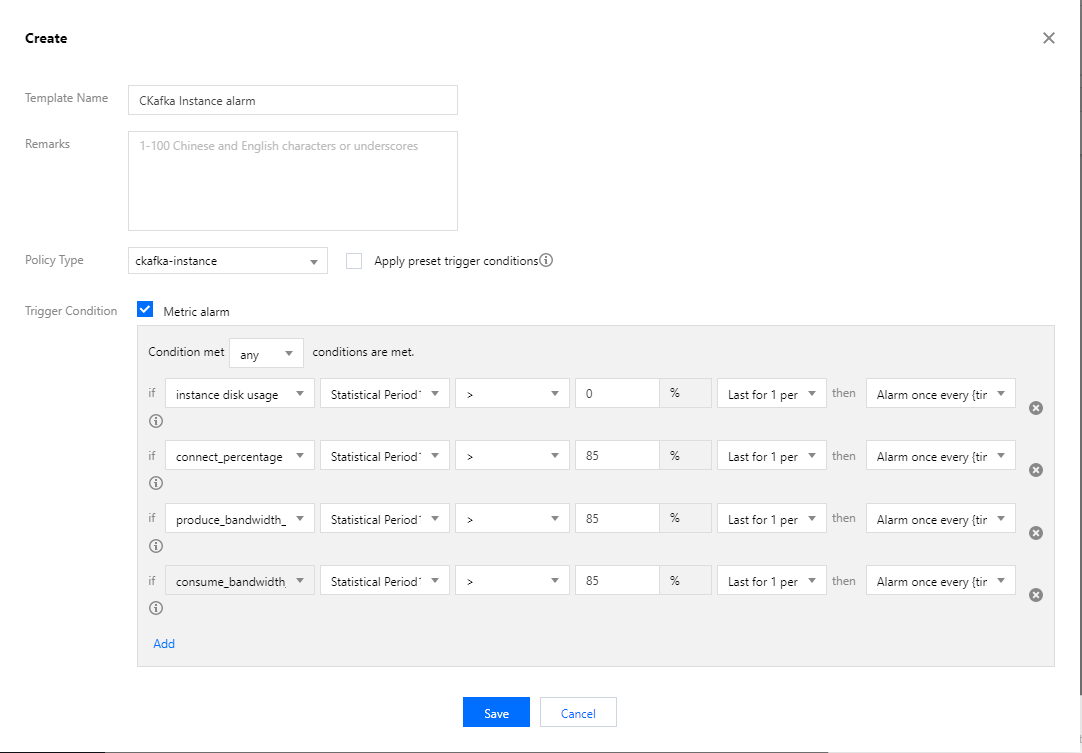
Creating a trigger condition template
1. On the Configure Alarm Policy page, select Select Template for Trigger Condition and click Create Trigger Condition Template.
2. On the template creation page, configure the policy type.
Policy Type: Select CKafka.
Apply preset trigger conditions: Select this option and the system recommended alarm policy will be displayed.
3. After confirming that everything is correct, click Save.

4. Return to the alarm policy creation page and click Refresh. The alarm policy template just configured will be displayed.

Monitoring and Alarm Policies Recommended for CKafka
For more information on metrics that may affect the business data stability, see CKafka Data Reliability Description.
Based on user feedback, we recommend that you configure alarm policies in the following 3 dimensions (6 metrics in total) for CKafka. You need to configure them reasonably based on your actual business conditions.
Instance monitoring:
Monitoring Metric | Description |
Production Peak Bandwidth (MB/sec) | Peak traffic generated when the instance produces messages (excluding the traffic generated by replicas). |
Consumption Peak Bandwidth (MB/sec) | Peak traffic generated when the instance consumes messages (there is no replica concept in consumption). |
Disk Utilization (%) | Ratio of the currently used disk capacity to the total disk capacity of the instance in percentages. |
Instance Connections (Count) | Number of connections between the client and server. |
Topic monitoring:
Monitoring Metric | Description |
Used Disk Capacity (MB) | Total size of messages in the topic (excluding those produced by replicas) that actually use disk capacity, which is the latest value in the selected time period. |
Consumer group:
Monitoring Metric | Description |
Unconsumed Messages | Number of unconsumed messages in the consumer group. |

 예
예
 아니오
아니오
문제 해결에 도움이 되었나요?