- Release Notes and Announcements
- Product Introduction
- Purchase Guide
- Getting Started
- Operation Guide
- Instance Management
- Creating Instance
- Naming with Consecutive Numeric Suffixes or Designated Pattern String
- Viewing Instance
- Upgrading Instance
- Downgrading Instance Configuration
- Terminating/Returning Instances
- Change from Pay-as-You-Go to Monthly Subscription
- Upgrading Instance Version
- Adding Routing Policy
- Public Network Bandwidth Management
- Connecting to Prometheus
- AZ Migration
- Setting Maintenance Time
- Setting Message Size
- Topic Management
- Consumer Group
- Monitoring and Alarms
- Smart Ops
- Permission Management
- Tag Management
- Querying Message
- Event Center
- Migration to Cloud
- Data Compression
- Instance Management
- CKafka Connector
- Practical Tutorial
- Practical Tutorial of CKafka Client
- Connector Practical Tutorial
- Connecting Flink to CKafka
- Connecting Schema Registry to CKafka
- Connecting Spark Streaming to CKafka
- Connecting Flume to CKafka
- Connecting Kafka Connect to CKafka
- Connecting Storm to CKafka
- Connecting Logstash to CKafka
- Connecting Filebeat to CKafka
- Multi-AZ Deployment
- Log Access
- Replacing Supportive Route (Old)
- Practice Tutorial for Cluster Bandwidth in High CPU Utilization Scenarios
- Practice Tutorial for Cluster Capacity Planning
- Troubleshooting
- API Documentation
- History
- Introduction
- API Category
- Making API Requests
- DataHub APIs
- ACL APIs
- Topic APIs
- DescribeTopicProduceConnection
- BatchModifyGroupOffsets
- BatchModifyTopicAttributes
- CreateConsumer
- CreateDatahubTopic
- CreatePartition
- CreateTopic
- CreateTopicIpWhiteList
- DeleteTopic
- DeleteTopicIpWhiteList
- DescribeDatahubTopic
- DescribeTopic
- DescribeTopicAttributes
- DescribeTopicDetail
- DescribeTopicSubscribeGroup
- FetchMessageByOffset
- FetchMessageListByOffset
- ModifyDatahubTopic
- ModifyTopicAttributes
- DescribeTopicSyncReplica
- Instance APIs
- Route APIs
- Other APIs
- Data Types
- Error Codes
- SDK Documentation
- General References
- Conducting Production and Consumption Pressure Testing on CKafka
- Configuration Guide for Common Parameters in CKafka
- Connecting to Legacy Self-Built Kafka
- Suggestions for CKafka Version Selection
- CKafka Data Reliability Description
- Connector
- FAQs
- Service Level Agreement
- Contact Us
- Glossary
Overview
CKafka Pro Edition supports advanced Ops features. You can view the number of TCP connections, unsynced replica details, and topic/consumer group rankings in the console, making it easier for you to troubleshoot CKafka issues.
Directions
1. Log in to the CKafka console.
2. In the instance list, select a region and click the ID/Name of the target instance to enter the instance details page.
3. At the top of the instance details page, click Monitoring > Dashboard and set the time range to view related ranking information.
TCP Connections: Displays the total number of TCP connections to the current broker. It allows you to view the connections to each server more easily when the number of instance connections is about to be used up. When the total TCP connections remain below 500, full data download is supported.

Advanced Topic Metrics
Details of Unsynced Replicas: It displays the details of unsynced replicas.

Node distribution: Displays the replica distribution of a specified topic across broker nodes.

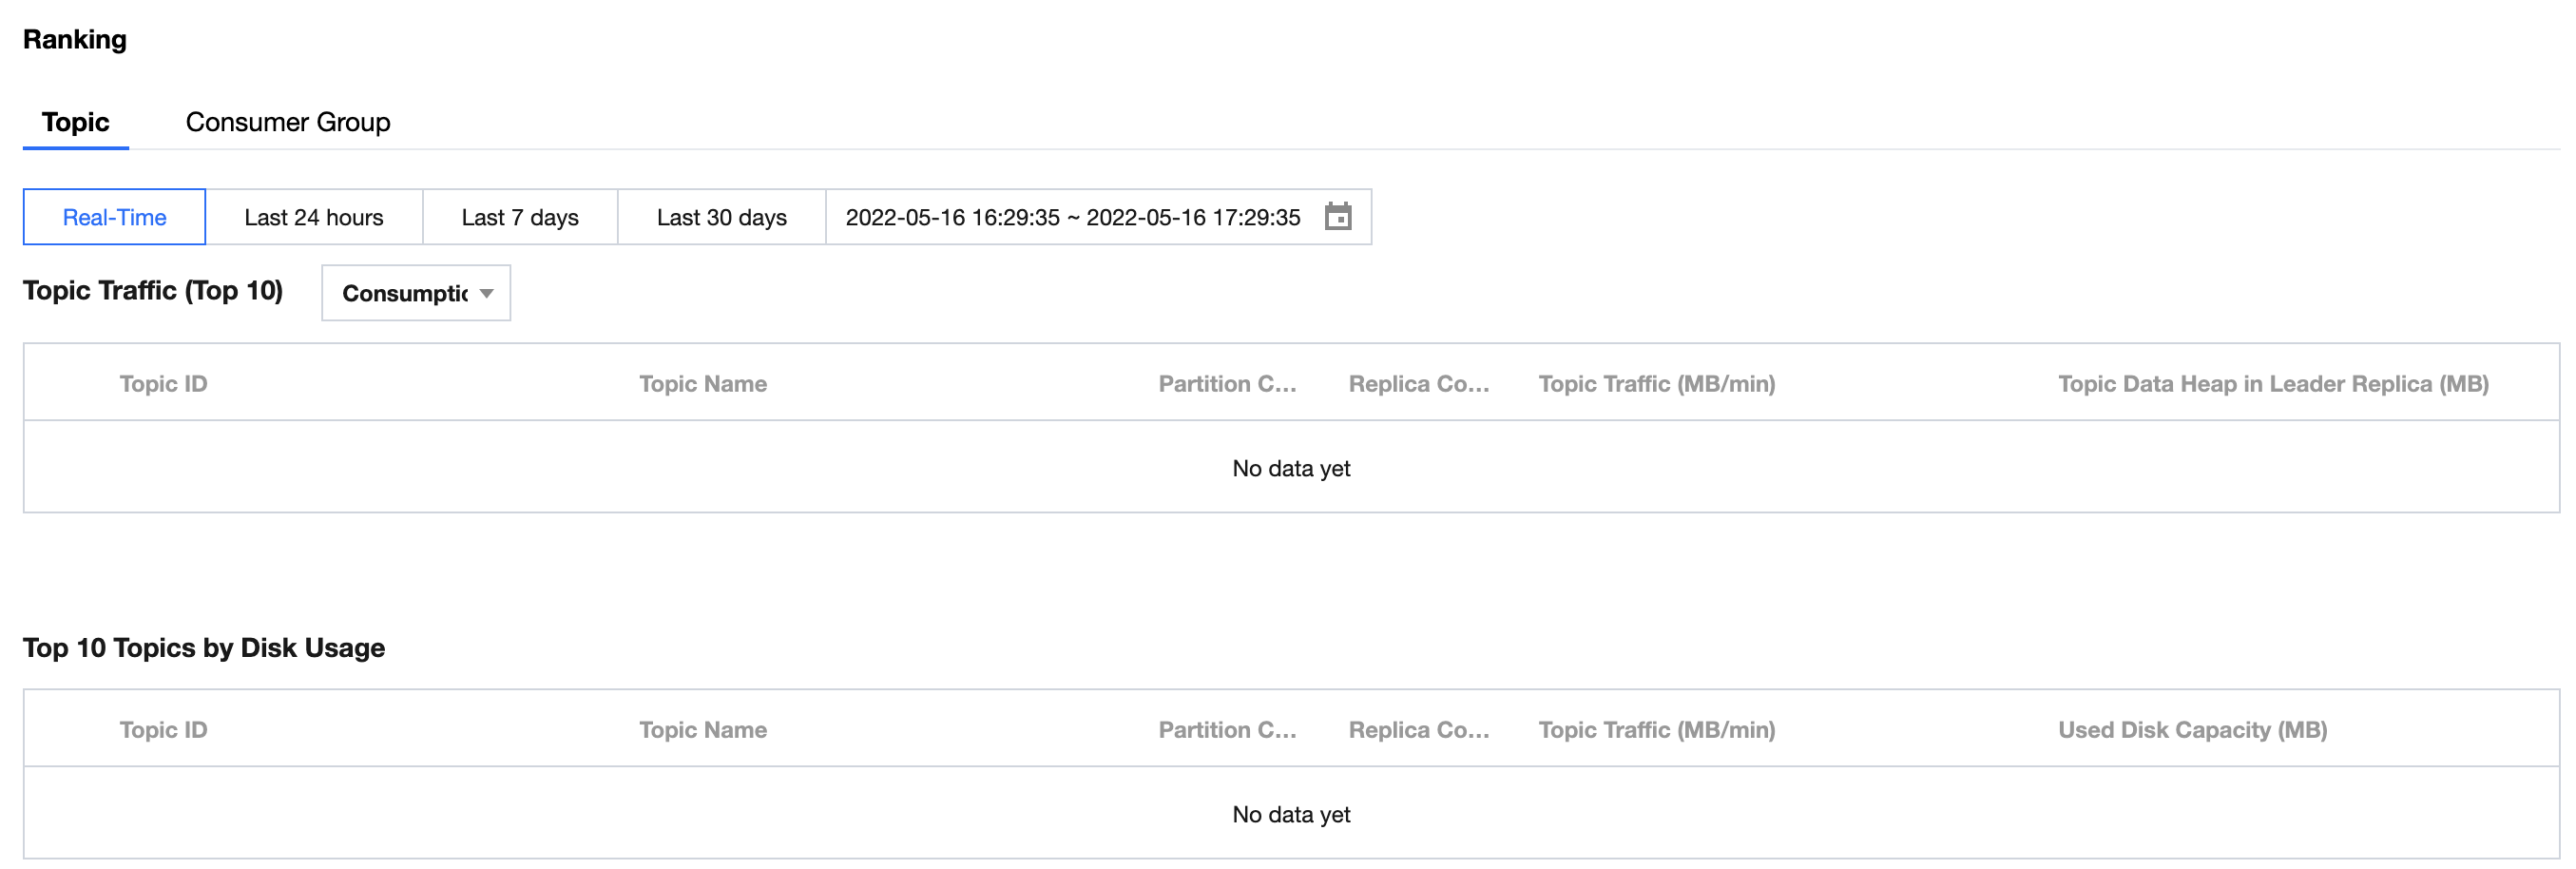
Ranking:
Topic: Displays the top 10 topics in terms of production and consumption traffic as well as disk usage. Supports viewing topic ranking statistics for specific broker nodes.


Consumer Group: It displays the top 10 consumer groups in terms of consumption speed.


 예
예
 아니오
아니오
문제 해결에 도움이 되었나요?