TencentDB for Redis now supports one-minute and five-second monitoring granularities. Since October 2020, monitoring at the five-second granularity has been supported, providing more monitoring metrics and proxy monitoring data. For more information, see Update Notes of Monitoring at Five-Second Granularity.
Changes of monitoring granularity
One-minute monitoring granularity
Instances created before October 20, 2020 only support the one-minute monitoring granularity, but they are gradually upgraded to support the five-second granularity.
View the monitoring data in the TCOP console: TCOP console > TencentDB > **Redis (1-minute granularity)**.
View the monitoring data in the TCOP console: TCOP console > TencentDB > **Redis (5-second granularity)**.
Notes of monitoring granularity upgrade
To support five-second monitoring granularity, the proxy of your TencentDB for Redis instances needs to be upgraded to the latest version.
Note that the proxy upgrade will cause a short disconnection. The business needs to reconnect to the proxy after the upgrade completes.
1. Upgrade by Tencent Cloud backend: Tencent Cloud is upgrading all instances to support five-second monitoring granularity. You will be notified via SMS, email, or Message Center before the upgrade starts.
2. Upgrade by yourself in the TencentDB console: you can soon manually upgrade instances in the console.
3. After all instances are upgraded, the one-minute monitoring granularity will be no longer supported.
Changes of monitoring metrics
After the monitoring granularity is narrowed from one minute to five seconds, monitoring metric names are changed and some new metrics are supported, as shown below:
1-minute metric
5-second metric
Description
CpuUsMin
CpuUtil
Average CPU utilization
CpuMaxUs
CpuMaxUtil
The maximum CPU utilization of a node (shard or replica) in an instance
StorageMin
MemUsed
Actually used memory capacity, including the capacity for data and cache
StorageUsMin
MemUtil
The ratio of the actually used memory to the requested total memory
StorageMaxUs
MemMaxUtil
The maximum among all node (shard or replica) memory utilizations in an instance
KeysMin
Keys
The total number of keys (level-1 keys) in instance storage
ExpiredKeysMin
Expired
The number of keys expired in a time window, which is equal to the value of expired_keys output by the info command.
EvictedKeysMin
Evicted
The number of keys evicted in a time window, which is equal to the value of evicted_keys output by the info command.
ConnectionsMin
Connections
The number of TCP connections to an instance
ConnectionsUsMin
ConnectionsUtil
The ratio of the number of TCP connections to the maximum number of connections
InFlowMin
InFlow
Private network inbound traffic
InFlowUs
InBandwidthUtil
The ratio of the actually used private inbound traffic to the maximum traffic
-
InFlowLimit
The number of times inbound traffic triggers a traffic limit
OutFlowMin
OutFlow
Private network outbound traffic
OutFlowUs
OutBandwidthUtil
The ratio of the actually used private outbound traffic to the maximum traffic
-
OutFlowLimit
The number of times outbound traffic triggers a traffic limit
LatencyMin
LatencyAvg
The average execution latency between the proxy and the Redis server
-
LatencyMax
The maximum execution latency between the proxy and the Redis server
-
LatencyP99
The P99 latency between the proxy and the Redis server
LatencyGetMin
LatencyRead
The average execution latency of read commands between the proxy and the Redis server
LatencySetMin
LatencyWrite
The average execution latency of write command between the proxy and the Redis server
LatencyOtherMin
LatencyOther
The average execution latency of commands (excluding write and read commands) between the proxy and the Redis server
QpsMin
Commands
Queries per second
StatGetMin
CmdRead
The number of read command executions per second
StatSetMin
CmdWrite
The number of write command executions per second
StatOtherMin
CmdOther
The number of command (excluding write and read commands) executions per second
BigValueMin
CmdBigValue
The number of executions of requests larger than 32 KB per second
-
CmdKeyCount
The number of keys accessed by a command per second
-
CmdMget
The number of MGET commands executed per second
SlowQueryMin
CmdSlow
The number of command executions with a latency greater than the slowlog-log-slower-than configuration
StatSuccessMin
CmdHits
The number of keys successfully requested by read commands, which is equal to the value of the keyspace_hits metric output by the info command.
StatMissedMin
CmdMiss
The number of keys unsuccessfully requested by read commands, which is equal to the value of the keyspace_misses metric output by the info command.
CmdErrMin
CmdErr
The number of command execution errors. For example, the command does not exist, parameters are incorrect, etc.
CacheHitRatioMin
CmdHitsRatio
Key hits/(key hits + key misses). This metric can reflect the situation of cache miss.
Viewing the monitoring granularity of an instance
Check the value of the InstanceSet.MonitorVersion field returned by the DescribeInstances API. If the value is 5s, this instance supports the monitoring granularity of five seconds; if the value is 1m, it supports only the monitoring granularity of one minute.
Log in to the TencentDB for Redis console, click an instance name to enter the instance management page, select System Monitoring > Monitoring Metrics, and click the Period drop-down list at the top. If you can select 5 seconds from the drop-down list, this instance supports the monitoring granularity of five seconds, or else it supports only the monitoring granularity of one minute.
Alarm Changes
Changes of alarm policy configurations
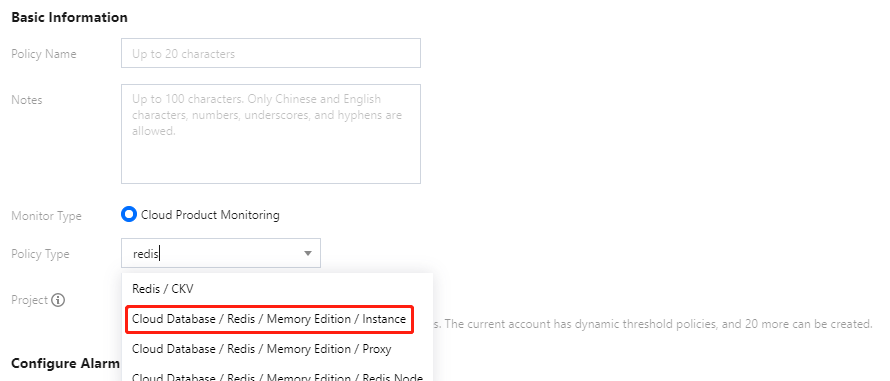
After the monitoring metrics are upgraded, you need to configure one-minute-granularity and five-second-granularity alarm policies in different windows in the TCOP console.
Impact of monitoring upgrade
After the monitoring granularity is narrowed from one minute to five seconds, you need to migrate the one-minute-granularity alarm policies to the five-second-granularity alarm policies. The monitoring metrics applicable to the five-second granularity alarm policies are different from those applicable to one-minute granularity alarm policies. For more information, see Changes of monitoring metrics.
After the monitoring granularity is narrowed down to five seconds:
Monitoring data at both one-minute and five-second granularities are reported temporarily, that is, Cloud Monitor will stop reporting the one-minute-granularity data in the future.
One-minute-granularity alarm policies are valid temporarily.
The default five-second-granularity alarm policy is associated. Please specify alarm recipients for the default policy.
Migrating alarm policies
Manual migration: copy the existing one-minute-granularity alarm policies as the five-second-granularity alarm policies, but you need to configure alarm recipients for the five-second-granularity alarm policies.
Automatic migration: after the monitoring granularity upgrade completes, the existing one-minute-granularity alarm policies will be automatically migrated to the five-second-granularity alarm policies, and you will be notified via SMS, email, or Message Center.