DBbrain's latency analysis feature collects the execution latency statistics of all database requests and monitors the latency accurate down to the millisecond. This helps you troubleshoot TencentDB for Redis® instance failures and performance problems.
2. On the left sidebar, select Performance Optimization.
3. At the top of the Performance Optimization page of DBbrain, select the target instance in the Instance ID drop-down list.
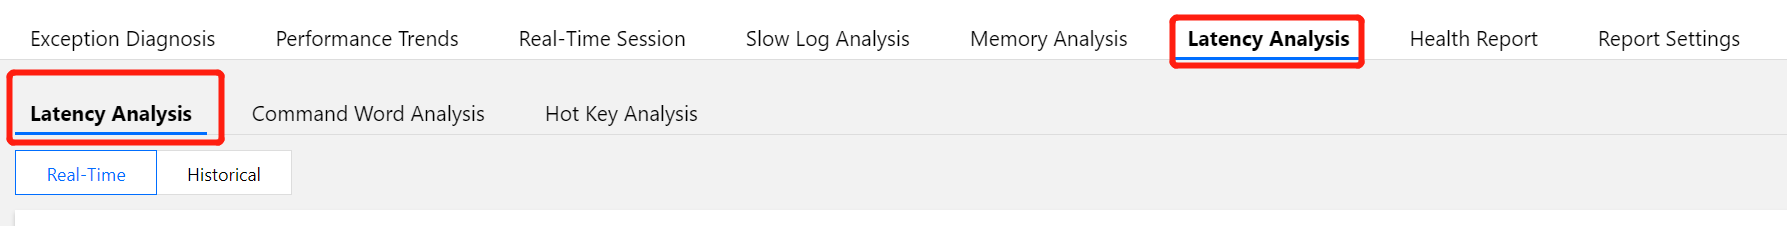
4. Select the Latency Analysis tab and set the collection granularity to 5s, 15s, or 30s as needed in the drop-down list next to Auto-Refresh in the top-right corner.
5. View the monitoring data of latency analysis.
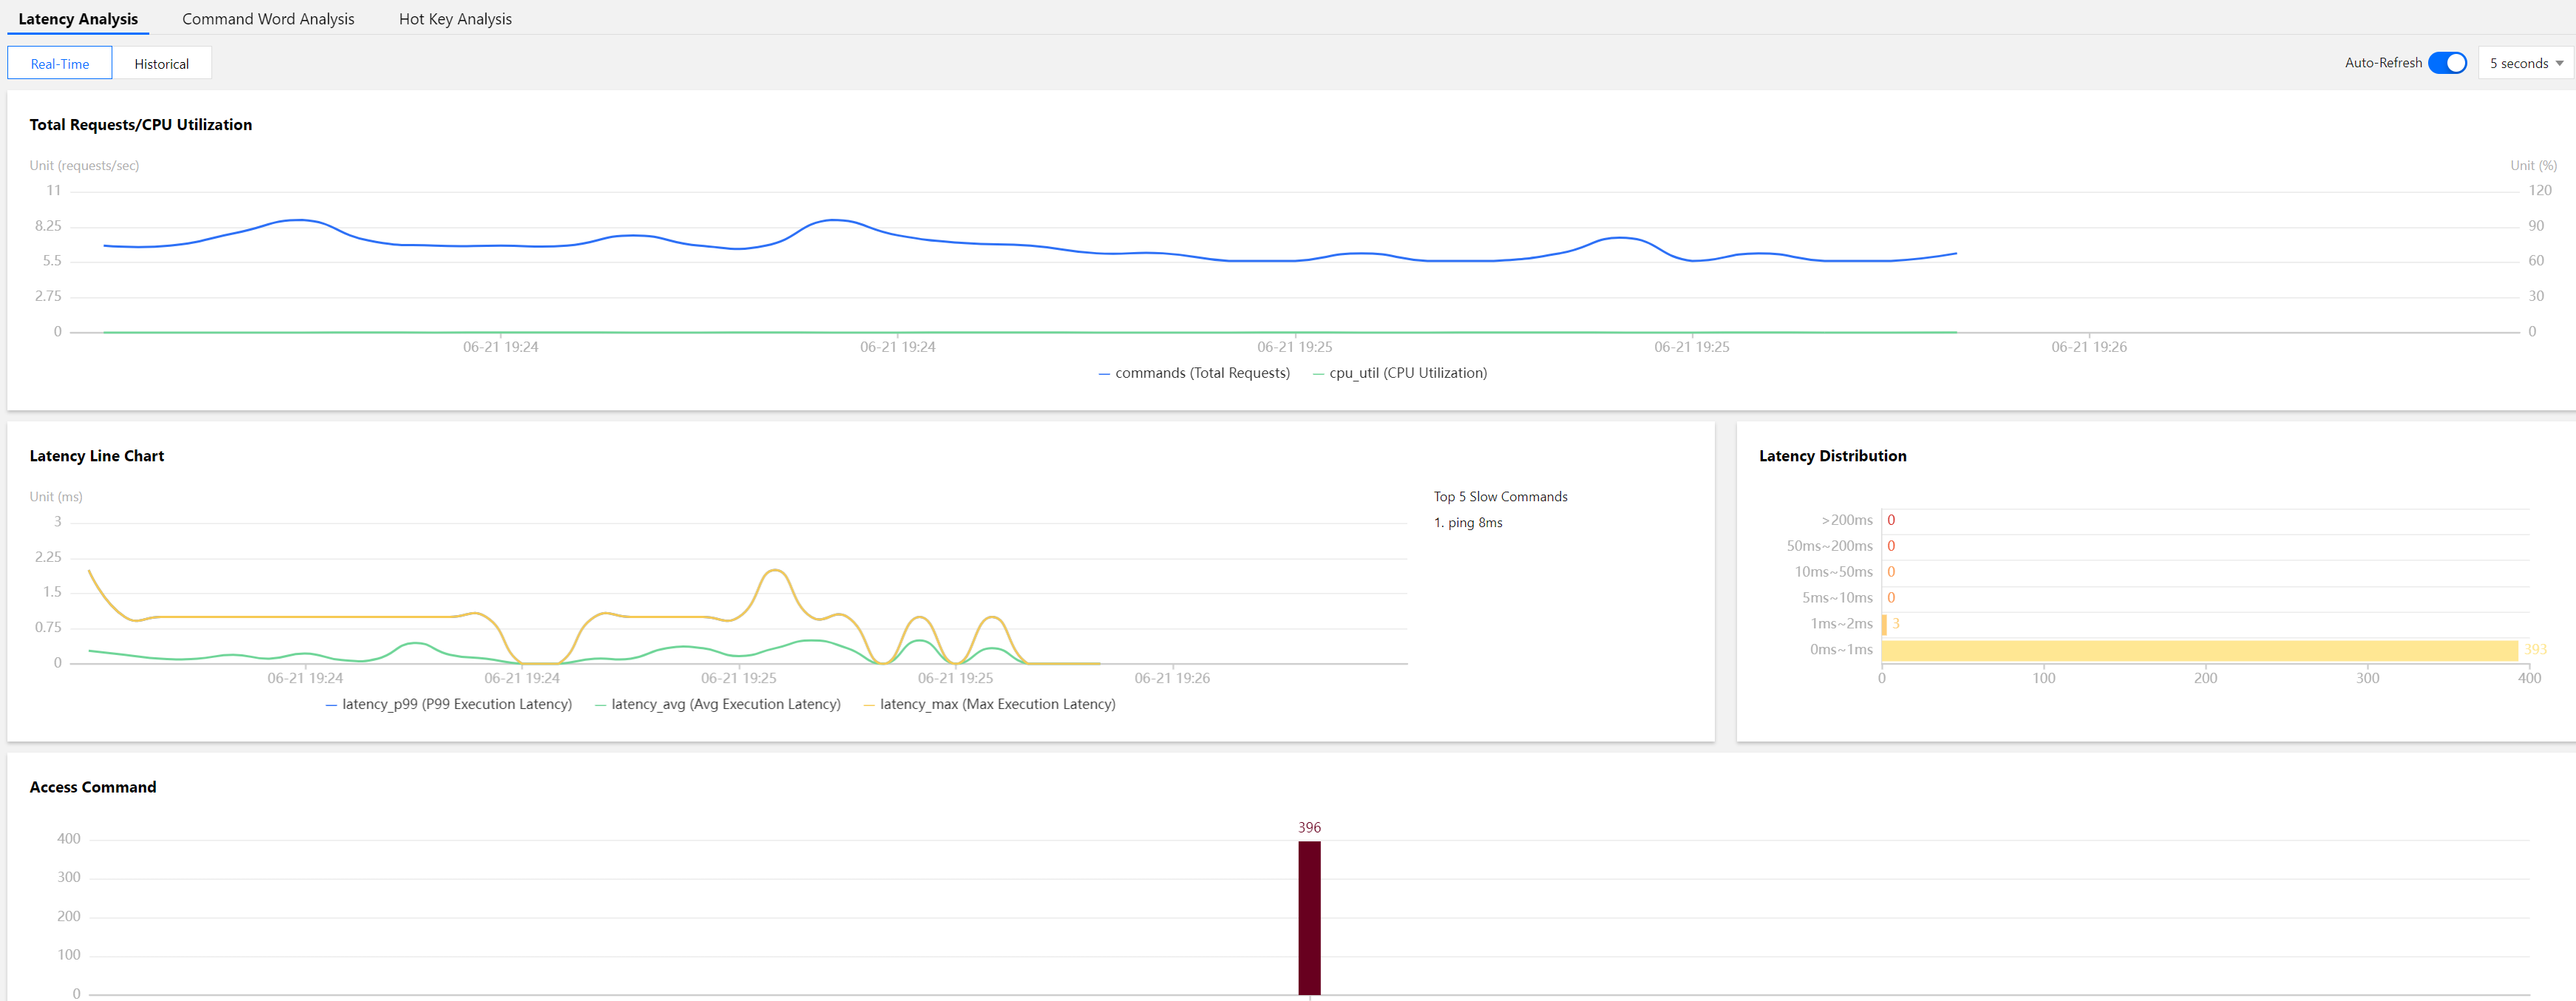
Real-time monitoring
By default, the change in the real-time monitoring data is displayed as a curve.
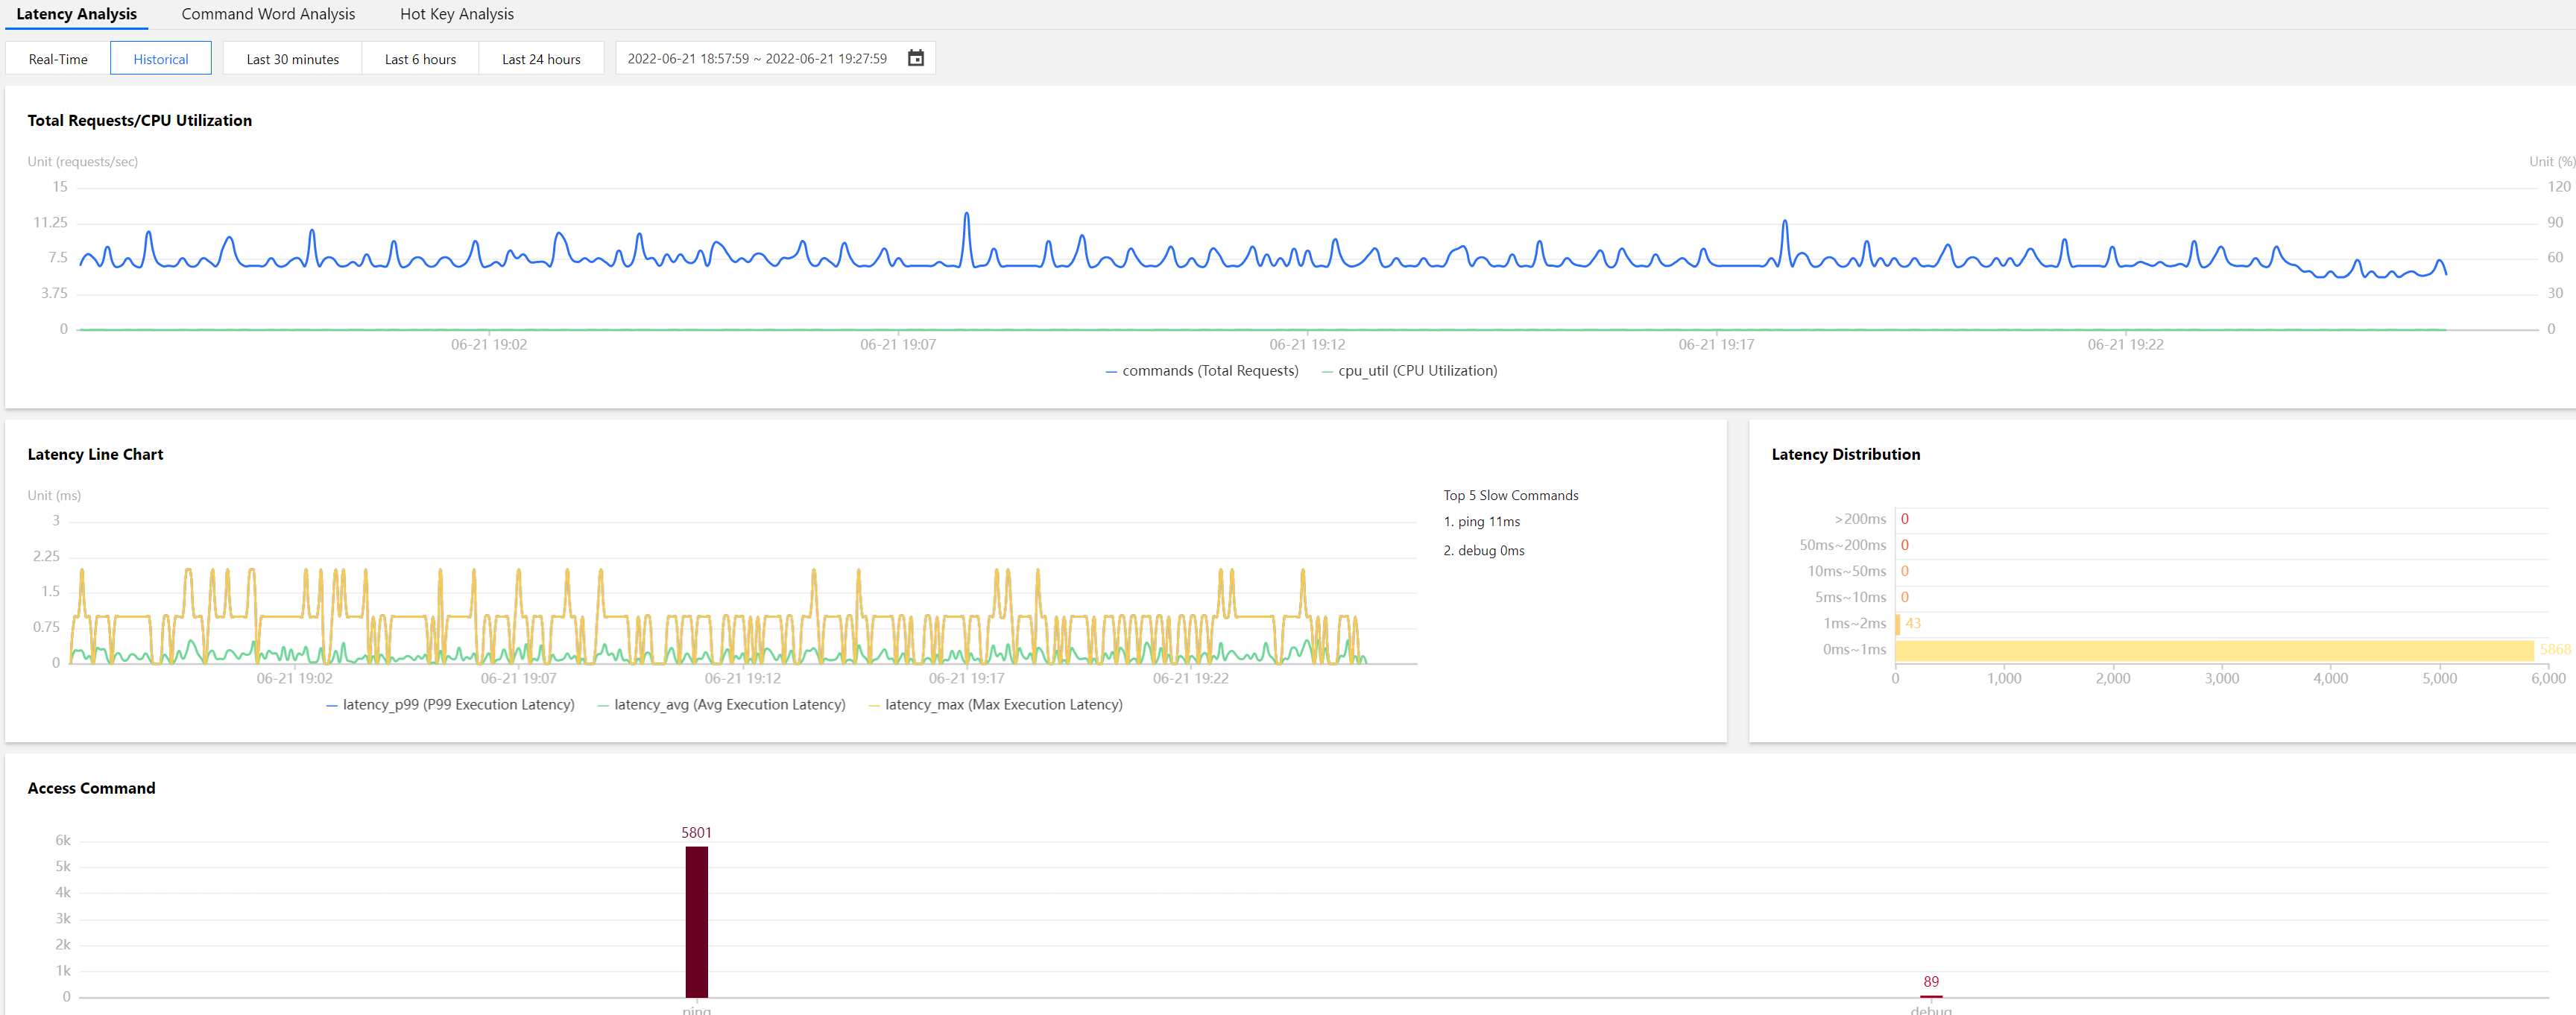
Historical data
Click Historical to view the monitoring data in a past time period.
You can select Last 30 minutes, Last 6 hours, or Last 24 hours to view the specific monitoring data.
Click
in the time selection box to view the monitoring data in the last 2 days.
Latency Analysis Statistics Interpretation
Total requests/CPU utilization
The change trend of the total number of requests to the database instance per second and the corresponding CPU utilization are displayed for you to quickly identify the CPU utilization value when the number of requests is high.
Latency line chart
The change trends of three key metrics for database request execution latency and the top five slow commands are displayed.
P99 Execution Latency: The change trend of the 99th percentile request execution latency.
Average Execution Latency: The change trend of the average request execution latency.
Max Execution Latency: The change trend of the maximum request execution latency.
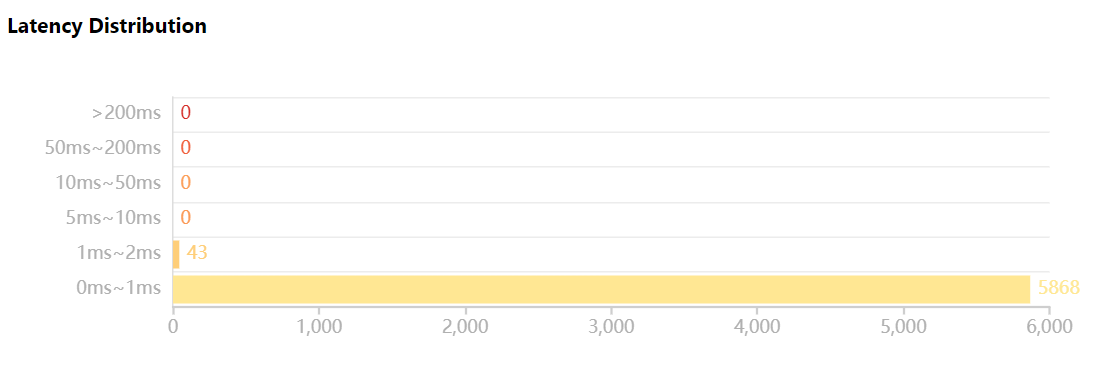
Latency distribution
The numbers of commands with an execution latency in different ranges are displayed in a bar chart, including 0–1 ms, 1–2 ms, 5–10 ms, 10–50 ms, 50–200 ms, and >200 ms. As shown below, the number of commands with an execution latency of 0–1 ms is 2,703.
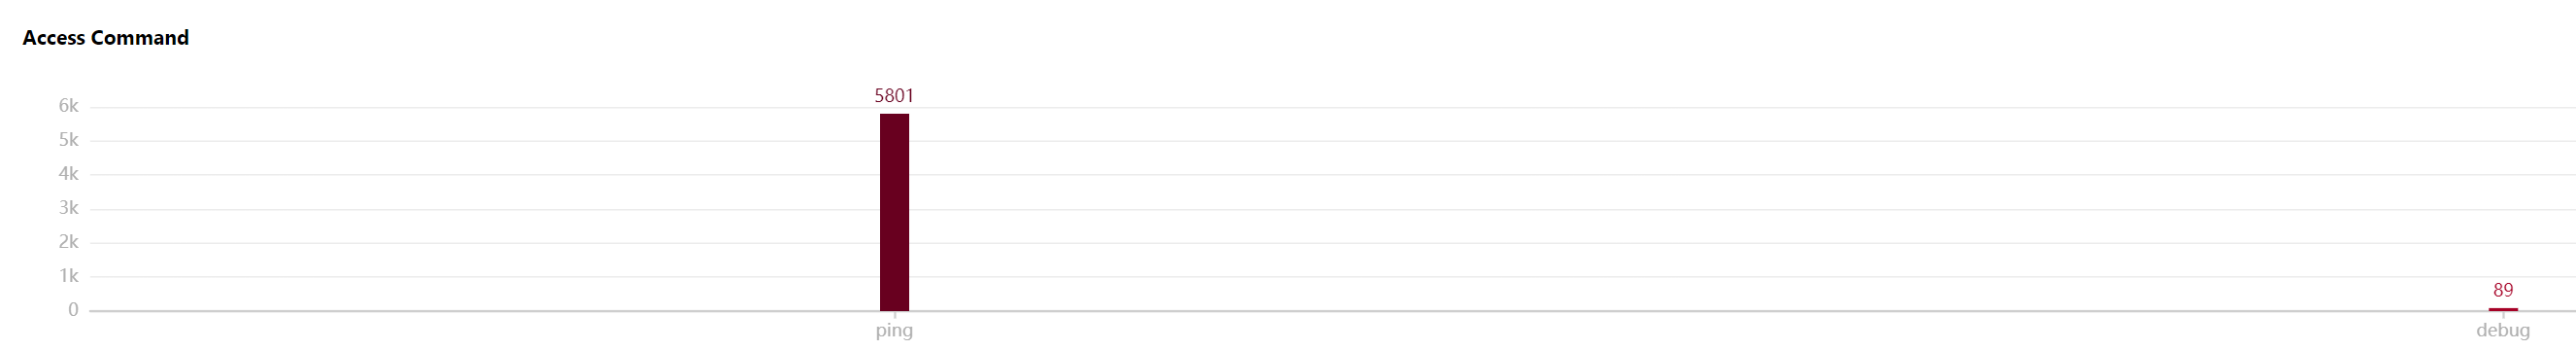
Access command
The number of hits of database access commands is displayed in a column chart. As shown below, the numbers of access requests made by using the AUTH and GET commands are displayed respectively. Click the Command Word Analysis tab to view the statistics of various commands. For more information, see Command Word Analysis.