
监控 Memcached 版实例

最后更新时间:2024-11-05 10:26:14
Memcached 版实例提供实例维度完整透明的监控服务,汇总了整个实例的监控数据,通过 SUM、AVG、MAX、LAST 等聚合算法聚合而成。
查看实例监控粒度
通过 Redis 控制台 查看:单击实例 ID 进入实例详情页面,选择系统监控 > 监控指标页面,Redis 目前支持5秒、1分钟、5分钟、1小时、1天的粒度的指标监控,各粒度监控数据保留时长请参见 使用约束。
通过 API 接口 DescribeInstances 返回的字段 InstanceSet.MonitorVersion 判断:MonitorVersion = 5s,表示为5秒粒度;MonitorVersion = 1m,表示为1分钟粒度。
查看监控数据
您可以通过 Redis 实例列表、Redis 系统监控页面、腾讯云可观测平台控制台分别查看监控信息。
通过实例列表快速查看监控数据
1. 登录 Redis 控制台。
2. 在右侧实例列表页面上方,选择地域。
3. 在实例列表中,找到目标实例。
4. 在目标实例所在行,单击监控/状态/任务列中的

通过系统监控页面查看监控数据
1. 登录 Redis 控制台。
2. 在右侧实例列表页面上方,选择地域。
3. 在实例列表中,找到目标实例。
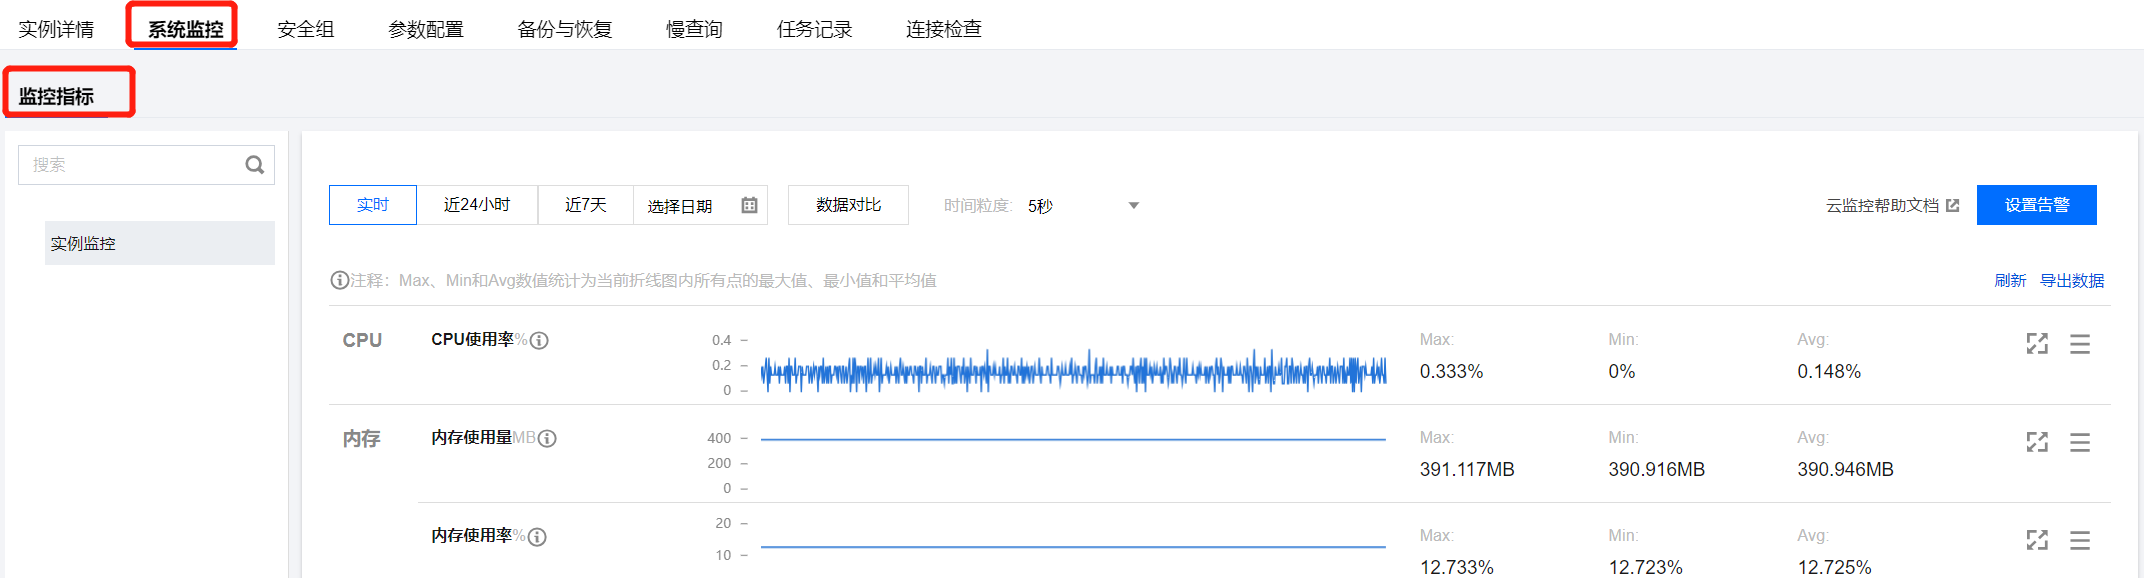
4. 单击蓝色字体的实例 ID,进入实例详情页面,单击系统监控页签,再选择监控指标页签,查看监控数据。
通过腾讯云可观测平台查看监控数据
实例监控
实例监控汇总了整个实例的监控数据,通过 SUM、AVG、MAX、LAST 等聚合算法聚合而成。
分组 | 指标中文名 | 指标英文名 | 单位 | 指标说明 |
CPU 监控 | CPU 使用率 | cpu_util | % | 平均 CPU 使用率 |
内存监控 | 内存使用量 | mem_used | MB | 实际使用内存容量,包含数据和缓存部分 |
| 内存使用率 | mem_util | % | 实际使用内存和申请总内存之比 |
| Key 总个数 | keys | 个 | 实例存储的总 Key 个数(一级 Key) |
| Key 过期数 | expired | 个 | 时间窗内被淘汰的 Key 个数,对应 info 命令输出的 expired_keys |
| Key 驱逐数 | evicted | 个 | 时间窗内被驱逐的 Key 个数,对应 info 命令输出的 evicted_keys |
| Key 设置过期时间数 | expires |
个
| 实例中设置过期时间的 Key 数量(一级 Key) |
网络监控 | 连接数量 | connections | 个 | 连接到实例的 TCP 连接数量 |
| 连接使用率 | connections_util | % | 实际 TCP 连接数量和最大连接数比 |
| 入流量 | in_flow | Mb/s | 每秒流入数据库的流量 |
| 入流量使用率 | in_bandwidth_util | % | 内网入流量实际使用和最大带宽的占比 |
| 入流量限流触发 | in_flow_limit | 次 | 入流量超过最大带宽的次数 |
| 出流量 | out_flow | Mb/s | 每秒流出数据库的流量 |
| 出流量使用率 | out_bandwidth_util | % | 出流量实际使用和最大带宽的占比 |
| 出流量限流触发 | out_flow_limit | 次 | 出流量超过最大带宽的次数 |
时延 | 平均执行时延 | latency_avg | ms | 请求执行时延平均值 |
| 最大执行时延 | latency_max | ms | 执行时延最大值 |
| 读平均时延 | latency_read | ms | 读命令平均执行时延 |
| 写平均时延 | latency_write | ms | 写命令平均执行时延 |
| 其他命令平均时延 | latency_other | ms | 读写命令之外的命令平均执行时延 |
请求监控 | 总请求 | commands | 次/秒 | QPS,命令执行次数 |
| 读请求 | cmd_read | 次/秒 | 读命令执行次数 |
| 写请求 | cmd_write | 次/秒 | 写命令执行次数 |
| 其他请求 | cmd_other | 次/秒 | 读写命令之外的命令执行次数 |
| 大 Value 请求 | cmd_big_value | 次/秒 | 请求命令大小超过32KB的执行次数 |
| Key 请求数 | cmd_key_count | 秒 | 命令访问的 Key 个数 |
| Mget 请求数 | cmd_mget | 个/秒 | Mget 命令执行次数 |
| 慢查询 | cmd_slow | 次 | 执行时延大于 slowlog - log - slower - than 配置的命令次数 |
| 读请求命中 | cmd_hits | 次 | 读请求 Key 存在的个数,对应 info 命令输出的 keyspace_hits 指标 |
| 读请求Miss | cmd_miss | 次 | 读请求 Key 不存在的个数,对应 info 命令输出的 keyspace_misses 指标 |
| 执行错误 | cmd_err | 次 | 命令执行错误的次数,例如,命令不存在、参数错误等情况 |
| 读请求命中率 | cmd_hits_ratio | % | Key 命中 / (Key 命中 + KeyMiss),该指标可以反映 Cache Miss 的情况 |
文档反馈