
Elasticsearch Service

Last updated: 2025-09-29 10:09:15
Overview
The CKafka Connector supports converting streaming data into searchable, analyzable structured storage, suitable for real-time log monitoring, user behavior retrieval, and IoT device status analysis in various scenarios. For example:
Business logs are synchronized to Elasticsearch via Kafka and leverage Kibana for monitoring visualization.
Write user clickstream or order data to Elasticsearch Service in real time, supporting fast retrieval and queries with complex conditions.
The connector provides near real-time writing (data visible within seconds), automatic index management (dynamic adaptation to JSON structure), and data preprocessing (JSON parsing, field trimming). It effectively isolates abnormal data through the dead letter queue mechanism and ensures transmission reliability with a retry policy. Widely used for user behavior analysis in online education platforms or rapid troubleshooting of sensor exception data in smart hardware scenarios.
Restrictions and Limitations
ES supports only Elasticsearch Service version 7.0 and later.
Prerequisites
The feature currently depends on Elasticsearch Service. Enable related product features and prepare an ES cluster during use.
Creating an Elasticsearch Service Connection
1. Log in to the CKafka console.
2. In the left sidebar, select Connector > Connection List, and click Create Connection after selecting a region.
3. After selecting a region, choose Elasticsearch Service as the connection type, click Next, and set the connection information on the connection configuration page.
Connection name: Fill in the connection name to distinguish different ES connections.
Description: Optional. Fill in the connection description with a maximum of 128 characters.
ES Instance Cluster: Select a Tencent Cloud Elasticsearch Service instance cluster.
Instance username: Manually input the Elasticsearch instance username. The Tencent Cloud Elasticsearch default username is elastic and cannot be changed.
Instance password: Input the Elasticsearch instance password.
4. Click Next to start connection verification. After successful verification, the connection is created. You can see the created connection in the connection list.
Creating a Data Sync Task
1. In the left sidebar, click Connector > Task List, and click Create Task after selecting a region.
2. Configure the basic task information in the new task pop-up window.
Task name: Enter the task name to distinguish different data sync tasks. It can only contain letters, digits, underscore, "-", and ".".
Description: Optional. Fill in the task description with a maximum of 128 characters.
Task type: Select data export
Data target type: Select Elasticsearch Service.
3. Click Next to configure data source information.
Configuring a Data Source
1. Configure the data source information on the data source configuration page.
Parameter | Description |
Data Source Type | Only supports topics within a CKafka instance. |
CKafka instance | In the drop-down list, select the prepared source CKafka instance. |
Source Topic | In the drop-down list, select the prepared Data Source Topic. If the data source instance has an ACL policy, please ensure you have read/write permissions for the selected Data Source Topic. |
Starting Position | Configure Topic offset to set the processing policy for historical messages during transfer. It supports the following three methods: Start consuming from the most recent location: the maximum offset, consuming from the latest data (skipping historical messages). Start consuming from the beginning: the minimum offset, consuming from the earliest data (handling all historical messages). Start consuming from a time point: start consuming from a time point customized by users. |
2. Confirm the information is correct, then click Next to configure the data processing rule.
Configuring Data Processing Rules
1. On the "Data Processing Rule" webpage, click Preview Topic Message at the source data to parse the Source Topic's first message.
Note:
Currently, the following conditions must be met to parse a message: the message must be in JSON String Structure, and the source data must be in single-layer JSON format. For nested JSON format, use data processing to perform simple message format conversion.
2. If you need to clean the source data, turn on the Process Source Data button and execute Procedure 3. If no data cleaning is required and you only need to complete data synchronization, you can skip the subsequent steps and directly enter the next phase to configure the data target.
3. (Option) Data processing rule configuration supports local import of templates. If you have a prepared rule template, just import it directly. If not, continue to execute Procedure 4 to configure the data processing rule. After completing the configuration, you can also export and store it as a template for reuse in other tasks.
4. Select the data source in "Original Data". It supports pulling from Source Topic or Custom. Here, pulling from Source Topic is used as an example.
5. In "Parsing Mode", select the corresponding data parsing mode and confirm. You can see the parsing result. Here, JSON mode is used as an example. Click on the left parsing result to generate a structured preview on the right.
Parsing Mode | Description |
JSON | Parse standard data in JSON format, support nested field, output format as key-value pair. |
Delimiter | Parse unstructured text with a specified delimiter. Supported delimiters include space, tab character, ,, ;, |, :, and custom. |
Extract Regular Expression | Suitable for extracting specific fields from messages of long array type. You can manually fill in a regular expression or use the automatically generated regular expression feature to retrieve automatically. For details, see Extract and Parse Mode Description. Note: When the input regular expression contains capture groups like (?<name>expr) or (?P<name>expr), it will deem the regular expression as a pattern string for matching. If the message successfully matches the pattern string, the capture group content will be parsed; otherwise, the entire input regular expression will be considered as a capture group, and ALL matched content in the message will be extracted. |
JSON object array - single-line output | Each object in the array has the same format. Only the first object is parsed during processing, and the output result is a single JSON in map type. |
JSON object array - multi-line output | All objects in the array have the same format. Only the first object is parsed, and the output result is an array. |
6. If enabled, key-value secondary parsing will perform key-value parsing again on the data in the value.
7. In the "Data Processing" section, set data processing rules. Here you can edit fields, delete entries, adjust timestamp format, and add new system time fields. Click Process value to add a processing chain for reprocessing single data entries.
Operation | Description |
map | Select existing KEY, the output VALUE is mapped from the specified KEY. |
JSONPATH | Parse multi-level nested JSON data, use the $ symbol at the . symbol to locate specific fields in multi-layer JSON. For details, see JSONPath description. |
system preset - current system time | Choose the system preset VALUE. Currently supports DATE (timestamp). |
Custom | Enter a custom VALUE. |
8. Click Test to view the test result of data processing. At this point, you can add a processing chain based on actual business needs to handle the above data processing result again.
9. In the "Filter", choose whether to enable the filter. If enabled, it can only output data that meets filter rules. The filter supports prefix match, suffix matching, inclusion match (contains), exclusion match (except), numerical matching, and IP match. For details, refer to Filter Rule Description.
10. In "Reserve Topic source data", choose whether to enable Topic source data retention.
11. In "Output format", set the output content, which defaults to JSON and supports ROW format. If you select ROW format, you need to select the output row content.
Output Row Content | Description |
VALUE | test result output top above separator separate options option test result default by default default |
KEY&VALUE | Output the KEY and VALUE in the test result at the top. The separator between KEY and VALUE and the separator between VALUEs cannot be "None". |
12. Set message processing rules for delivery failure in "failure message handling". It supports three methods: drop, reserve, and deliver to dead-letter queue.
Solutions | Description |
drop | Suitable for production environment. It will ignore the current failure message when a task running failure occurs. Recommend using "reserved" mode for test is correct, then edit task to "drop" mode for production. |
Reserved | Suitable for testing environment. It will terminate task without retry and record failure reason in event center. |
Deliver to Dead Letter Queue | Specify dead letter queue Topic. Suitable for strict production environment. When a task running failure occurs, it will send the failure message, metadata, and failure reason to the designated CKafka Topic. |
13. After completing data rules setting, you can directly click Export at the top to save as a Template, then reuse it in subsequent data tasks to reduce operation cost from duplicate configuration.
14. Click Next to configure data target.
Configuring a Data Target
1. Configure the data target on the destination page.
Source data: Click to pull source Topic data. If no data available in the source Topic, you can also customize data.
Data target: Select the one created in advance for data export to Elasticsearch Service connection.
Index name: Fill in the index name. The index name must be in lowercase and support JSONPath grammar.
Index name split by date: Optional. Once enabled, select a date format. Indexes written to ES will be %(index name)_%(date).
Failure message handling: Select the processing method for failed deliveries. It supports three methods: drop, reserve, and ship to CLS (requires specifying the log topic for shipping and authorizing access to Cloud Log Service (CLS)).
Reserved: Suitable for testing environment. It will terminate task without retry and record failure reason in event center.
Drop: Suitable for production environment. It will ignore the current failure message when a task running failure occurs. Recommend using "reserved" mode for test is correct, then edit task to "drop" mode for production.
Ship to CLS: Suitable for strict production environment. Task running failure will upload failure message, metadata, and failure reason to the designated CLS topic.
Dead letter queue: Suitable for strict production environment. Task running failure will send the failure message, metadata, and failure reason to the designated CKafka Topic.
Data Source Type
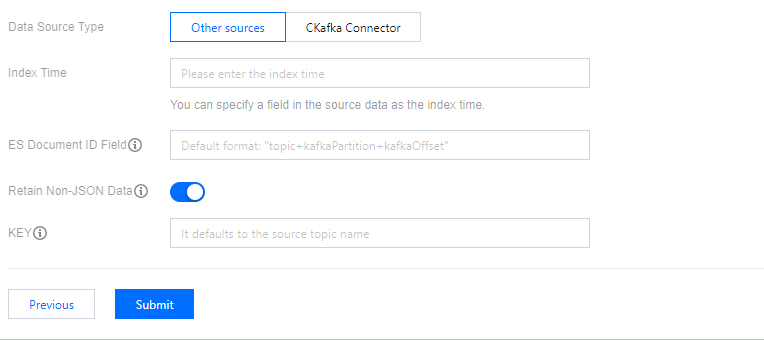
Index time: You can specify a field in the source data as the index time. Defaults to the message delivery time.
ES Document ID Field: You can specify the value of this field as the ES document ID. Defaults to
topic+kafkaPartition+kafkaOffset.Retain non-JSON data: if enabled, specify a KEY for shipping. If disabled, drop non-JSON data.
KEY: When the internal data in the source Topic is not in JSON format, you can specify a key to assemble it into JSON delivery to ES.
This option is only used for connector subscription to synchronize create, delete, and update operations from a relational database to a Topic and then to ES. It identifies database changes to maintain data consistency between ES and the source table.
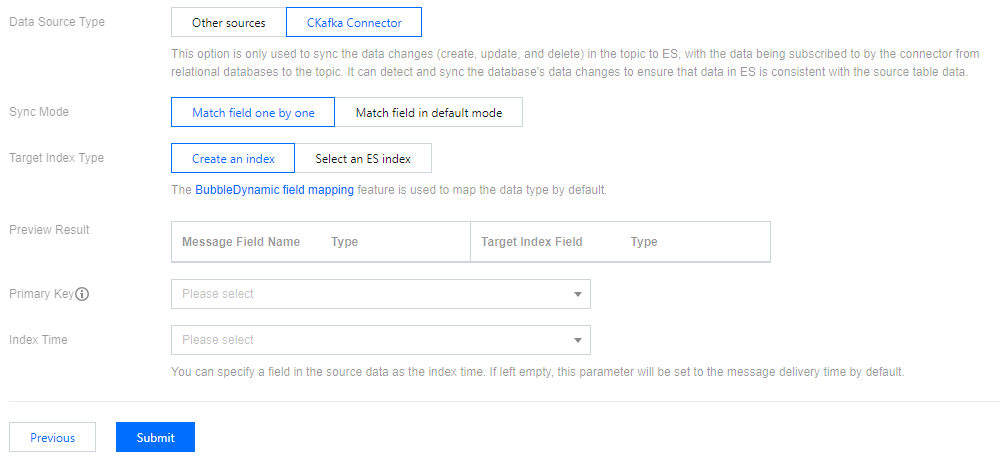
Synchronization mode: If you select field-by-field matching, you can customize the mapping relationship between the custom message field name and the target index field. If you select default field matching, the message key will be used as the field name in the ES index mapping.
Target index type: choose to create index or select from existing ES index.
Primary key: Use the primary key of the specified database table as the document ID value in ES.
Index time: You can specify a field in the source data as the index time. Defaults to the message delivery time.
2. Click Submit to complete task creation. You can see the created data sync task on the task list page. After successful task creation, data synchronization will automatically start based on task settings, enabling real-time data replication.
View Data Sync Progress
1. On the task list page, click the "ID" of the created task to enter the basic information webpage about the task.
2. At the top of the page, select the Sync Progress tab to view data synchronization progress and details.
Was this page helpful?
You can also Contact Sales or Submit a Ticket for help.
Yes
No
Feedback