NGINX is a high-performance HTTP and reverse proxy server. By analyzing NGINX logs, you can obtain various valuable results, such as data support for website diagnosis and tuning, website stability monitoring, and operations statistics. This document introduces how to use CLS to comprehensively mine NGINX log data.
Tune the page with the highest access latency.
For example, the /4nm8c.html page has the highest access latency and needs to be tuned. To tune the page, you need to calculate the page access PV, UV, request method statistics, request status statistics, browser statistics, average access latency, and highest access latency.
request_uri:"/4nm8c.html*"|select count(1) as pv,
approx_distinct(remote_addr) as uv,
histogram(method) as method_pv,
histogram(status) as status_pv,
histogram(user_agent) as user_agent_pv,
avg(request_time) as avg_latency,
max(request_time) as max_latency
Monitoring website stability
Requirement description
In terms of performance problems, website errors, and traffic slump or surge, you can detect problems before users based on threshold-based log monitoring.
Solution
It is more accurate to use percentiles (such as highest latency of the 99% percentile) in mathematical statistics as alarm trigger conditions. If average or individual values are used as alarm trigger conditions, the latency of some individual requests will be averaged, failing to reflect the actual situation. For example, you can use the following query analysis statement to calculate the average latency of each minute, the latency of the 50th percentile, and the latency of the 90th percentile in a one-day window (1,440 minutes).
* | select avg(request_time) as l, approx_percentile(request_time, 0.5) as p50, approx_percentile(request_time, 0.9) as p90, time_series(__TIMESTAMP__, '5m', '%Y-%m-%d %H:%i:%s', '0') as time group by time order by time desc limit 1440
The system will report alarms when the latency of the 99th percentile is greater than 100 ms and display the affected URLs and users affected in the alarm information. In this way, you can quickly understand the error situation.
When receiving the alarm information, you can find out the top affected URLs and users and make targeted alarm recovery measures accordingly.
Analyzing website access information
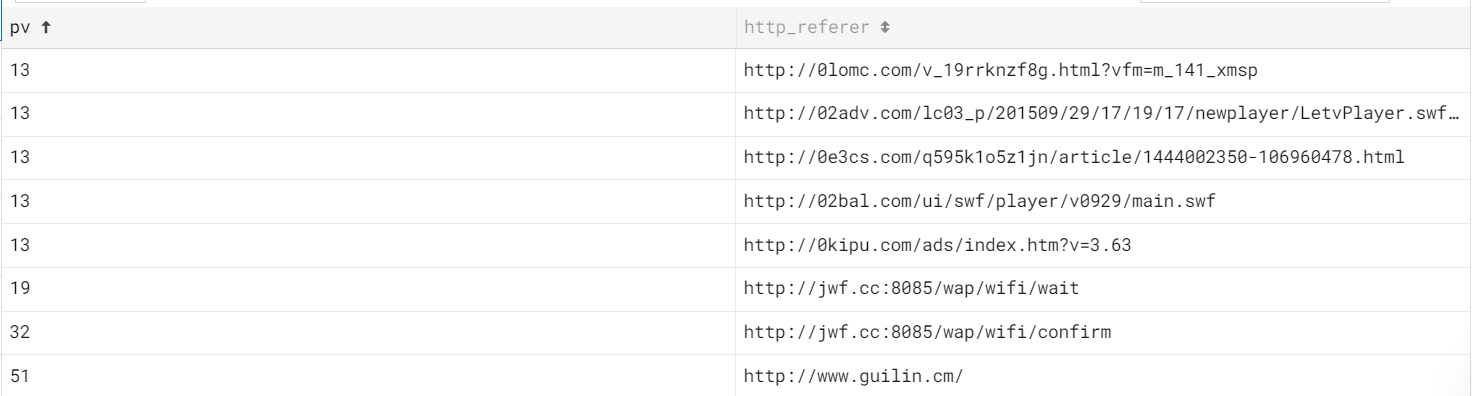
With CLS, you can build an operations data dashboard to quickly analyze website access information such as access PV/UV statistics, access geographic information statistics, top 10 access sources, and top 10 access addresses.
Collect statistics on the access IP sources of the recent day