Cloud Log Service
- Release Notes and Announcements
- Announcements
- Product Introduction
- Limits
- Log Collection
- Purchase Guide
- Pay-as-You-Go
- Getting Started
- Operation Guide
- Resource Management
- Permission Management
- Log Collection
- Collection by LogListener
- LogListener Installation and Deployment
- Collecting Text Log
- Collecting Logs in Self-Built Kubernetes Cluster
- Importing Data
- Metric Collection
- Log Storage
- Search and Analysis (Log Topic)
- Statistical Analysis (SQL)
- SQL Syntax
- SQL Functions
- Search and Analysis (Metric Topic)
- Dashboard
- Creating Statistical Charts
- Data Processing documents
- Data Processing
- Data Processing Functions
- Scheduled SQL Analysis
- Shipping and Consumption
- Shipping to COS
- Shipping to CKafka
- Shipping to ES
- Log Shipping
- Consumption over Kafka
- Monitoring Alarm
- Managing Alarm Policies
- Channels to Receive Alarm Notifications
- Cloud Insight
- Historical Documentation
- Practical Tutorial
- Search and Analysis
- Monitoring Alarm
- Shipping and Consumption
- Developer Guide
- API Documentation
- Making API Requests
- Topic Management APIs
- Log Set Management APIs
- Topic Partition APIs
- Machine Group APIs
- Collection Configuration APIs
- Log APIs
- Metric APIs
- Alarm Policy APIs
- Data Processing APIs
- Kafka Protocol Consumption APIs
- CKafka Shipping Task APIs
- Kafka Data Subscription APIs
- COS Shipping Task APIs
- SCF Delivery Task APIs
- Scheduled SQL Analysis APIs
- COS Data Import Task APIs
- FAQs
- Health Check
- Collection
- Log Search

TKE Cloud Insight

Last updated: 2025-04-07 14:50:45
TKE Cloud Insight provides one-stop collection, search, and analysis of Tencent Kubernetes Engine (TKE) business logs, audit logs, and event logs. Meanwhile, based on audit and event logs, it offers out-of-the-box audit and event analysis dashboards to help quickly build observability of TKE access analysis.
Features
Provide out-of-the-box TKE cluster audit and event analysis dashboards.
Unify the entry for TKE cluster audit and event log search and analysis.
Start TKE cluster business logs, audit logs, and event logs collection in batches.
Prerequisites
Directions
Enabling Cluster Business Log Collection
Step1: Selecting a Cluster
1. Log in to the Cloud Log Service console.
2. Click Cloud Insight in the left navigation bar to go to the Cloud Insight page.
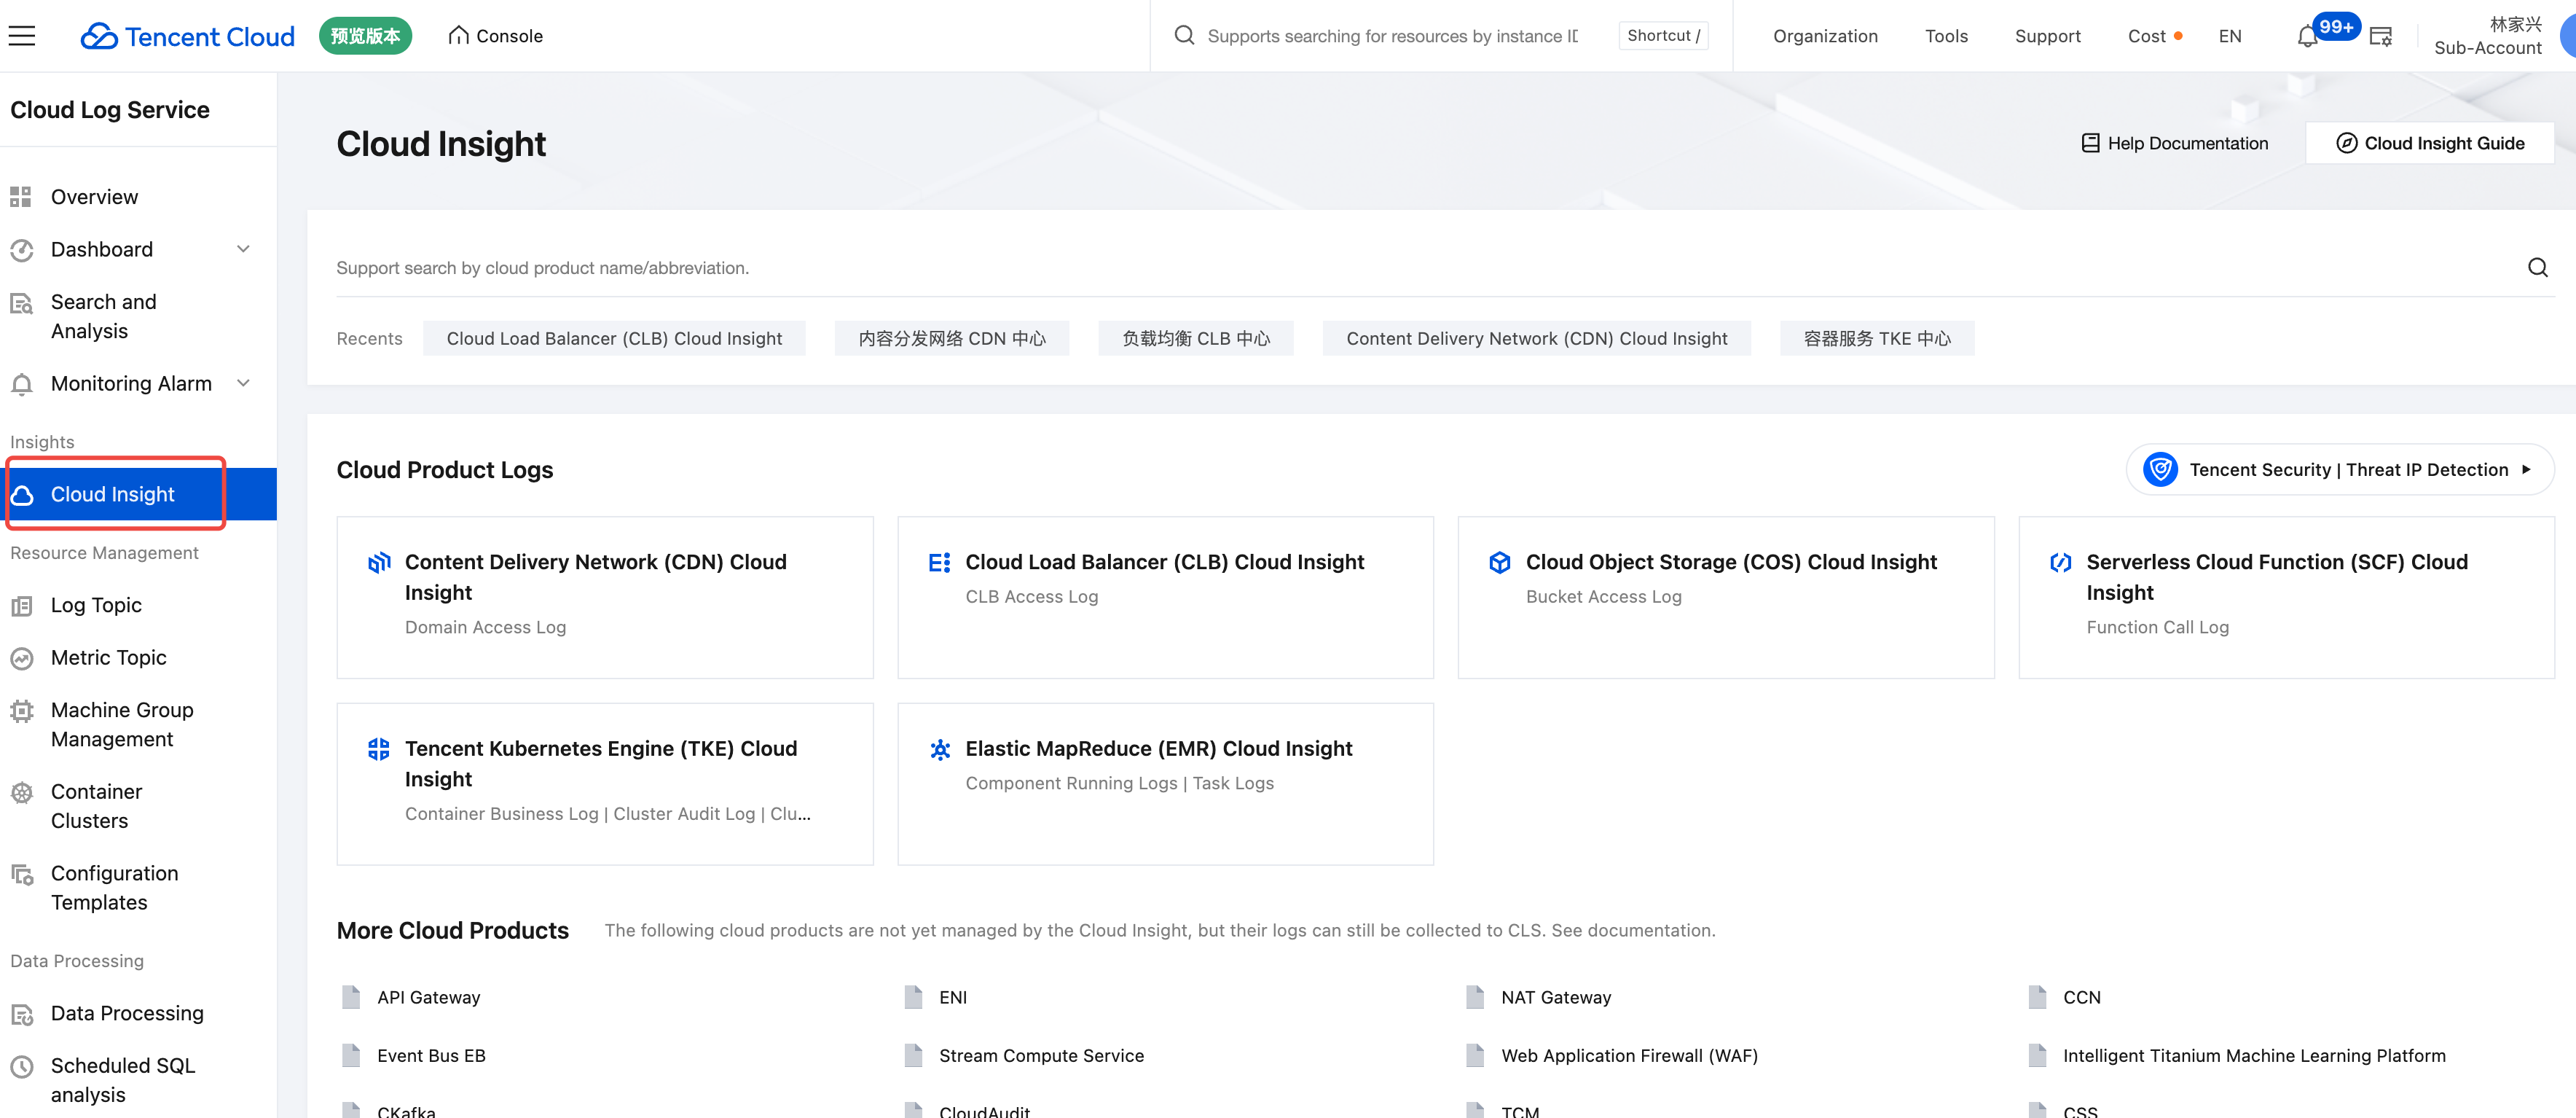
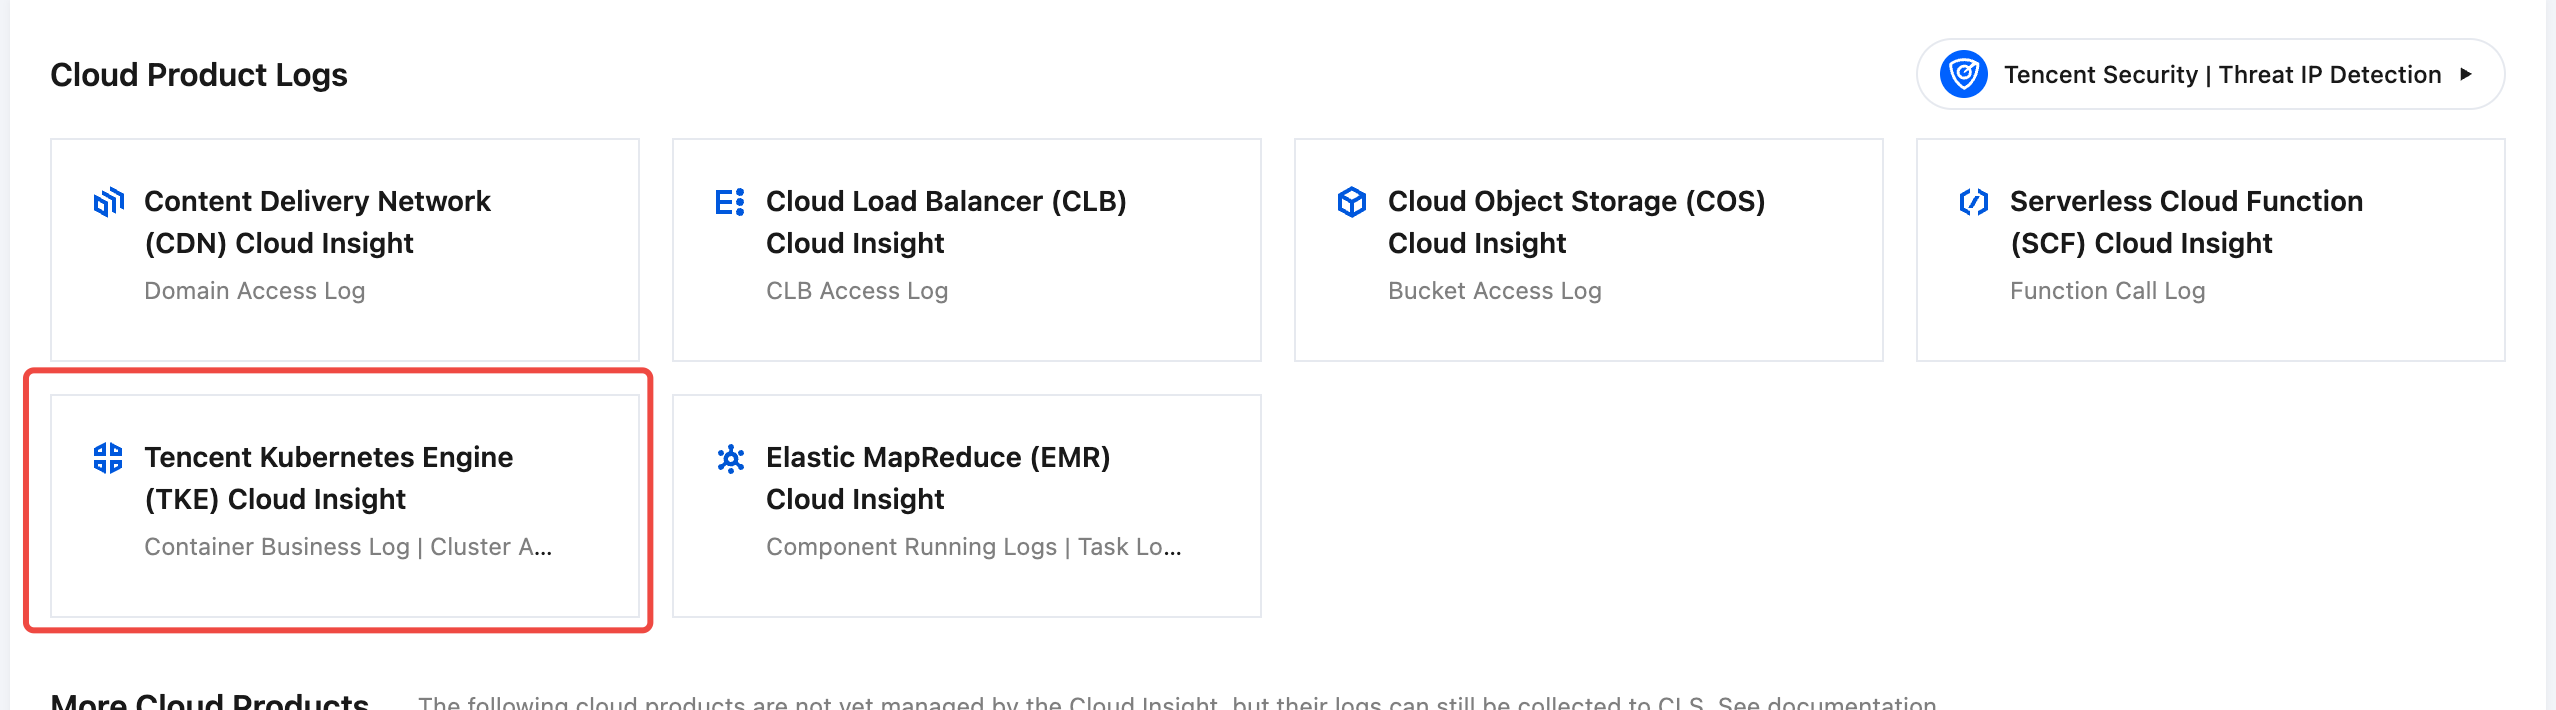
3. In Cloud Insight, select and click Tencent Kubernetes Engine (TKE) Cloud Insight.
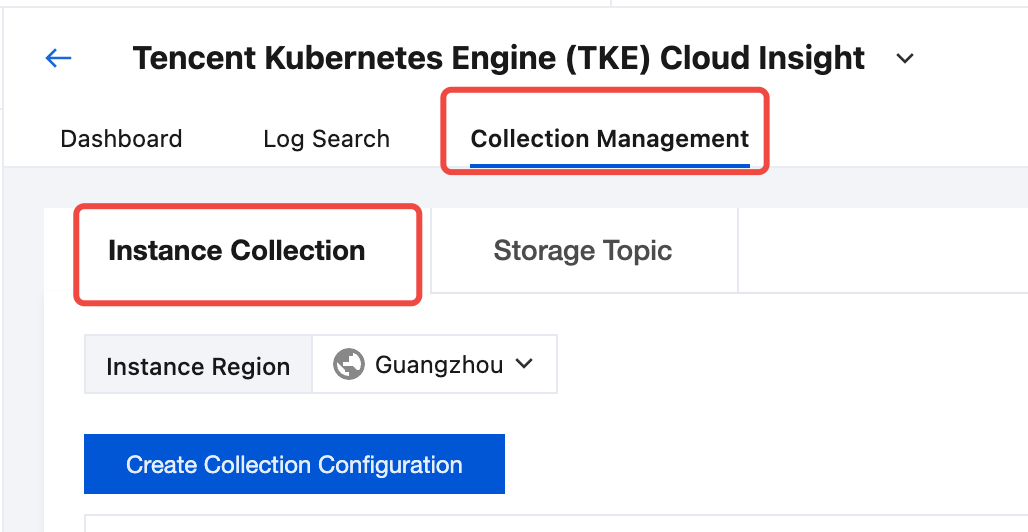
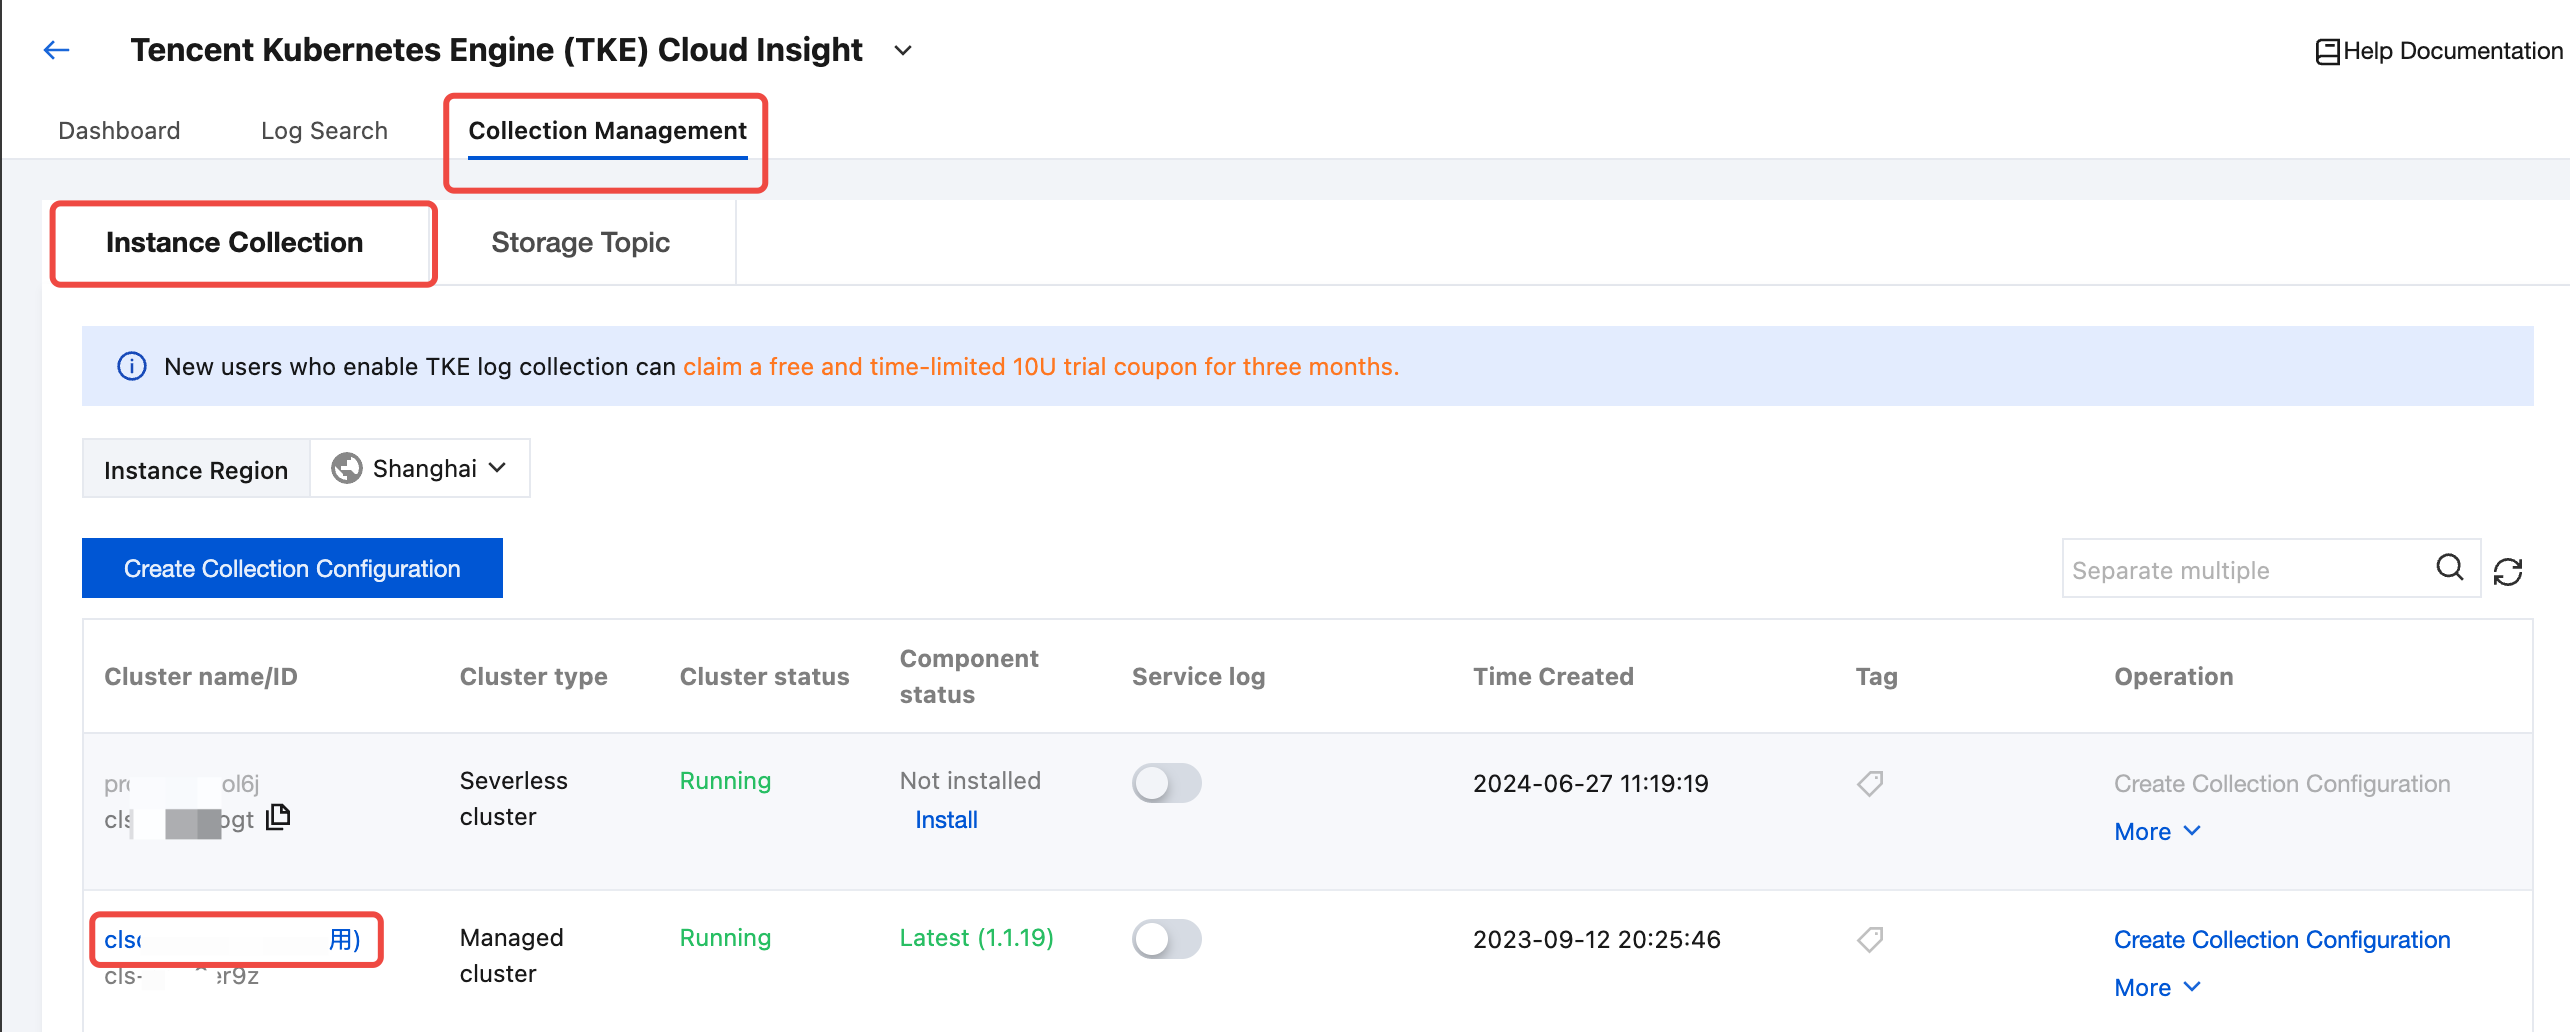
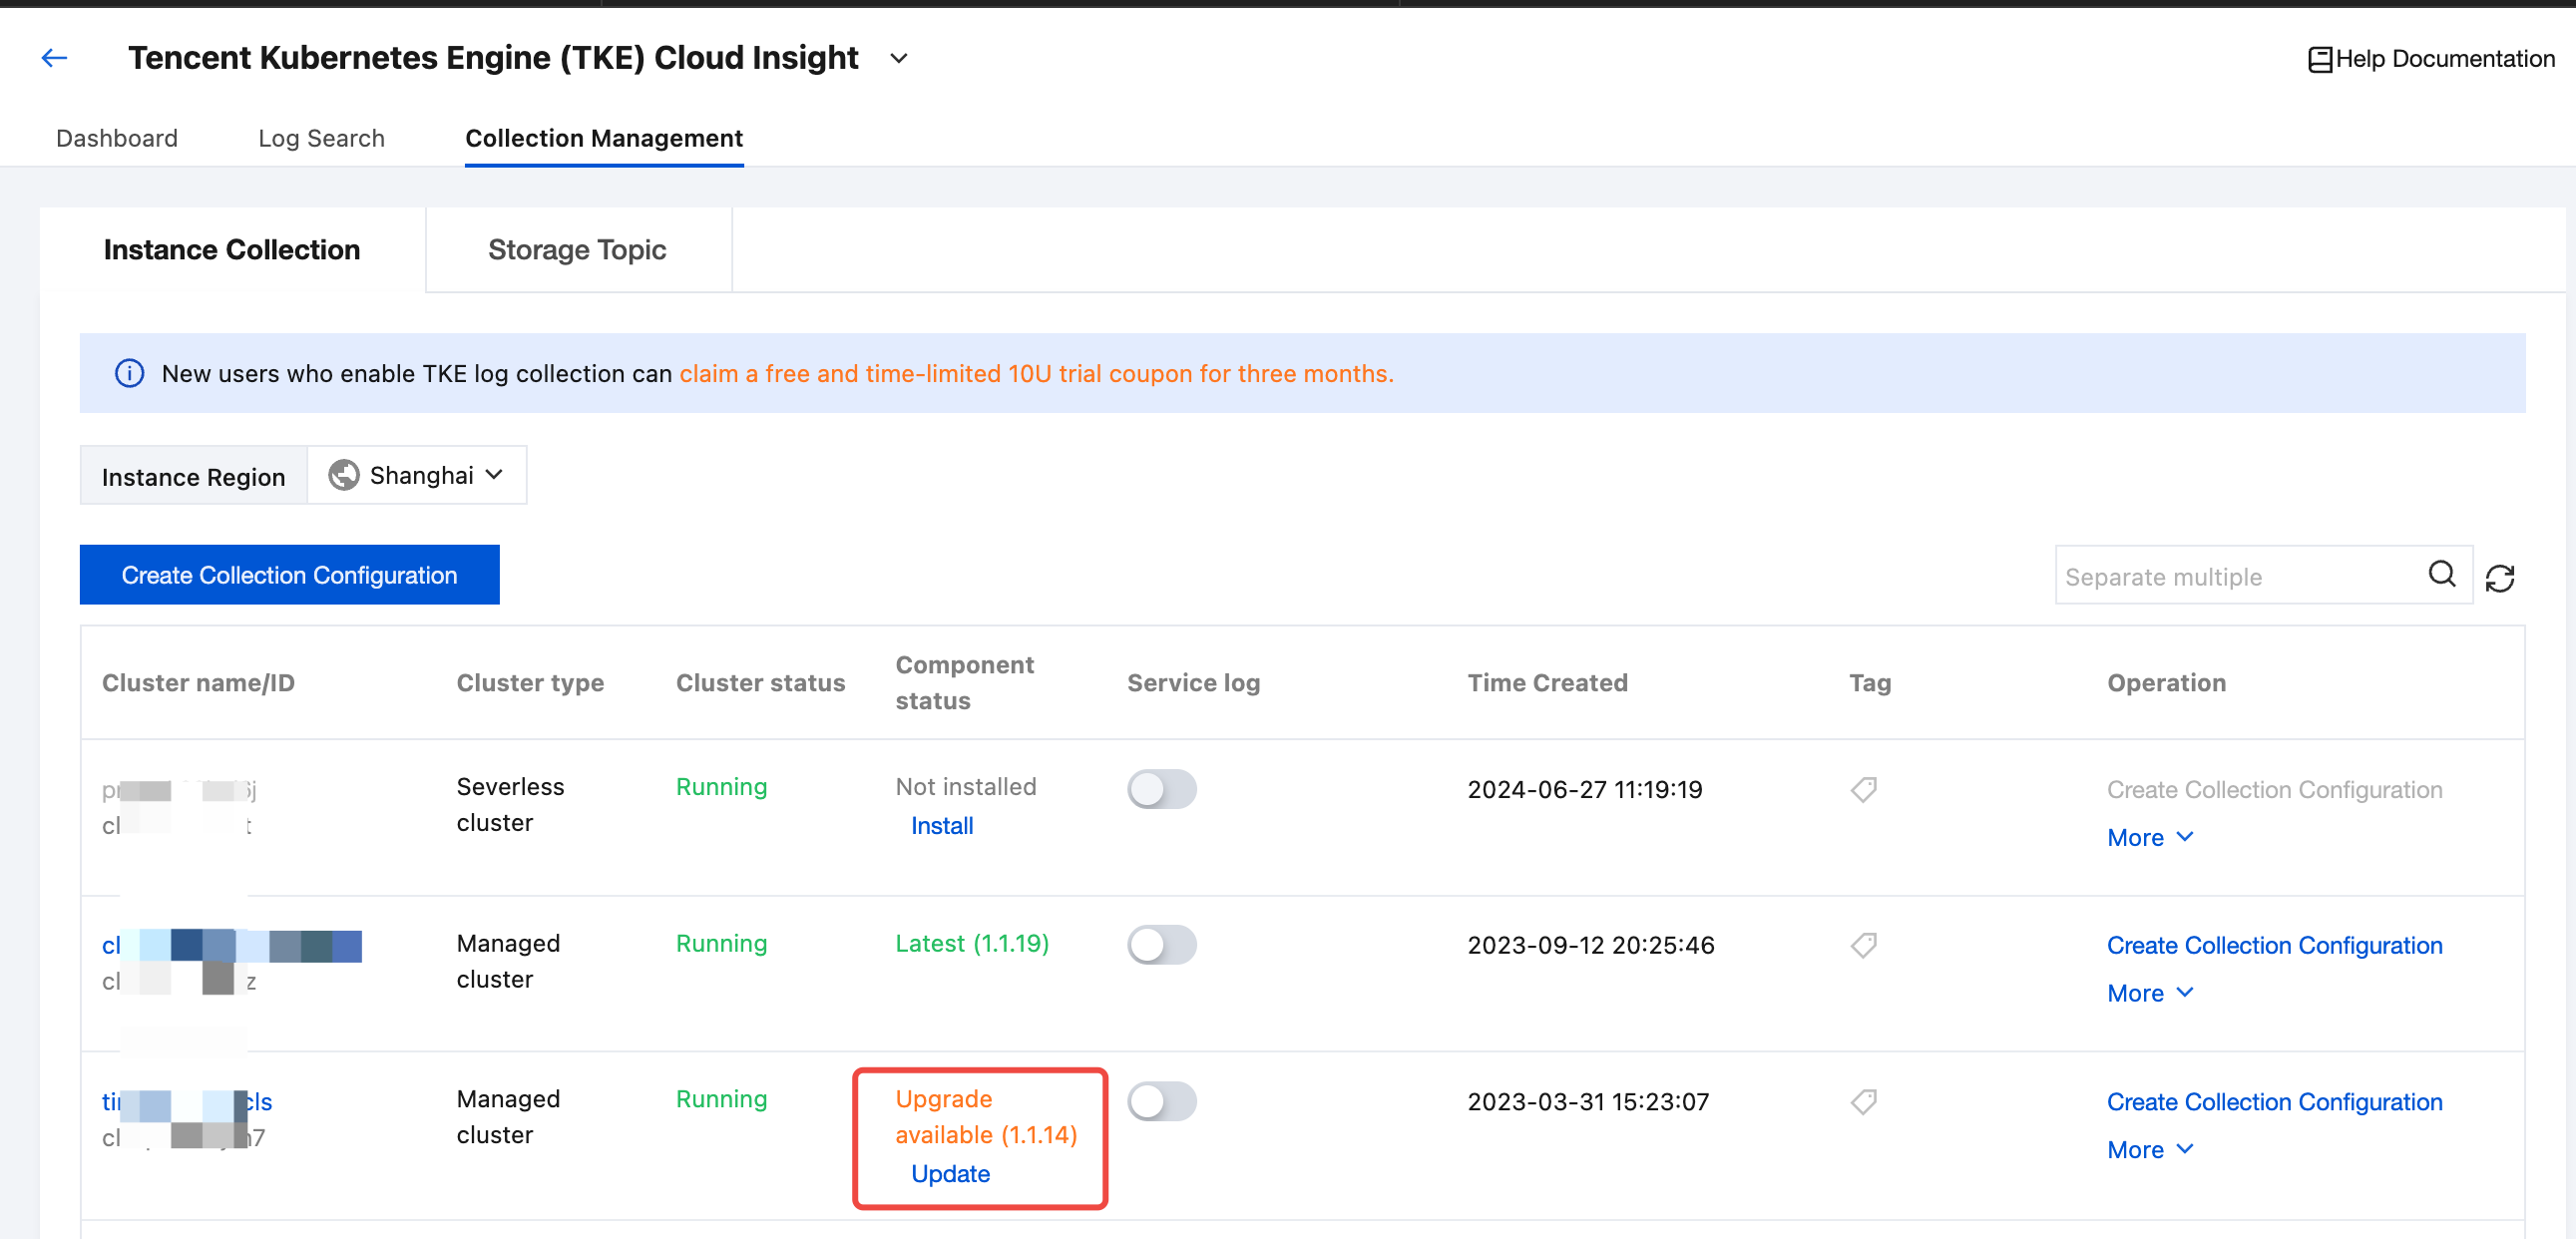
4. In Tencent Kubernetes Engine (TKE) Cloud Insight, choose Collection Management > Instance Collection.
5. Select the region where the TKE cluster is located, and find the target collection cluster in the cluster list.
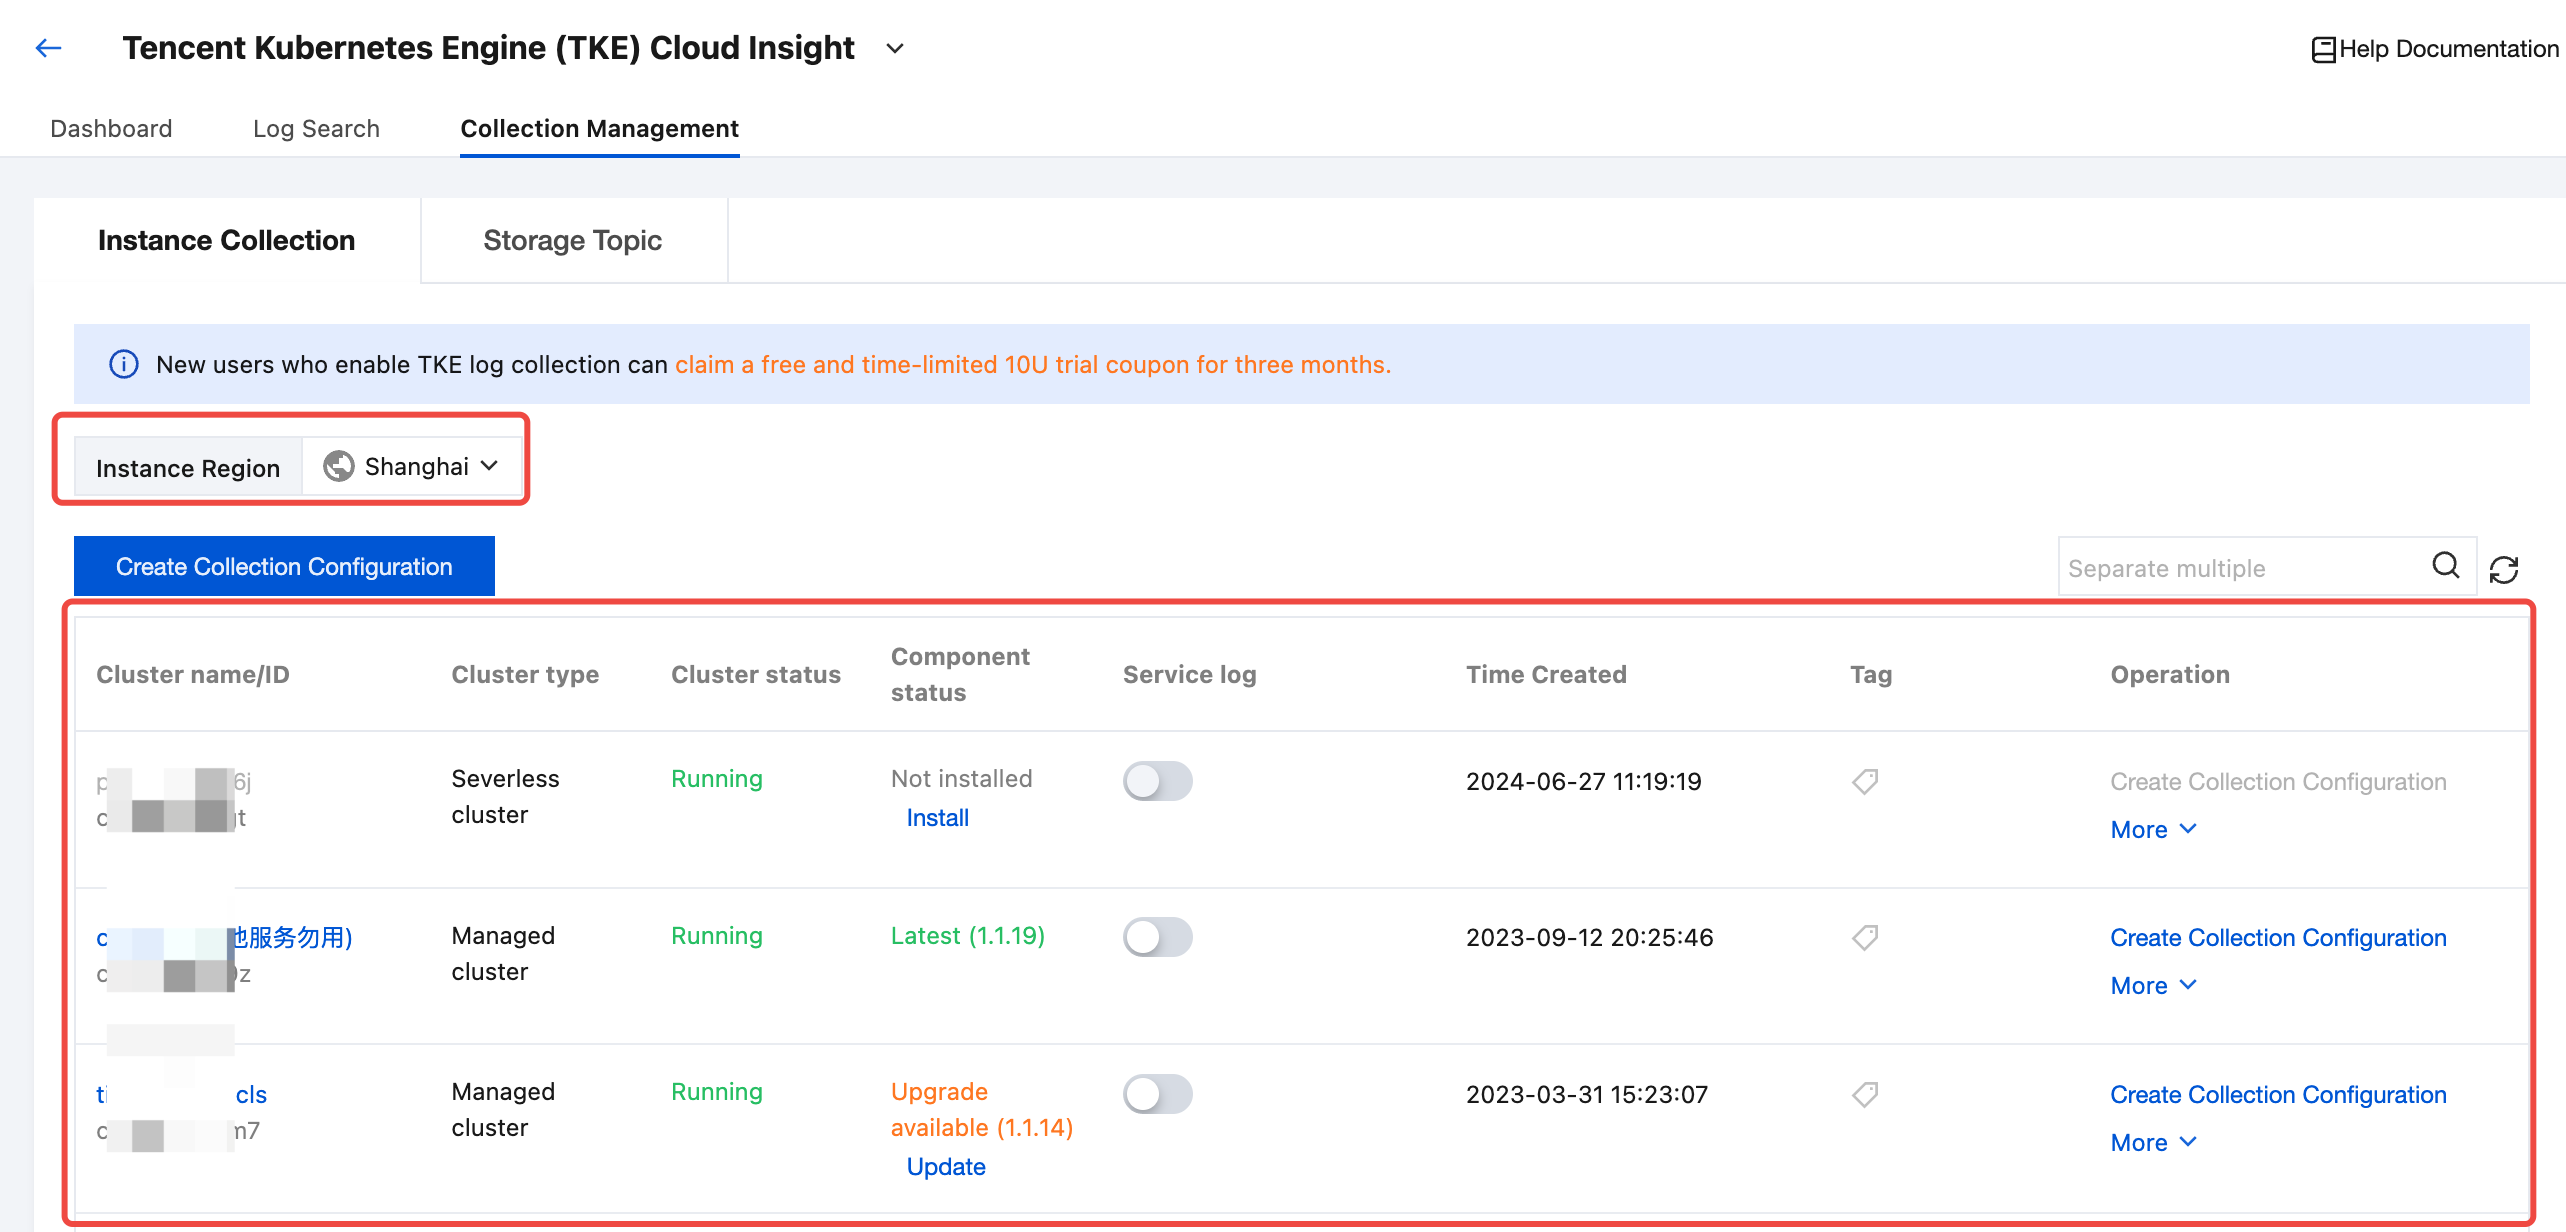
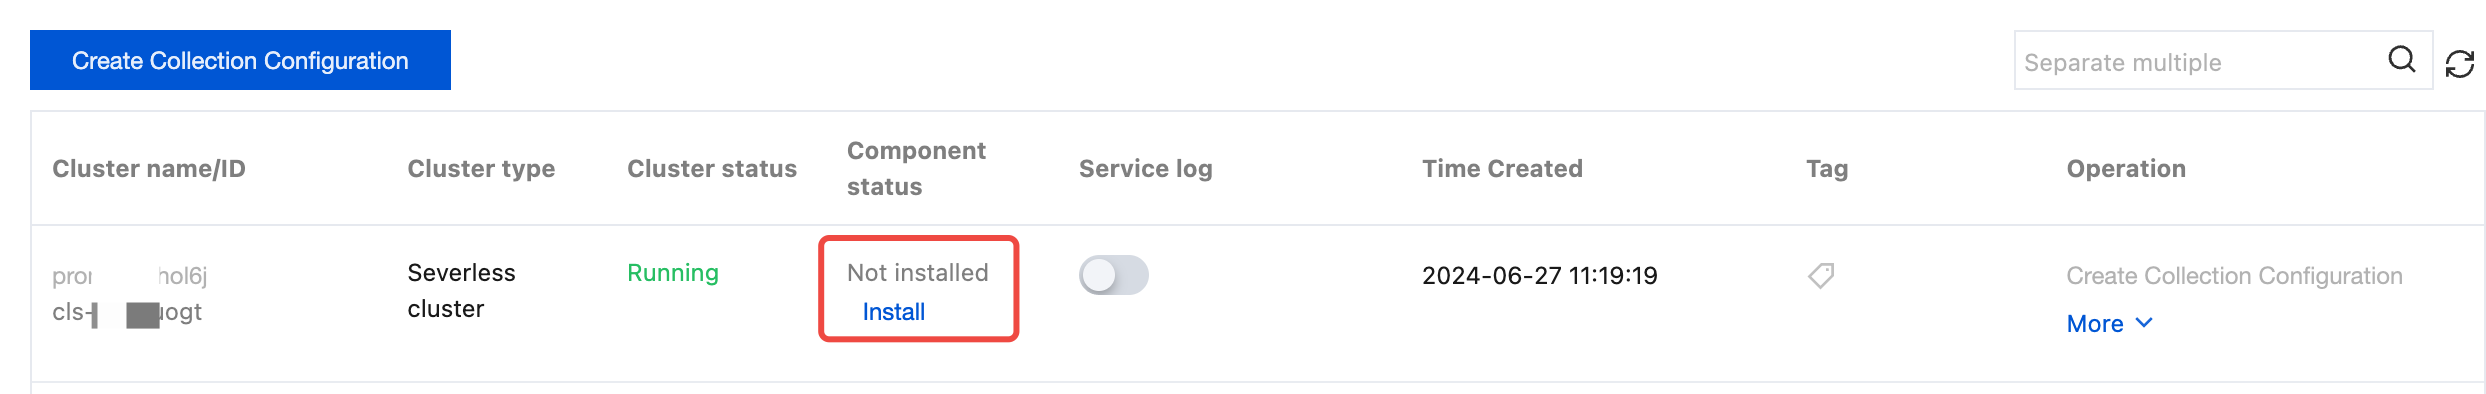
If the status of a collection component is Not installed, click Install to install the log collection component.

Note:
If a log collection component is installed in a cluster, a pod named tke-log-agent pod and a pod named cls-provisioner will be deployed by using DaemonSet in the kube-system namespace of the cluster. Reserve at least 0.1 cores and 16 MiB of available resources for each node.
To install a log collection component on a TKE cluster, you need the BRAC permissions to access the cluster. If not, contact the cluster administrator to add them.
6. If the status of a collection component is Latest, click Create Collection Configuration on the right to enter the cluster log collection configuration process.

Note:
To configure log collection for a TKE cluster, you need BRAC permissions to access the cluster. If not, contact the cluster administrator to add them.
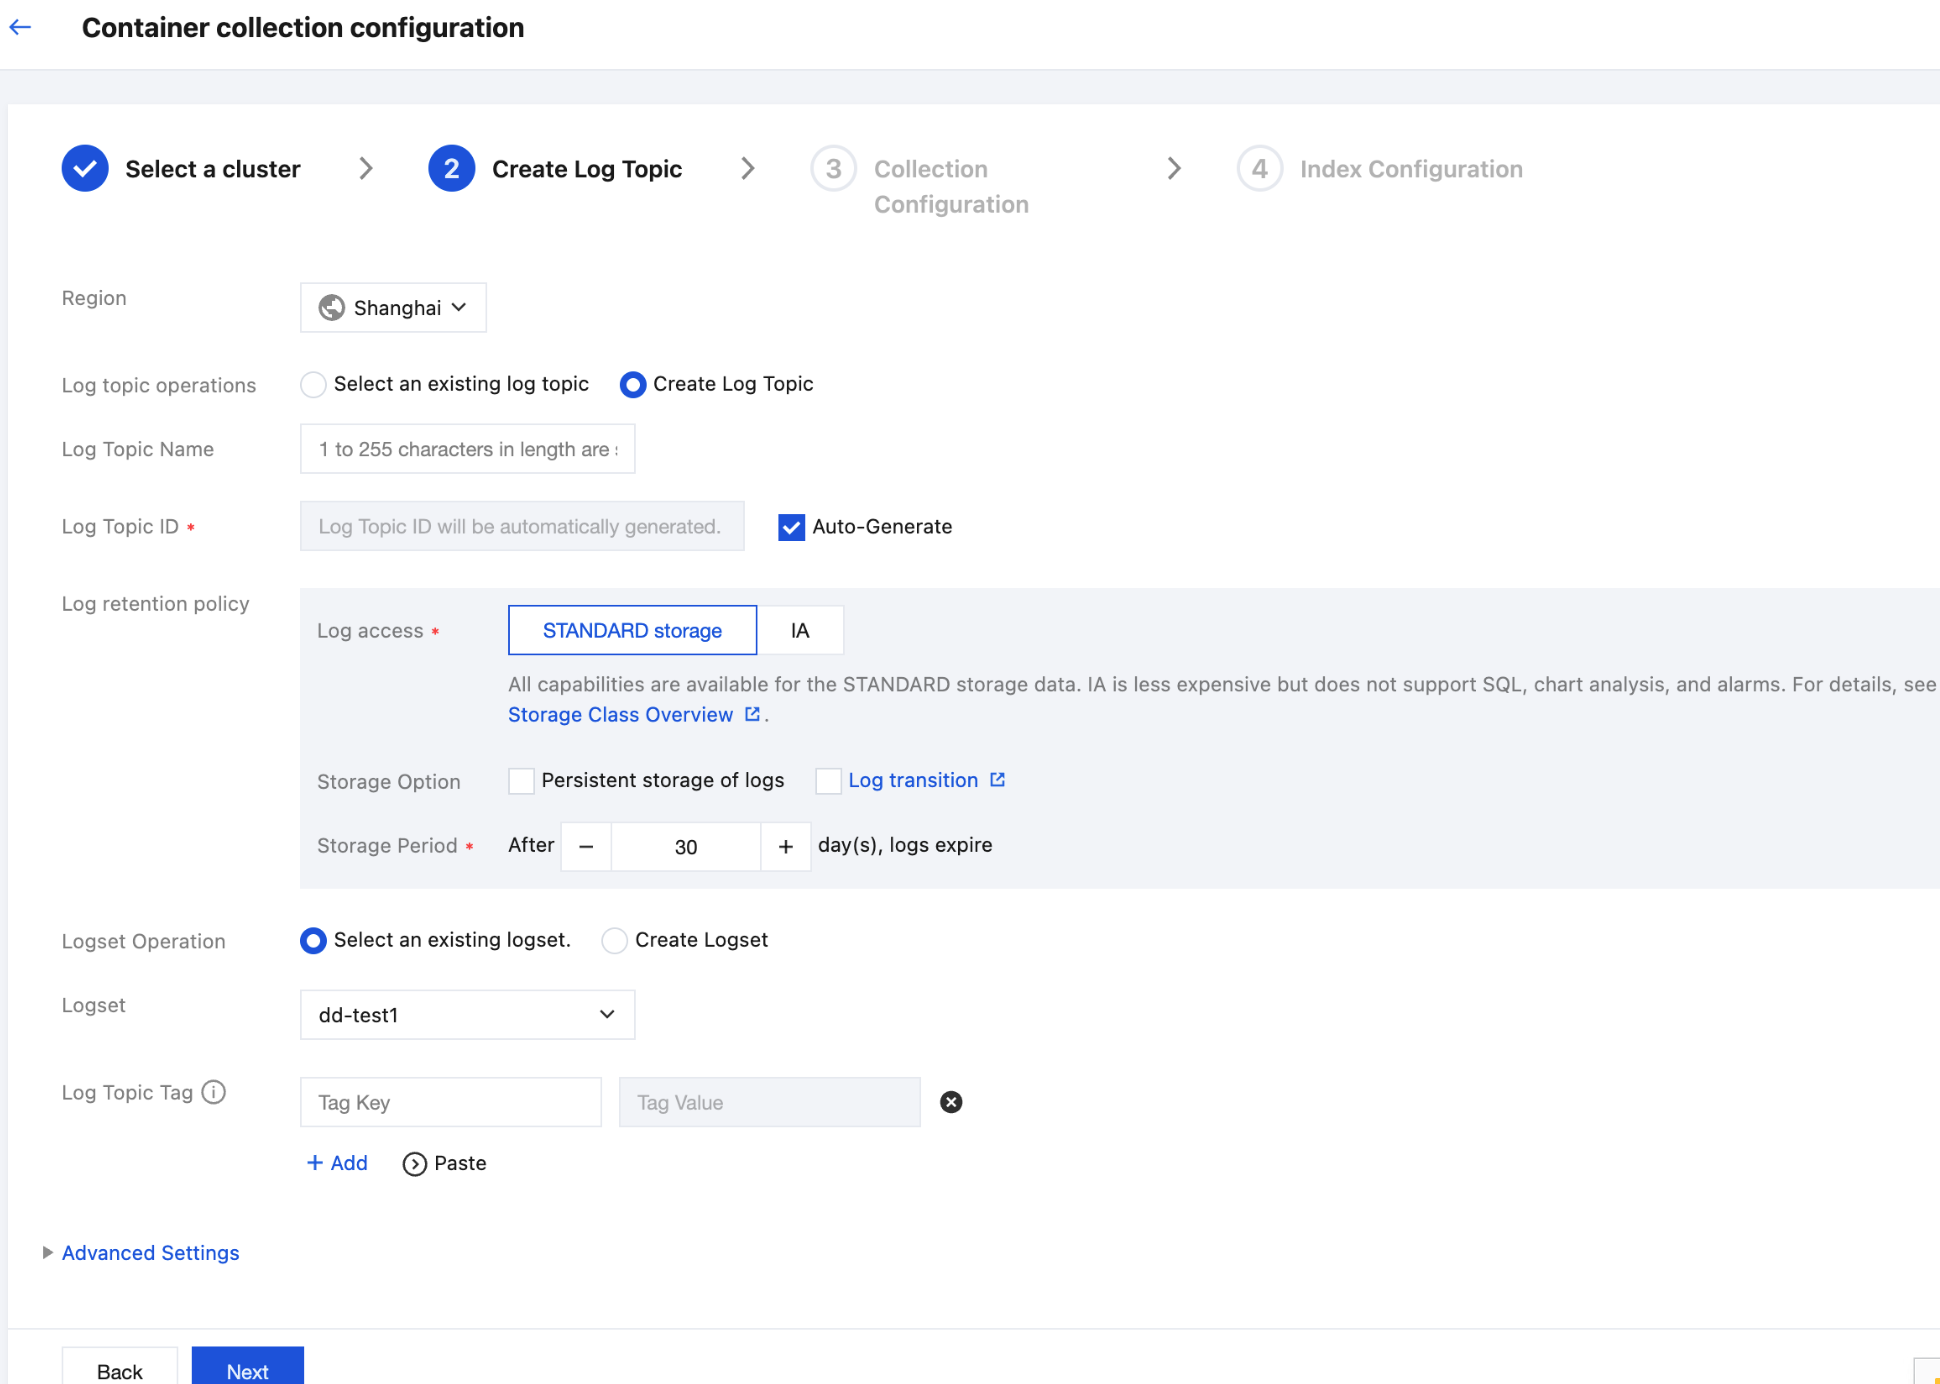
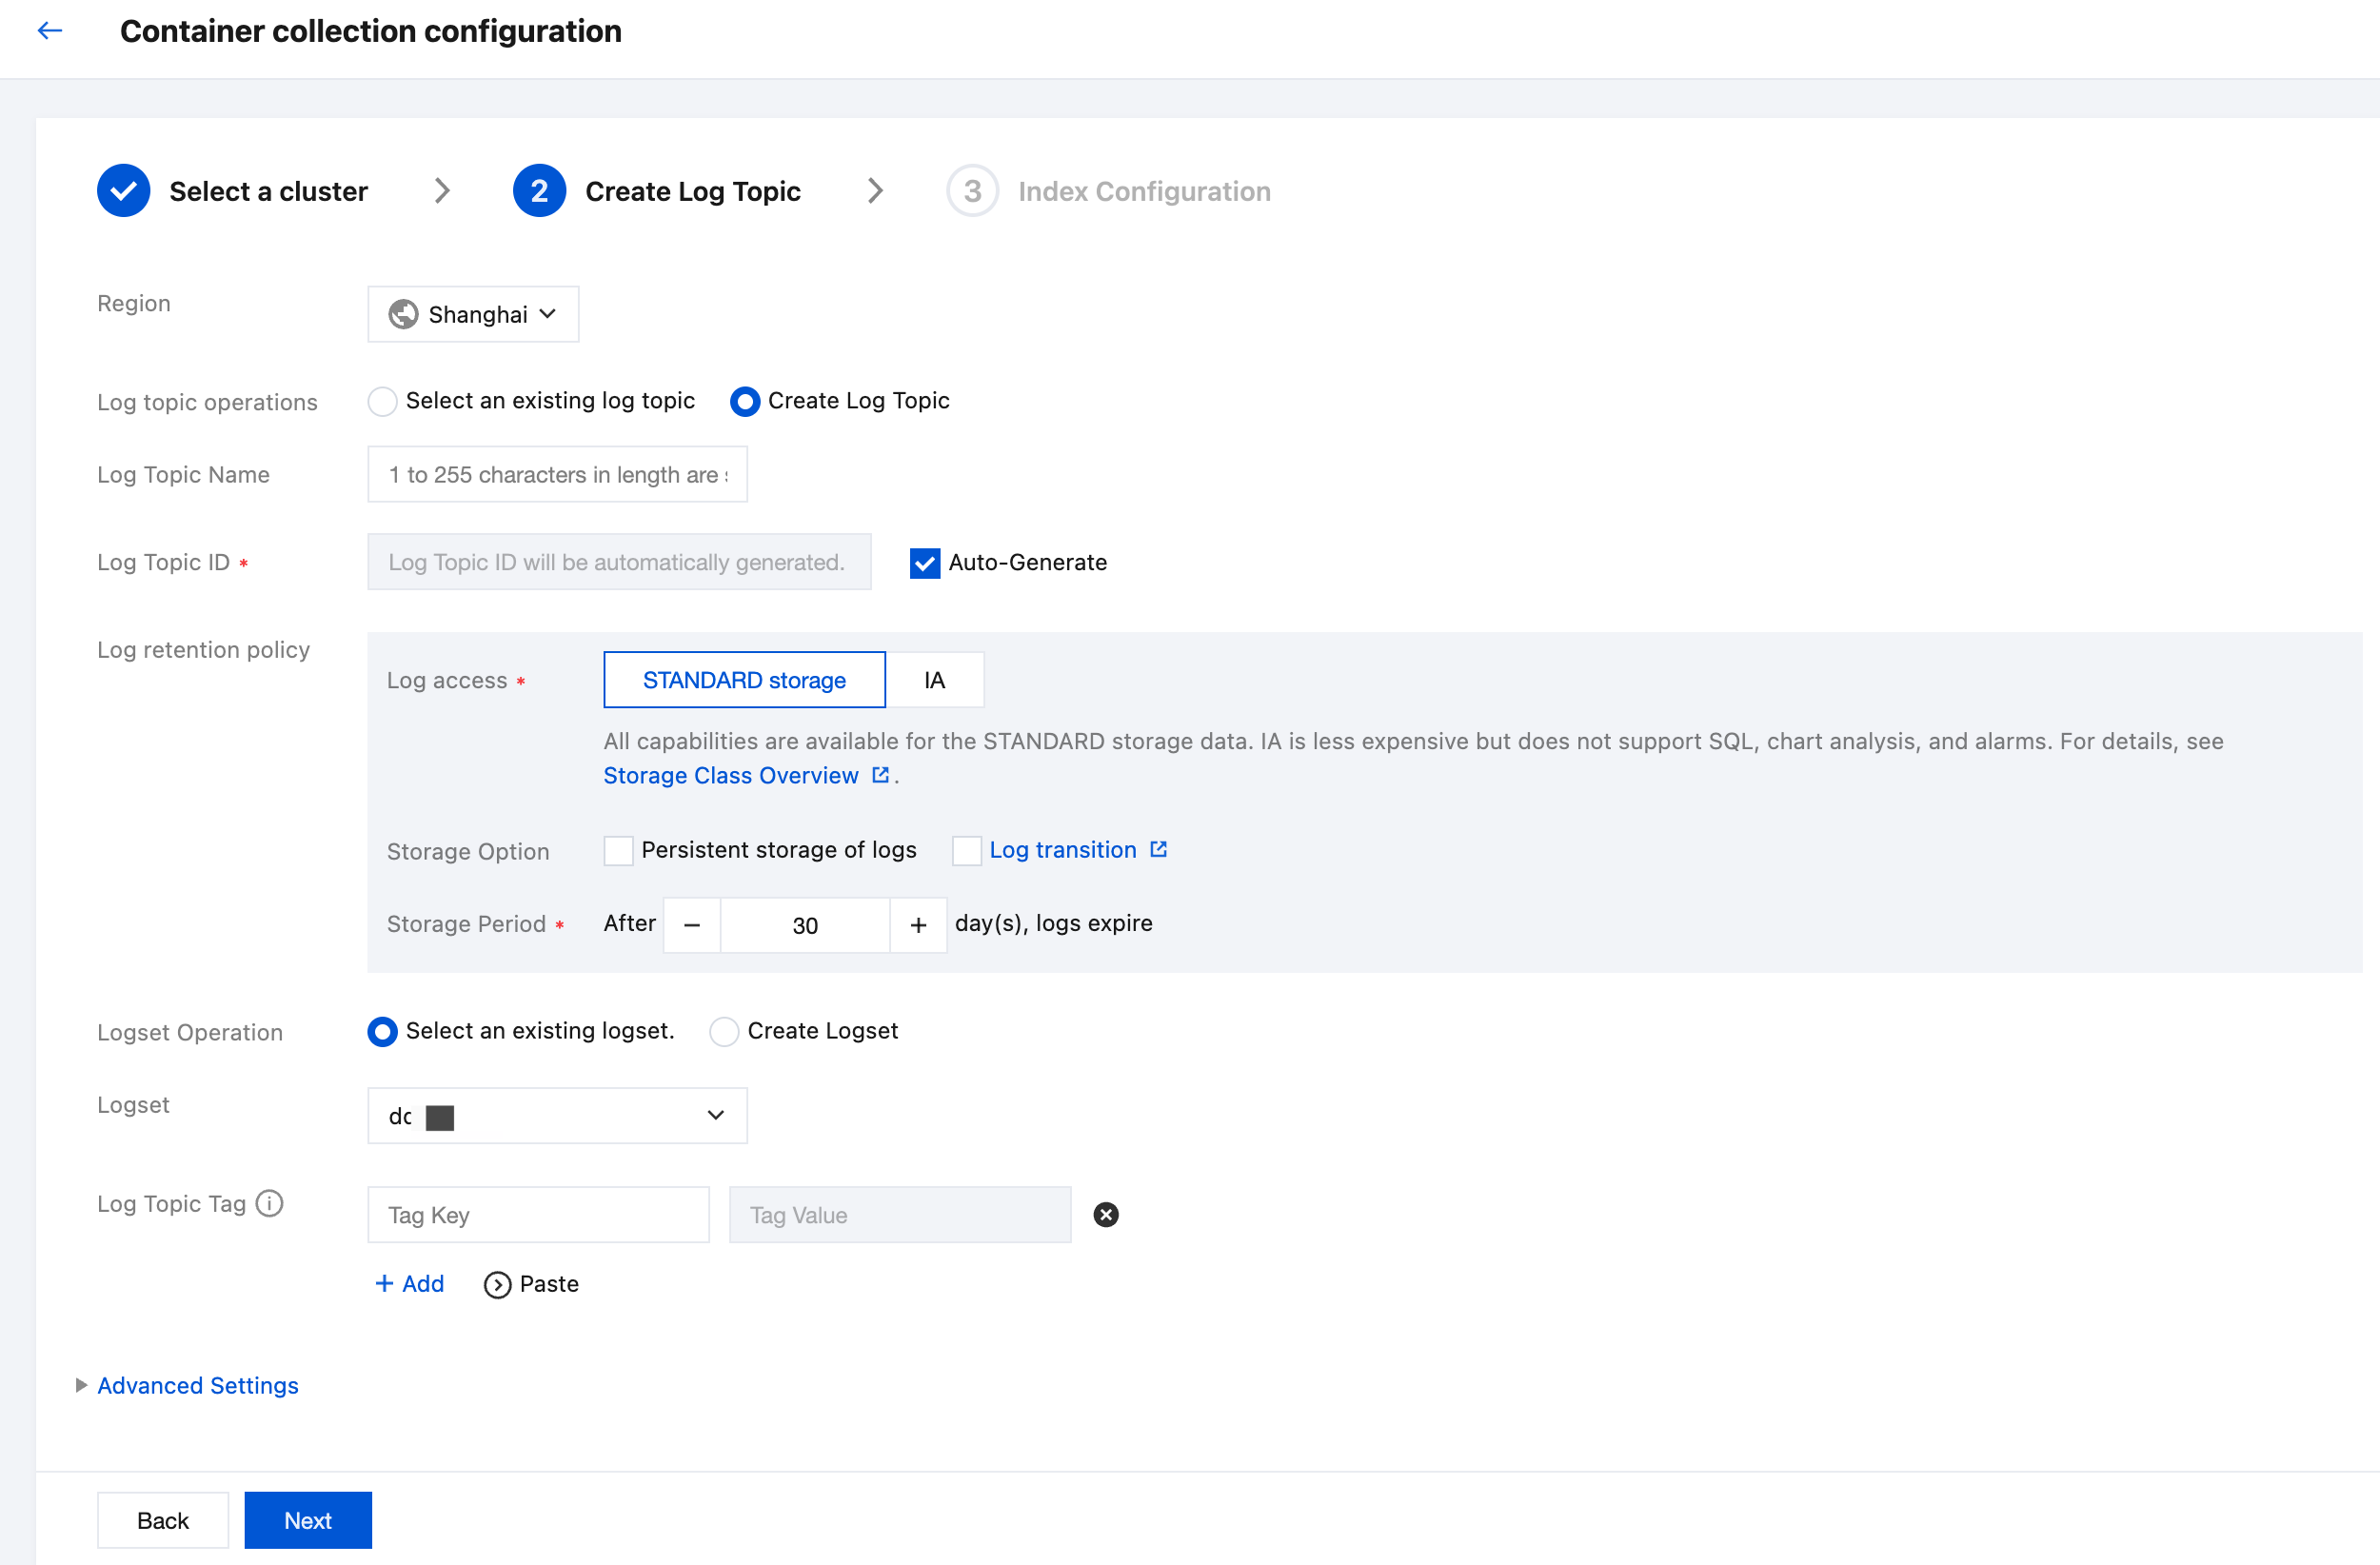
Step 2: Configuring a Log Topic
Enter the cluster log collection configuration process. In the Create Log Topic step, you can select an existing log topic or create a log topic for storing logs. For more information about log topics, see Log Topic.
Step 3: Configuring Collection Rules
After selecting a log topic, click Next to enter Collection Configuration to configure collection rules. The configuration information is as follows:
Log Source Configuration:
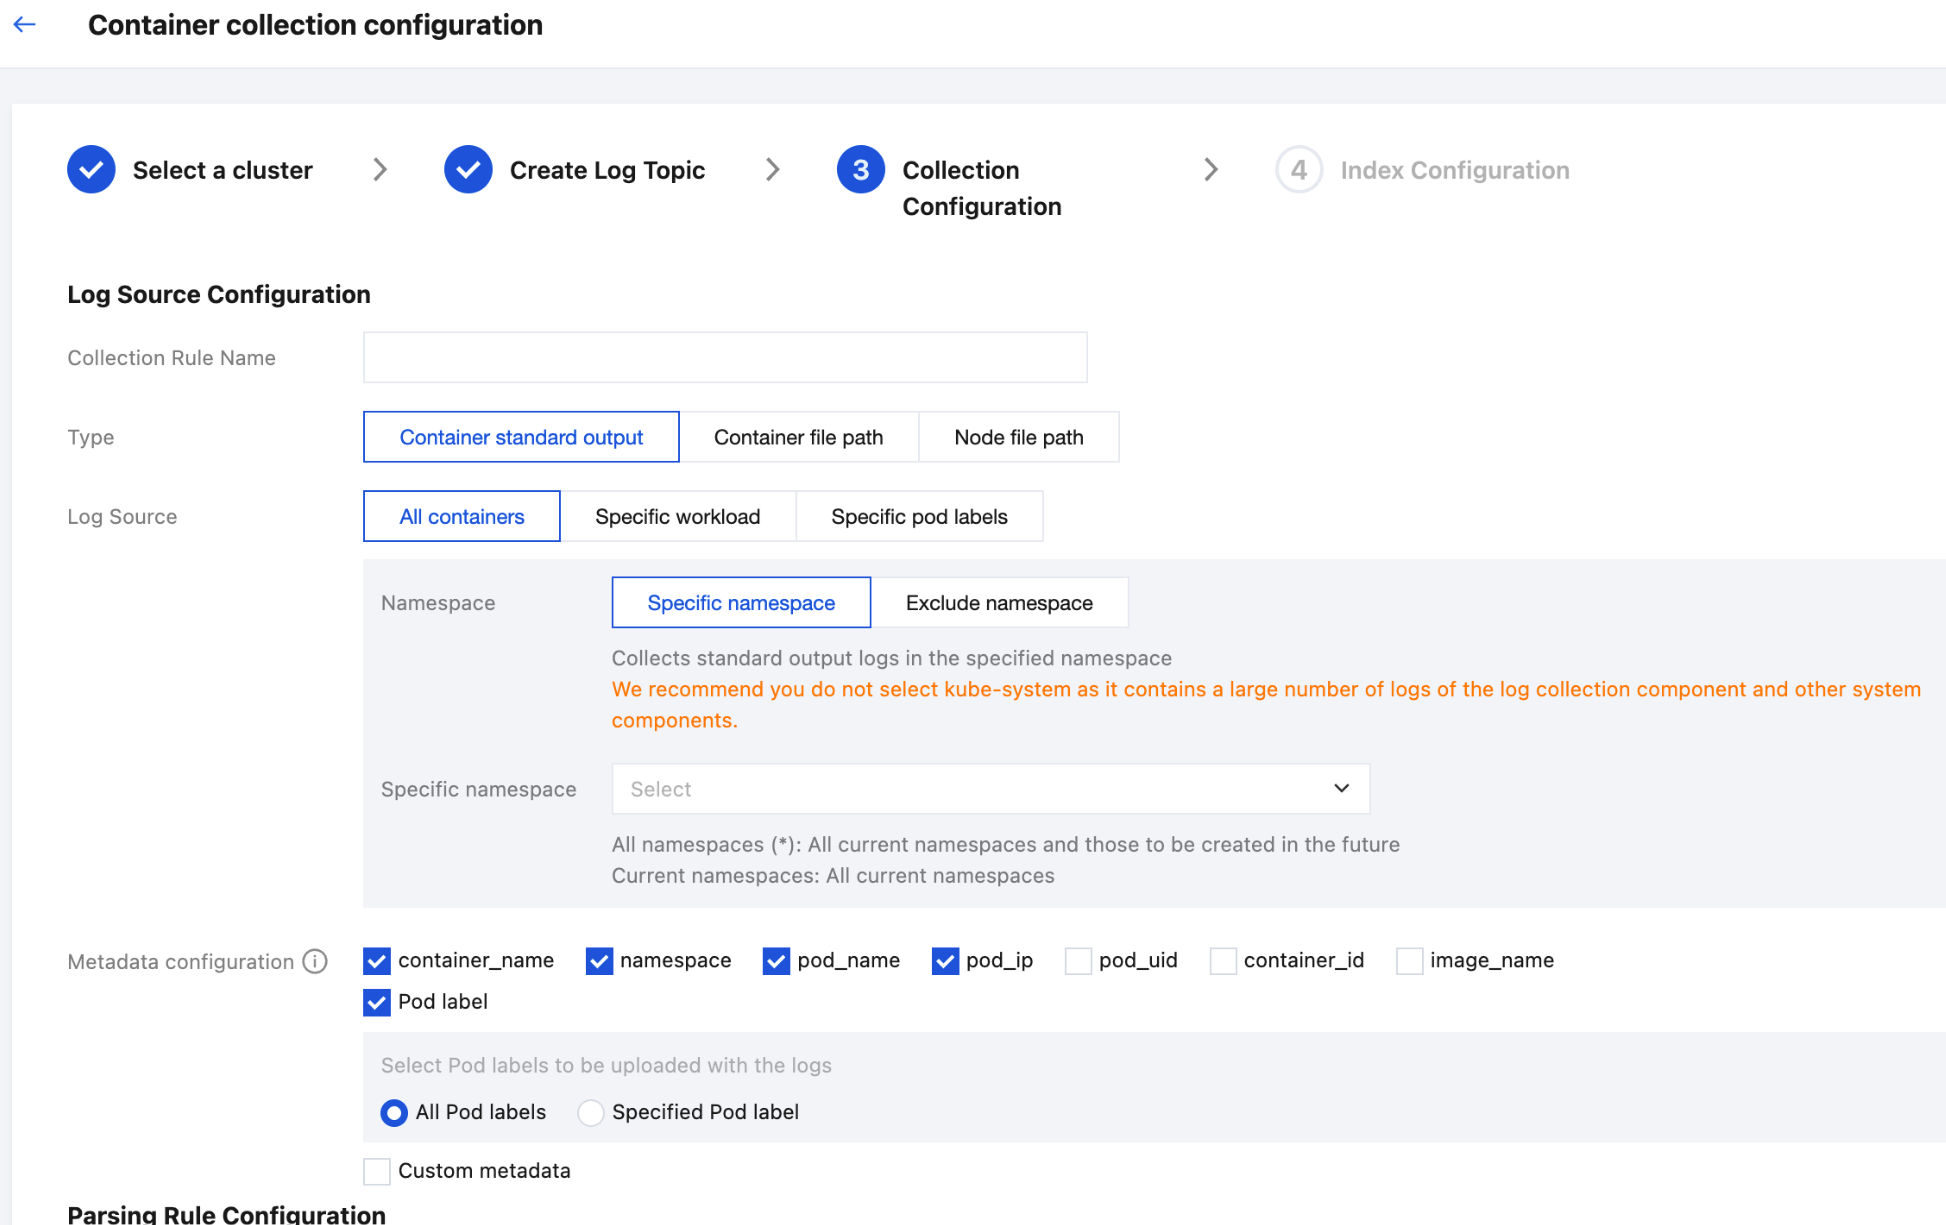
Collection Rule Name: You can customize the log collection rule name.
Collection Type: Currently, the collection types support container STANDARD output, container file path, and node file path.
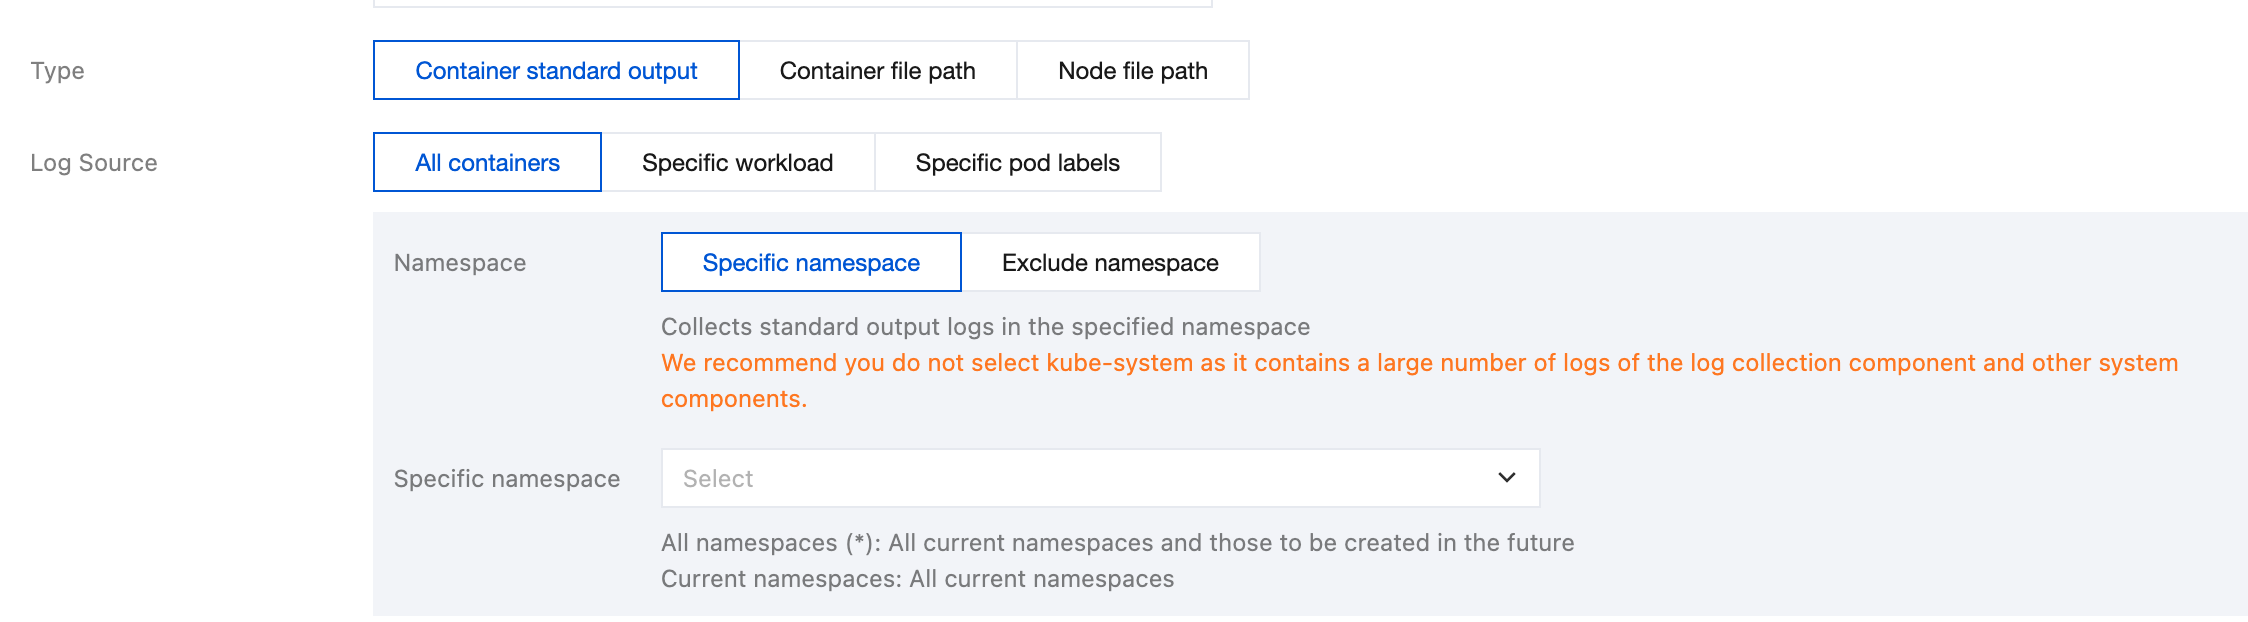
Select one of the following 3 methods to specify the collection log source of container STANDARD output: All containers, Specific workload, and Specific pod labels.
All containers: Represents collecting STANDARD output logs from all containers in the specified namespace, as shown below:
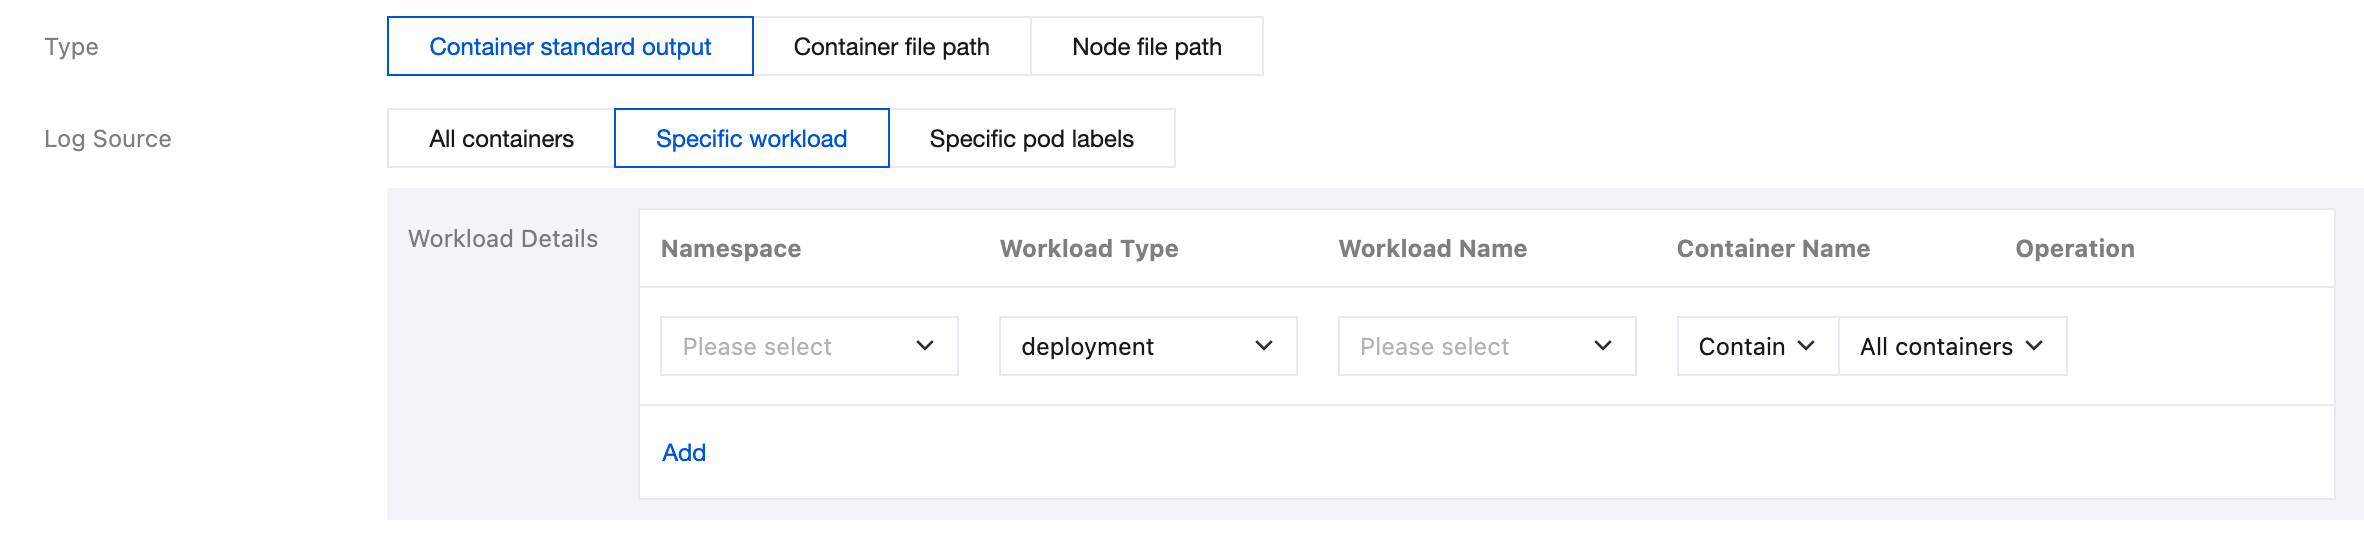
Specific workload: Represents collecting STANDARD output logs from the specified container in the specified workload under the specified namespace, as shown below:
Specific pod labels: Represents collecting STANDARD output logs from all containers with specified Pod Labels in the specified namespace, as shown below:
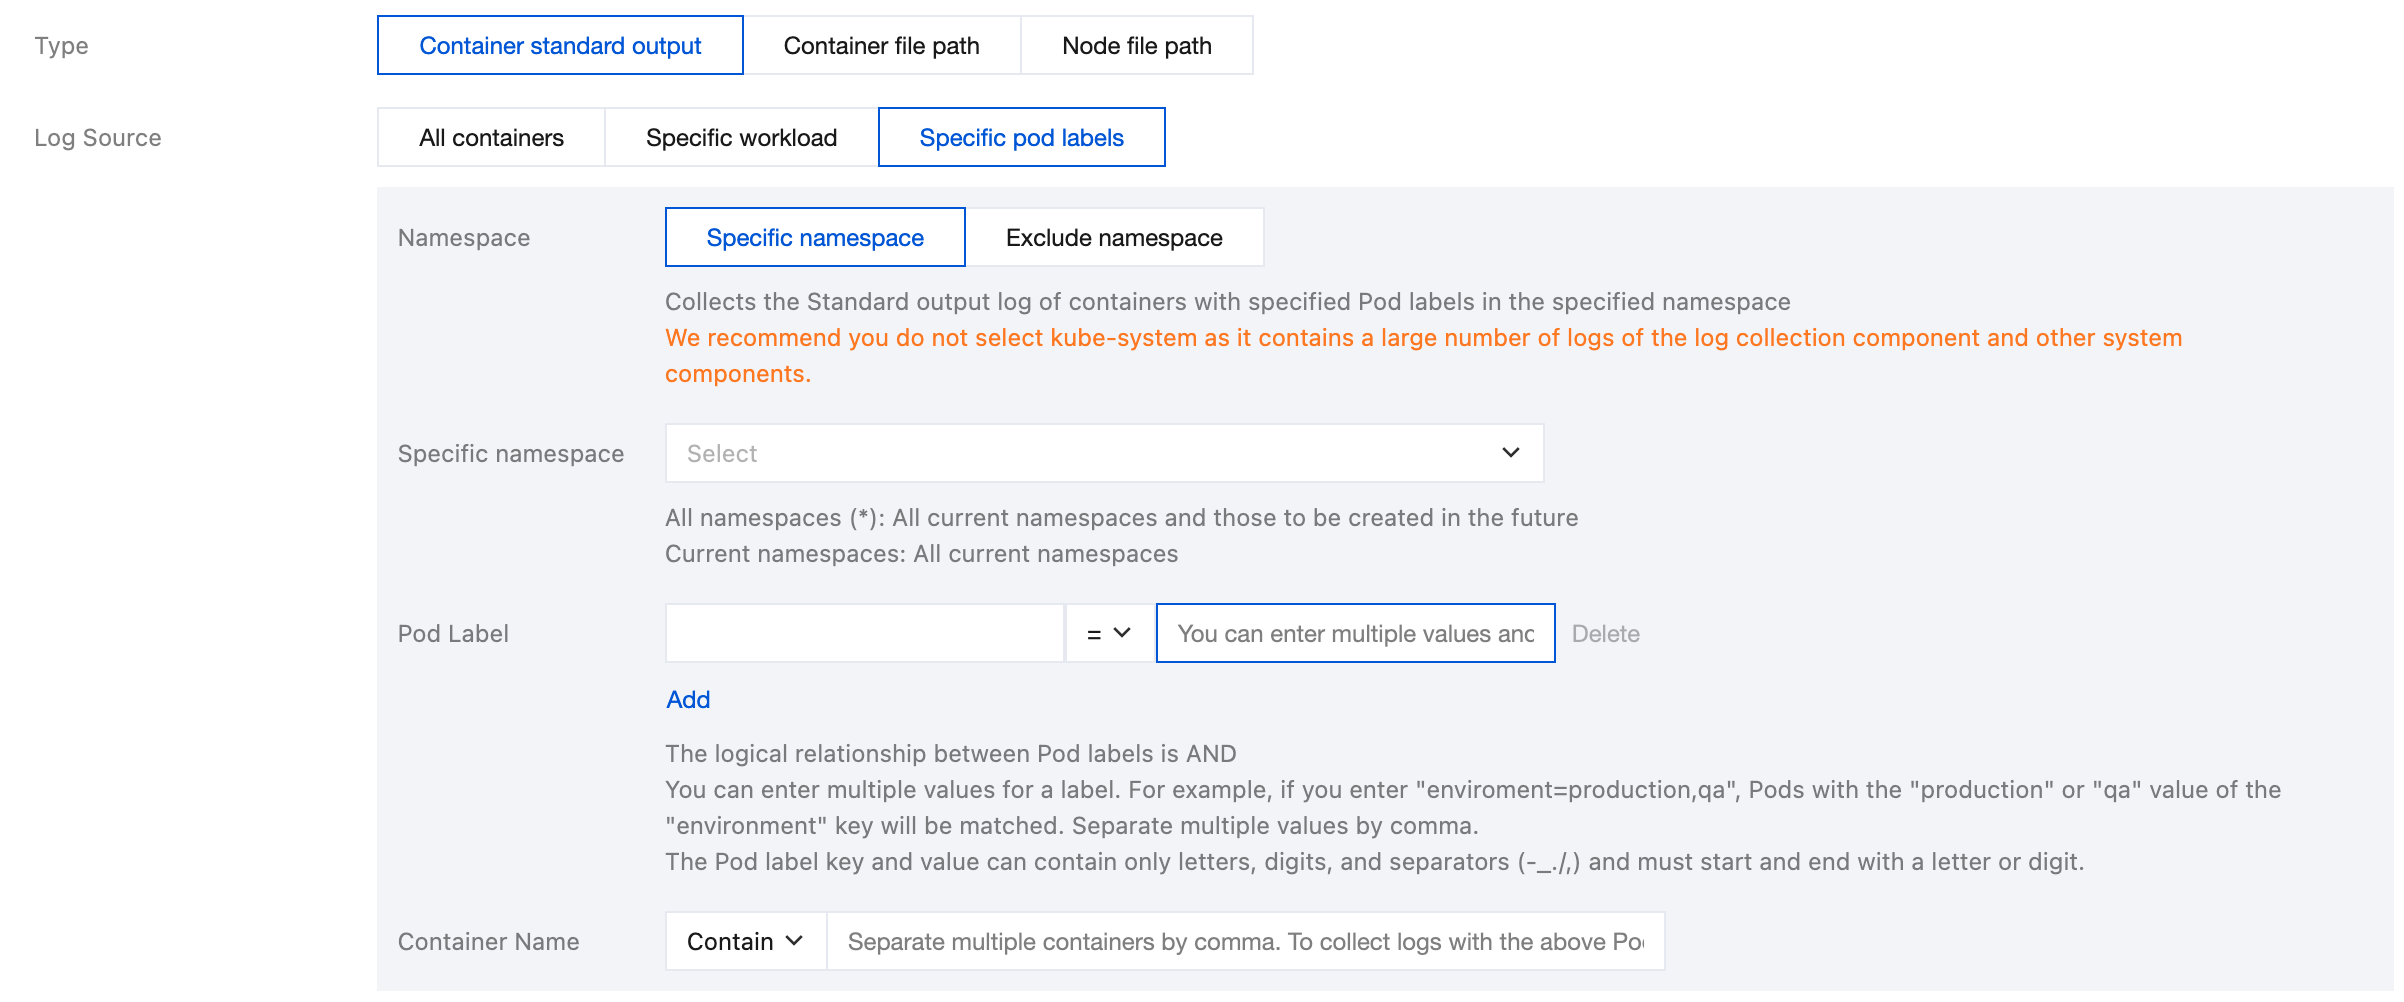
Note:
A container file path cannot be a symbolic link. Otherwise, the actual path of the symbolic link will not exist in the collector's container, resulting in log collection failure.
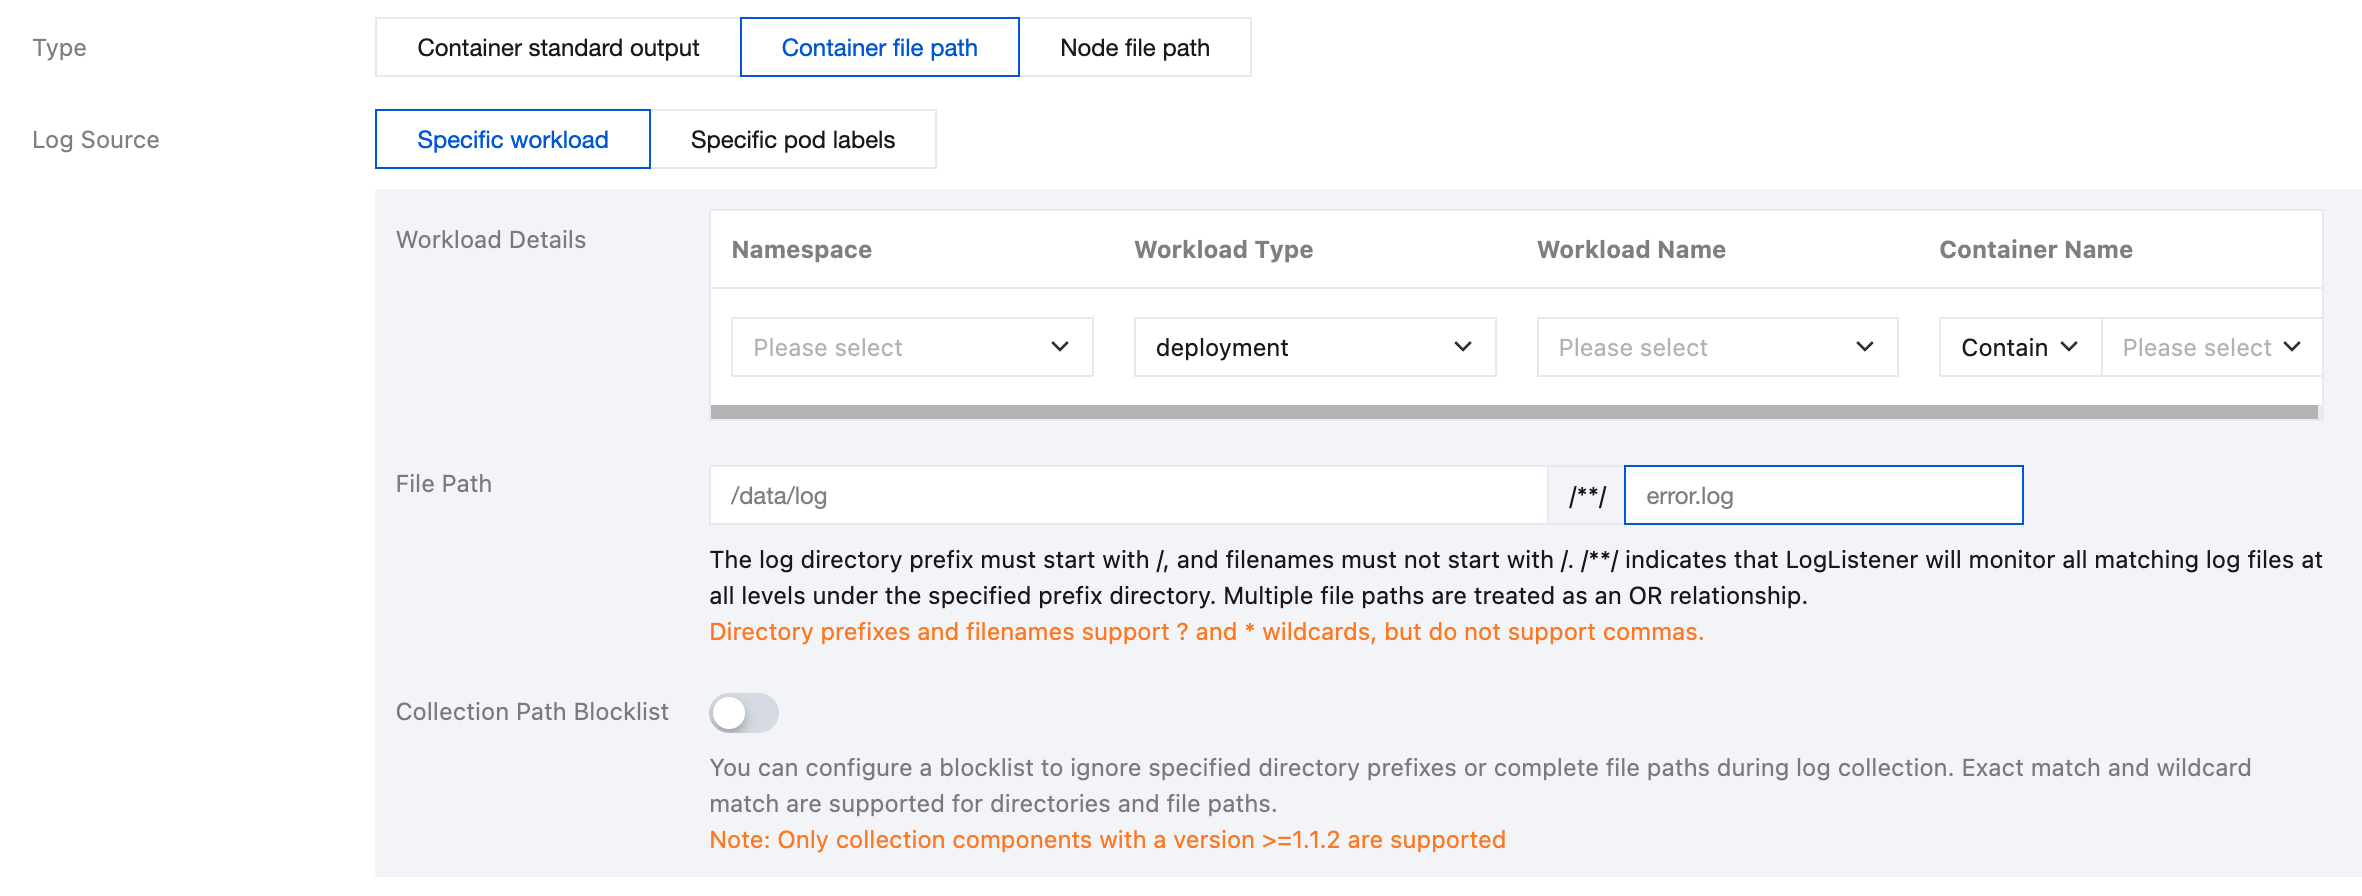
Select one of the following 2 methods to specify the log source for collecting container file paths: Specific workload and Specific pod labels.
Specific workload: Represents collection container file paths in the specified container within the specified workload under the specified namespace, as shown below:
Specific pod labels: Represents collection container file paths in all containers with specified pod labels under the specified namespace, as shown in the figure below:
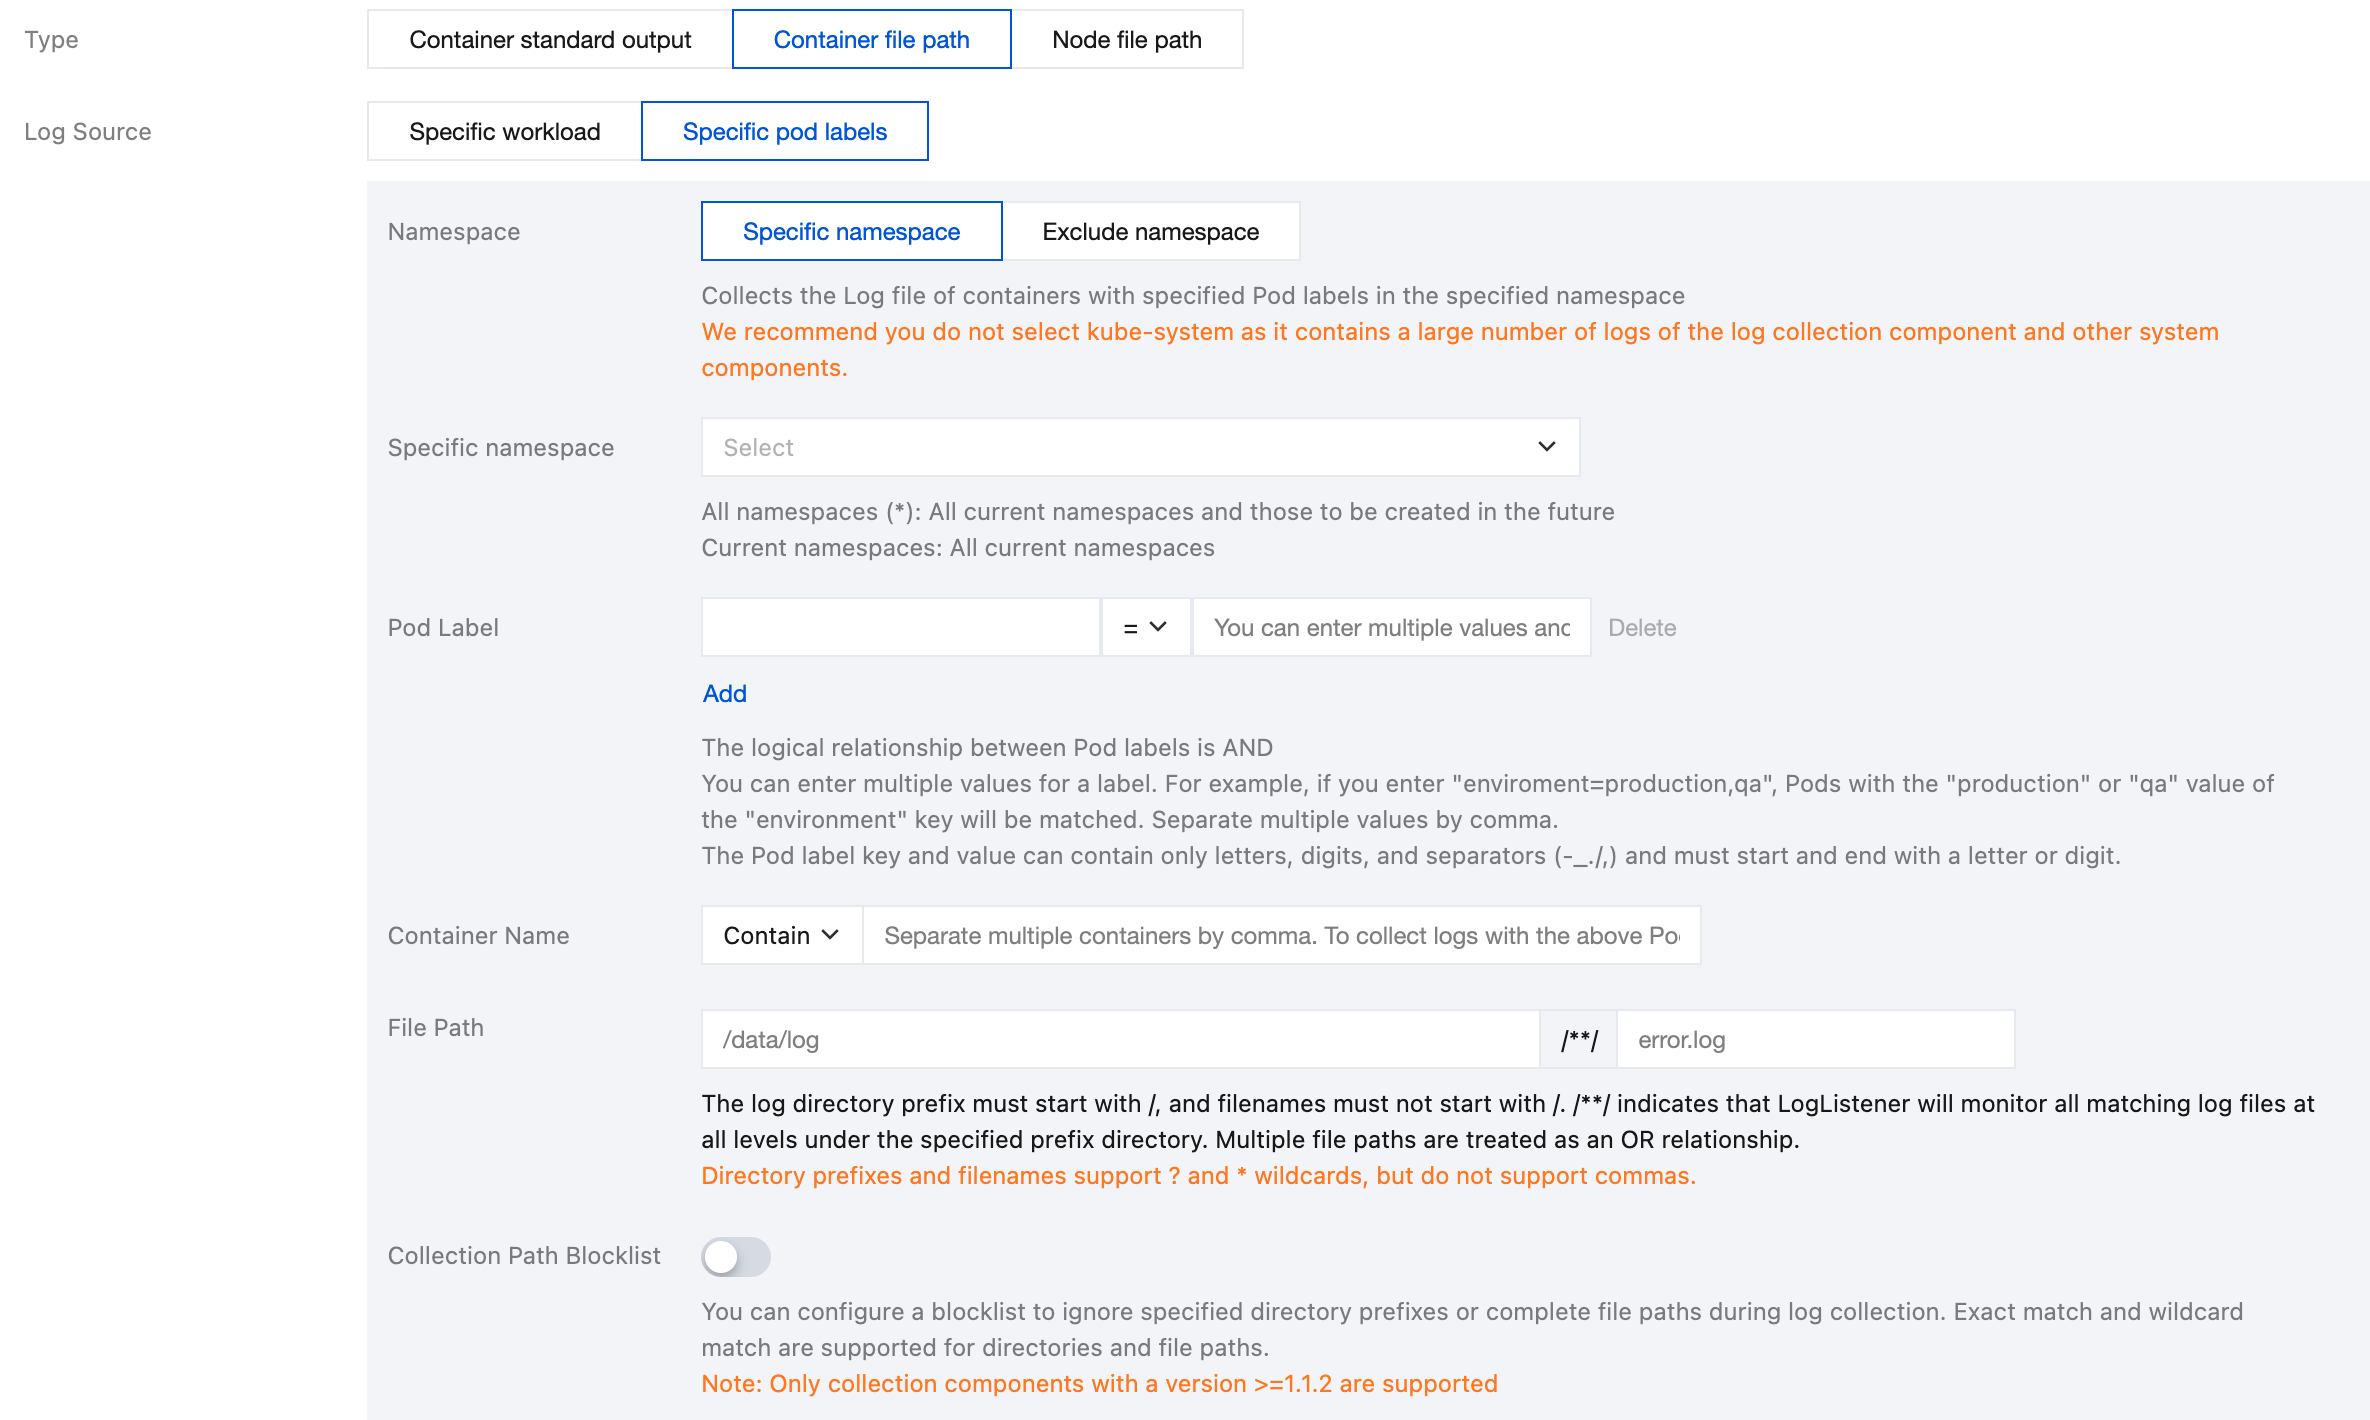
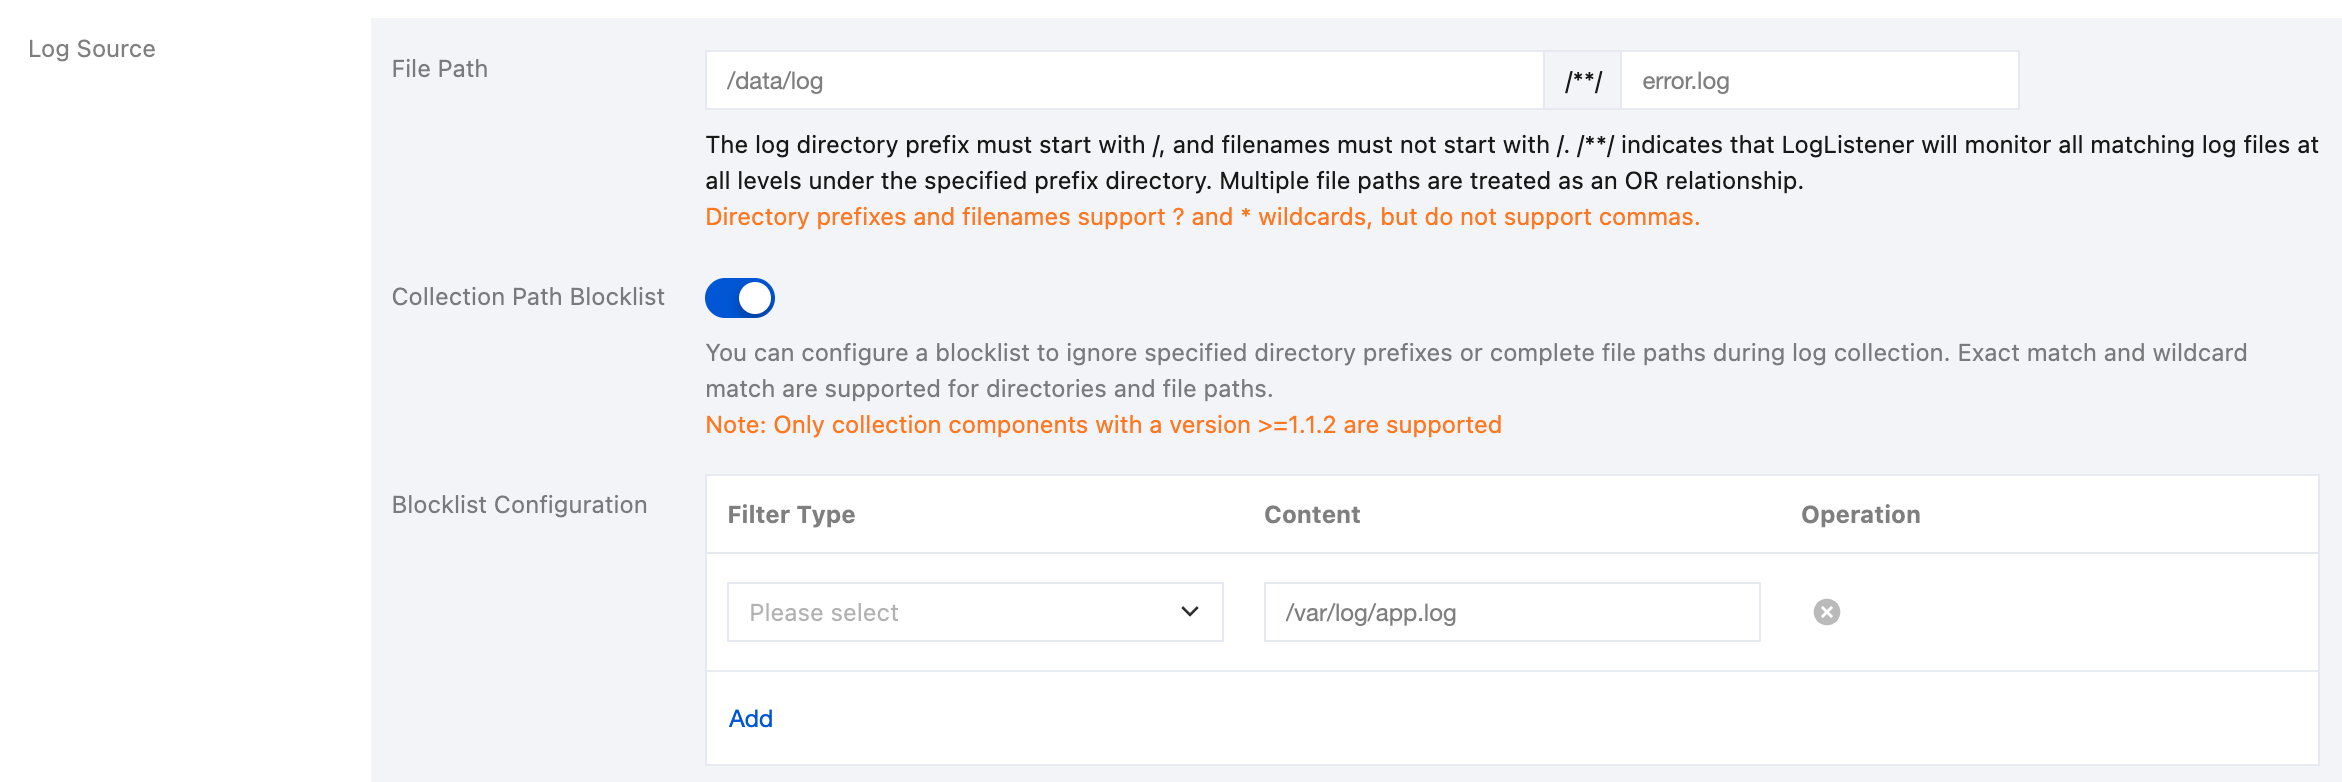
File Path: Consists of a log directory and a file name. The log directory starts with /, and the file name does not start with /. Both the log directory and the file name support the use of wildcard characters (? and *). Commas are not supported. /**/ indicates that the log collection component will monitor all levels of log files that match the specified directory. Multiple file paths are in an OR relationship. For example, if a container file path is
/opt/logs/*.log, you can specify the log with a directory of /opt/logs and a file name of *.log.Note:
Only container collection components of version 1.1.12 or later support multiple paths for collection.
Only collection configurations created after container collection components are upgraded to version 1.1.12 or later support defining multiple paths for collection.
After container collection components are upgraded to version 1.1.12, the corresponding collection configurations created in versions earlier than 1.1.12 do not support configuring multiple paths for collection. The collection configurations need to be recreated.
Collection Path Blocklist: After this configuration is enabled, specified directory paths or complete file paths can be ignored during collection. Directory paths and file paths can be fully matched and support wildcard pattern matching.
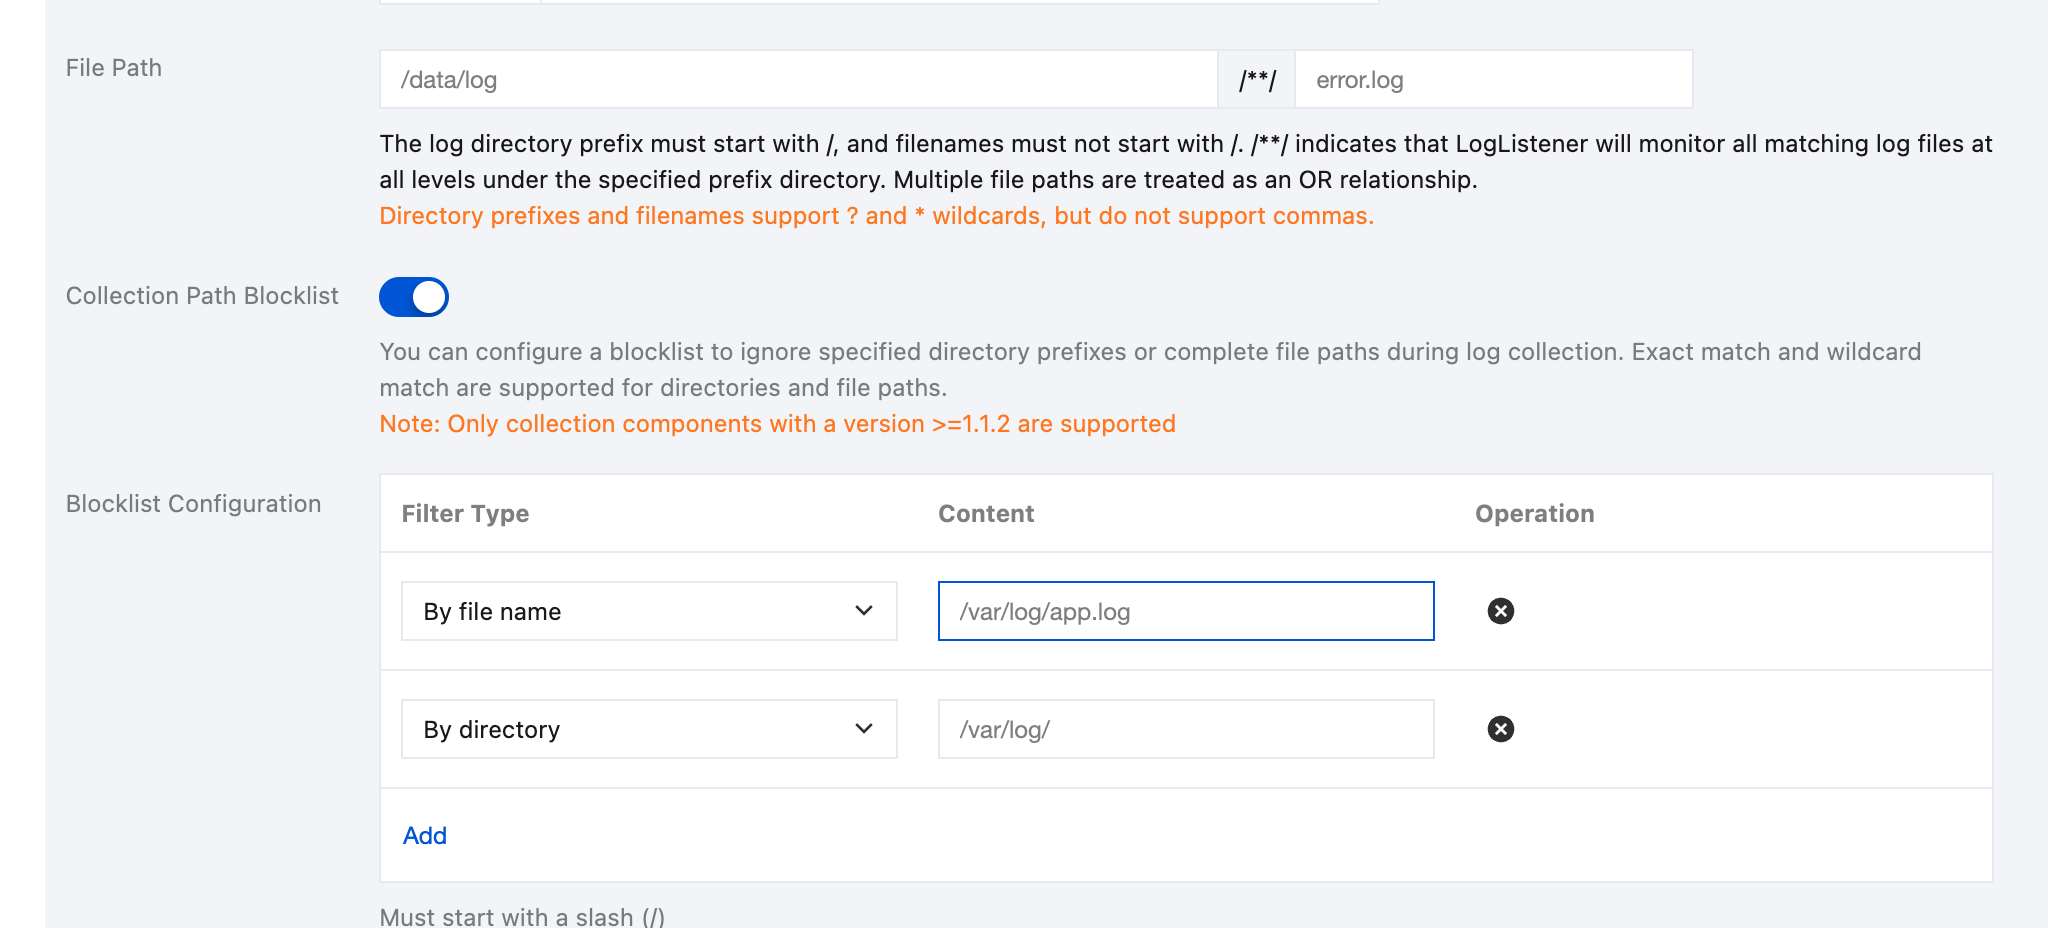
Blocklist Configuration: Collection blocklists are divided into two filter types, which can be used simultaneously:
By File Path: Under the collection path, the specified complete file path needs to be ignored for collection. The file path supports wildcard characters (* and ?), and supports ** path fuzzy matching.
By Directory Path: Under the collection path, the specified directory needs to be ignored for collection. The directory supports wildcard characters (* and ?), and supports ** path fuzzy matching.
Note:
Container log collection components of version 1.1.2 or later are required.
Files and directory paths specified in blocklists are excluded during collection. Therefore, whether By File Path or By Directory Path is selected, the specified path should be a subset of the collection paths.
The file path of a node consists of a log directory and a file name. The log directory starts with /, and the file name does not start with /. Both the log directory and the file name support the use of wildcards (? and *), but commas are not supported. /**/ indicates that a log collection component will monitor all levels of log files that match the specified log directory. Multiple file paths are in an OR relationship. For example, if a node file path is
/opt/logs/*.log, you can specify the with a log directory of /opt/logs and a file name of *.log.Note:
Only collection components of version 1.1.12 or later support multiple paths for collection.
Only collection configurations created after container collection components are upgraded to version 1.1.12 or later support defining multiple paths for collection.
After container collection components are upgraded to version 1.1.12, the corresponding collection configurations created in versions earlier than 1.1.12 do not support configuring multiple paths for collection. The collection configurations need to be recreated.
Collection Path Blocklist: After the option is enabled, specified directory paths or complete file paths can be ignored during collection. Directory paths and file paths can be fully matched and support wildcard pattern matching.
Blocklist Configuration: Collection blocklists are divided into two filter types, which can be used simultaneously:
By File Path: Under the collection path, the specified complete file path needs to be ignored for collection. The file path supports wildcard characters (* and ?), and supports ** path fuzzy matching.
By Directory Path: Under the collection path, the specified directory needs to be ignored for collection. The directory supports wildcard characters (* and ?), and supports ** path fuzzy matching.
Note:
Container log collection components of version 1.1.2 or later are required.
Files and directory paths specified in blocklists are excluded during collection. Therefore, whether By File Path or By Directory Path is selected, the specified path should be a subset of the collection paths.
Metadata configuration:
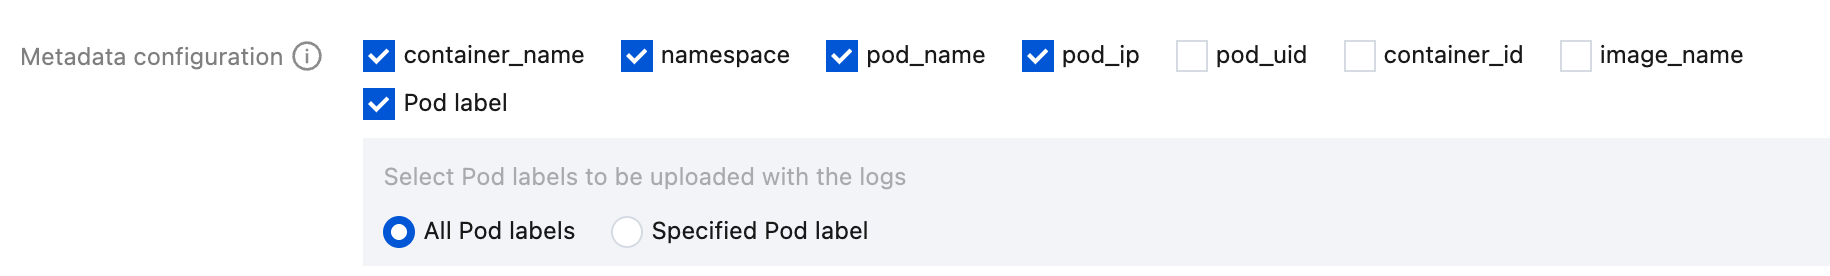
In addition to raw log content, Cloud Log Service (CLS) also reports metadata related to containers or Kubernetes to CLS together. For example, the ID of the container that generates logs can be reported to CLS. This is convenient for users to trace the source when viewing logs or retrieve according to container IDs and features (for example, container name and labels). You can report this metadata and select as needed for uploading.
For container or Kubernetes-related metadata, refer to the table below:
Field Name | Description |
container_id | Container ID to which logs belong. |
container_name | Container name to which logs belong. |
image_name | Image name/IP of the container to which logs belong. |
namespace | The namespace of the pod to which logs belong. |
pod_uid | UID of the pod to which logs belong. |
pod_name | Name of the pod to which logs belong. |
pod_ip | IP address of the pod to which logs belong. |
pod_lable_{label name} | Label of the pod to which logs belong. For example, if a pod has two labels: app=nginx and env=prod, then the uploaded log will be accompanied by two metadata entries: pod_label_app:nginx and pod_label_env:prod. |
Note:
If you want to collect some pod labels, you need to manually input one or more desired label keys, ending each one with Enter, and the hits will be collected.
Parsing Rule Configuration:
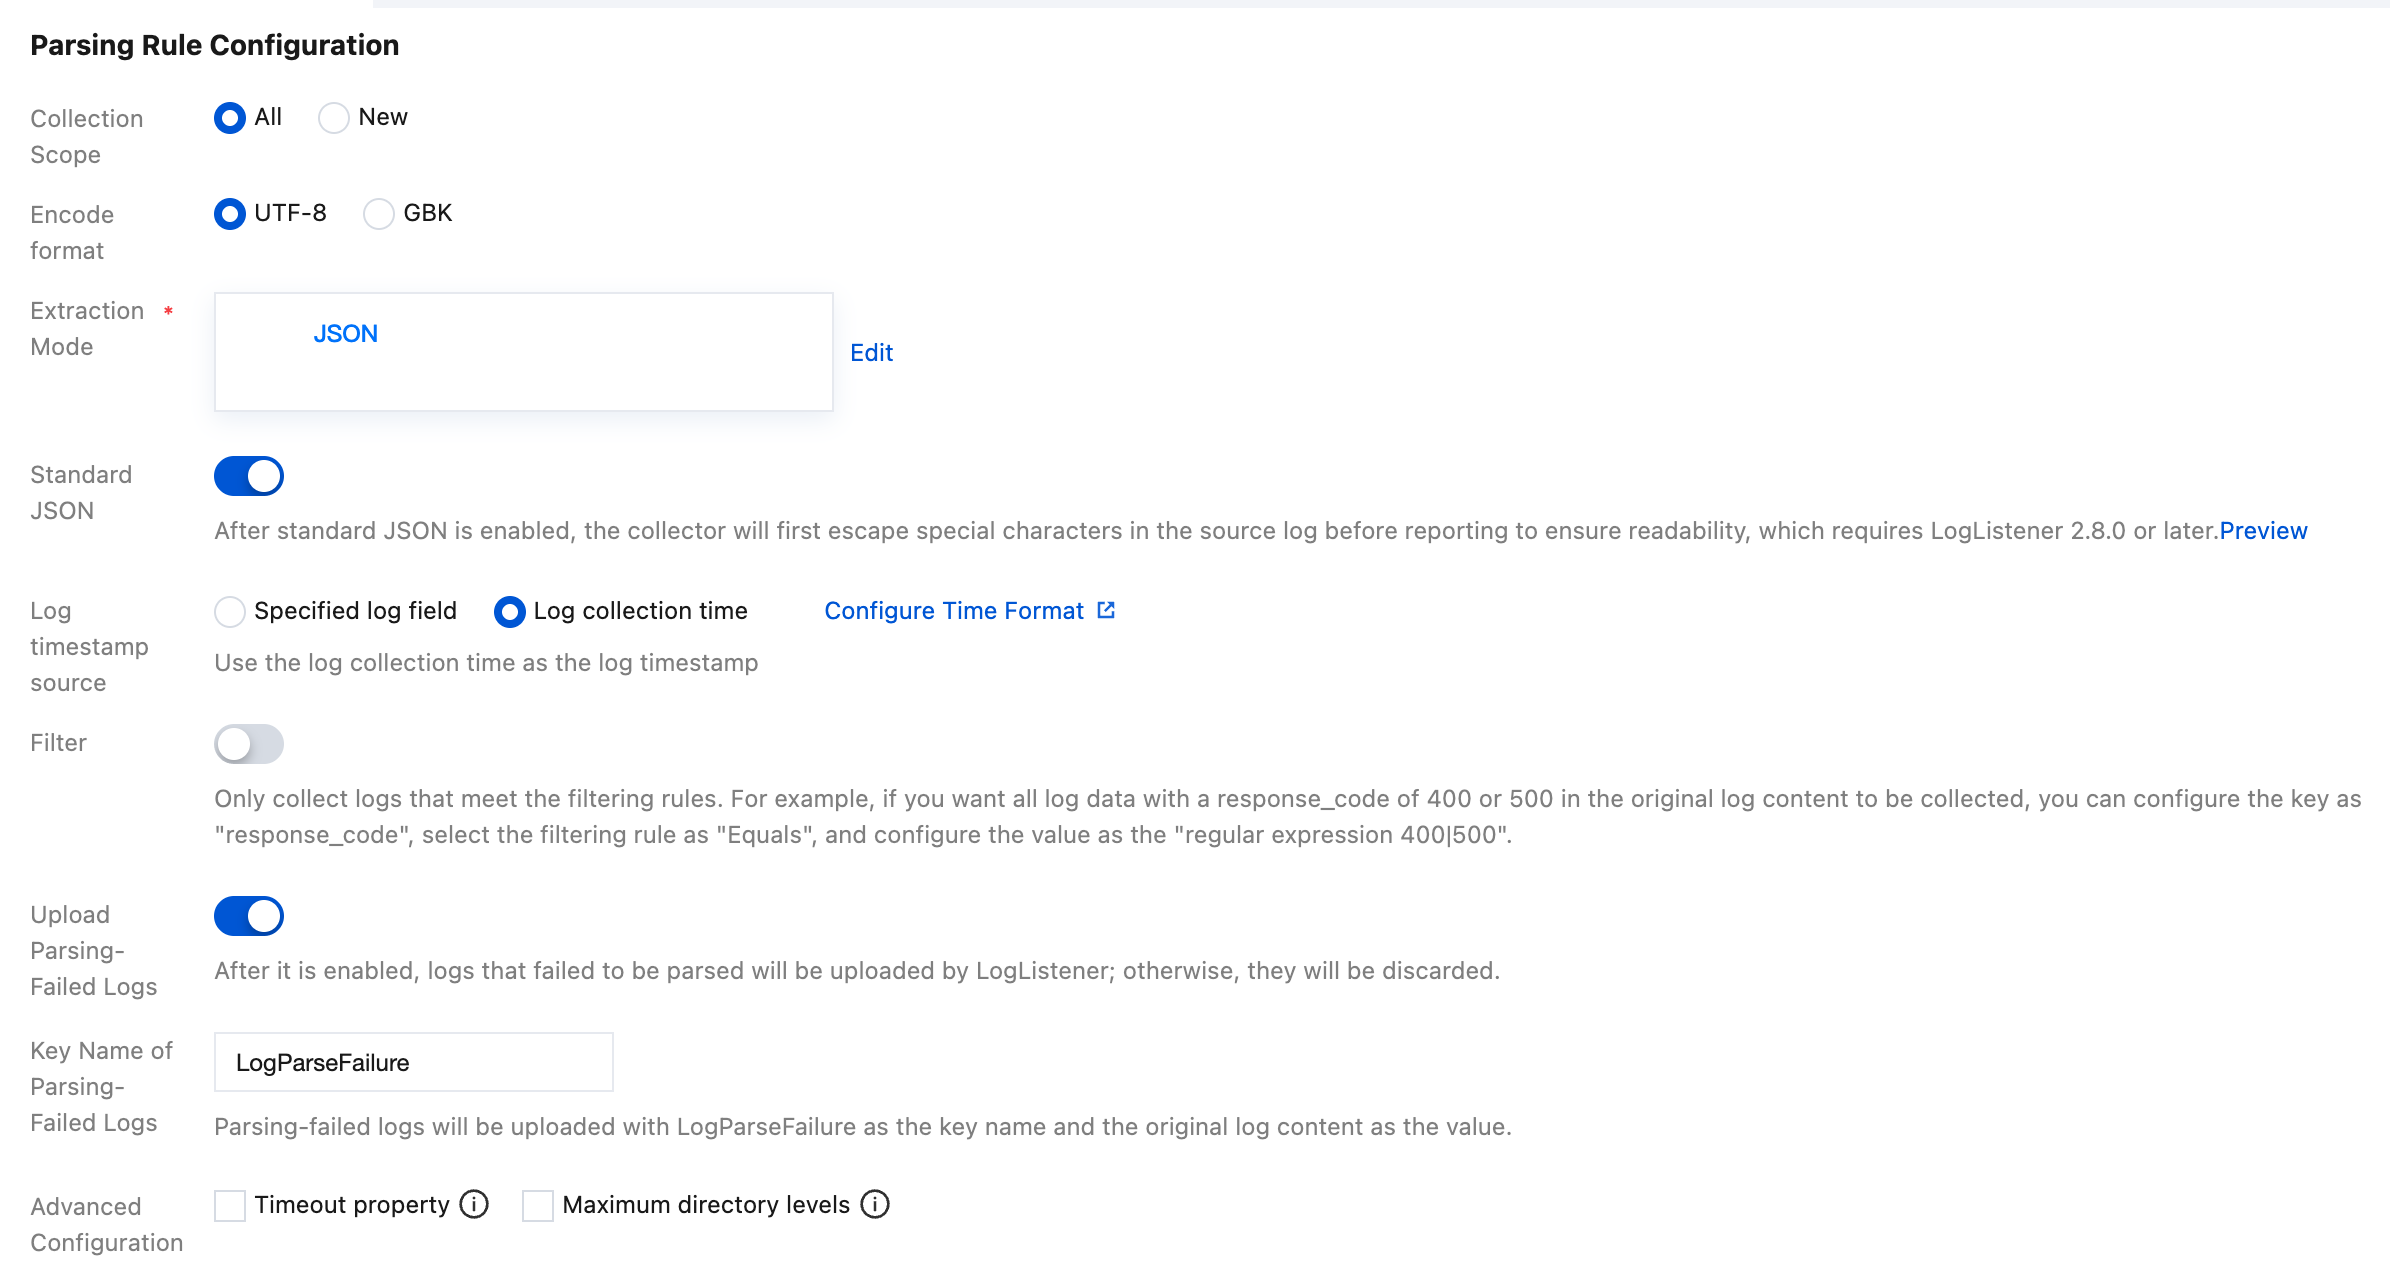
Configure Collection Scope. You can select All or New.
All: Full collection represents starting to collect from the beginning of the log file.
New: Incremental collection represents collecting only the newly added content in the file.
Encode format: Supports UTF-8 and GBK.
Extraction Mode: Supports multiple types of extraction modes, details are as follows:
A single-line full-text log represents that the content of a complete log contains only one line. If a single-line full-text log is collected, CLS will use the line break \\n as the end identifier of the log. For unified structured management, each log will have a default key-value __CONTENT__, but the log data itself will not be processed in a structured manner, nor will log fields be extracted. The time attribute of a log is determined by the time when the log is collected.
A sample raw data entry of a log is as follows:
Tue Jan 22 12:08:15 CST 2019 Installed: libjpeg-turbo-static-1.2.90-6.el7.x86_64
The data collected from Cloud Log Service is:
__CONTENT__:Tue Jan 22 12:08:15 CST 2019 Installed: libjpeg-turbo-static-1.2.90-6.el7.x86_64
A multi-line full-text log represents that the content of a complete log may span multiple lines, for example, Java stack trace. In this case, it is somewhat unreasonable to use the line break \\n as the end identifier of the log. In order to enable the logging system to clearly distinguish each log, the first-line regular expression method is adopted for matching. If a certain line of a log matches the preset regular expression, it is considered as the beginning of the log, and the beginning of the next line appears as the end identifier of the log.
For multi-line full text, a default key-value __CONTENT__ will also be set, but the log data itself will no longer be processed in a structured manner, nor will log fields be extracted. The time attribute of a log is determined by the time when the log is collected.
A sample raw data entry of a multi-line log is as follows:
2019-12-15 17:13:06,043 [main] ERROR com.test.logging.FooFactory:java.lang.NullPointerExceptionat com.test.logging.FooFactory.createFoo(FooFactory.java:15)at com.test.logging.FooFactoryTest.test(FooFactoryTest.java:11)
The first-line regular expression method is as follows:
\\d{4}-\\d{2}-\\d{2}\\s\\d{2}:\\d{2}:\\d{2},\\d{3}\\s.+
The data collected from Cloud Log Service is:
__CONTENT__:2019-12-15 17:13:06,043 [main] ERROR com.test.logging.FooFactory:\\njava.lang.NullPointerException\\n at com.test.logging.FooFactory.createFoo(FooFactory.java:15)\\n at com.test.logging.FooFactoryTest.test(FooFactoryTest.java:11)
The single-line full regular expression format is usually used to process structured logs, which represents a log parsing pattern that extracts multiple key-value pairs from a complete log using regular expressions.
A sample raw data entry of a log is as follows:
10.135.46.111 - - [22/Jan/2019:19:19:30 +0800] "GET /my/course/1 HTTP/1.1" 127.0.0.1 200 782 9703 "http://127.0.0.1/course/explore?filter%5Btype%5D=all&filter%5Bprice%5D=all&filter%5BcurrentLevelId%5D=all&orderBy=studentNum" "Mozilla/5.0 (Windows NT 10.0; WOW64; rv:64.0) Gecko/20100101 Firefox/64.0" 0.354 0.354
The configured regular expression is as follows:
(\\S+)[^\\[]+(\\[[^:]+:\\d+:\\d+:\\d+\\s\\S+)\\s"(\\w+)\\s(\\S+)\\s([^"]+)"\\s(\\S+)\\s(\\d+)\\s(\\d+)\\s(\\d+)\\s"([^"]+)"\\s"([^"]+)"\\s+(\\S+)\\s(\\S+).*
The data collected from Cloud Log Service is:
body_bytes_sent: 9703http_host: 127.0.0.1http_protocol: HTTP/1.1http_referer: http://127.0.0.1/course/explore?filter%5Btype%5D=all&filter%5Bprice%5D=all&filter%5BcurrentLevelId%5D=all&orderBy=studentNumhttp_user_agent: Mozilla/5.0 (Windows NT 10.0; WOW64; rv:64.0) Gecko/20100101 Firefox/64.0remote_addr: 10.135.46.111request_length: 782request_method: GETrequest_time: 0.354request_url: /my/course/1status: 200time_local: [22/Jan/2019:19:19:30 +0800]upstream_response_time: 0.354
Assume that one of your log raw data is:
[2018-10-01T10:30:01,000] [INFO] java.lang.Exception: exception happenedat TestPrintStackTrace.f(TestPrintStackTrace.java:3)at TestPrintStackTrace.g(TestPrintStackTrace.java:7)at TestPrintStackTrace.main(TestPrintStackTrace.java:16)
The regular expression of the line header is:
\\[\\d+-\\d+-\\w+:\\d+:\\d+,\\d+]\\s\\[\\w+]\\s.*
The custom regular expression configured is:
\\[(\\d+-\\d+-\\w+:\\d+:\\d+,\\d+)\\]\\s\\[(\\w+)\\]\\s(.*)
After the system extracts the corresponding key-value according to
() capture group, you can customize the key name of each group as follows:time: 2018-10-01T10:30:01,000`level: INFO`msg:java.lang.Exception: exception happenedat TestPrintStackTrace.f(TestPrintStackTrace.java:3)at TestPrintStackTrace.g(TestPrintStackTrace.java:7)at TestPrintStackTrace.main(TestPrintStackTrace.java:16)
Assume that one of your JSON log raw data is:
{"remote_ip":"10.135.46.111","time_local":"22/Jan/2019:19:19:34 +0800","body_sent":23,"responsetime":0.232,"upstreamtime":"0.232","upstreamhost":"unix:/tmp/php-cgi.sock","http_host":"127.0.0.1","method":"POST","url":"/event/dispatch","request":"POST /event/dispatch HTTP/1.1","xff":"-","referer":"http://127.0.0.1/my/course/4","agent":"Mozilla/5.0 (Windows NT 10.0; WOW64; rv:64.0) Gecko/20100101 Firefox/64.0","response_code":"200"}
After being processed and structured by CLS, this log will become as follows:
agent: Mozilla/5.0 (Windows NT 10.0; WOW64; rv:64.0) Gecko/20100101 Firefox/64.0body_sent: 23http_host: 127.0.0.1method: POSTreferer: http://127.0.0.1/my/course/4remote_ip: 10.135.46.111request: POST /event/dispatch HTTP/1.1response_code: 200responsetime: 0.232time_local: 22/Jan/2019:19:19:34 +0800upstreamhost: unix:/tmp/php-cgi.sockupstreamtime: 0.232url: /event/dispatchxff: -
Assume that one of your log raw data is:
10.20.20.10 - ::: [Tue Jan 22 14:49:45 CST 2019 +0800] ::: GET /online/sample HTTP/1.1 ::: 127.0.0.1 ::: 200 ::: 647 ::: 35 ::: http://127.0.0.1/
When the log parsing separator is specified as
:::, this log will be divided into eight fields and each of these fields will be assigned a unique key, as shown below:IP: 10.20.20.10 -bytes: 35host: 127.0.0.1length: 647referer: http://127.0.0.1/request: GET /online/sample HTTP/1.1status: 200time: [Tue Jan 22 14:49:45 CST 2019 +0800]
Assume that the raw data of a log is:
1571394459, http://127.0.0.1/my/course/4|10.135.46.111|200, status:DEAD,
The content of the custom plugins is as follows:
{"processors": [{"type": "processor_split_delimiter","detail": {"Delimiter": ",","ExtractKeys": [ "time", "msg1","msg2"]},"processors": [{"type": "processor_timeformat","detail": {"KeepSource": true,"TimeFormat": "%s","SourceKey": "time"}},{"type": "processor_split_delimiter","detail": {"KeepSource": false,"Delimiter": "|","SourceKey": "msg1","ExtractKeys": [ "submsg1","submsg2","submsg3"]},"processors": []},{"type": "processor_split_key_value","detail": {"KeepSource": false,"Delimiter": ":","SourceKey": "msg2"}}]}]}
After being processed and structured by CLS, this log will become as follows:
time: 1571394459submsg1: http://127.0.0.1/my/course/4submsg2: 10.135.46.111submsg3: 200status: DEAD
Filter: LogListener only collects logs that match filter rules. Key values support full matching, and filter rules support regular expression matching, such as collecting logs whose
ErrorCode = 404 only. You can enable the filter feature and configure rules as needed.Step 4: Configuring Index
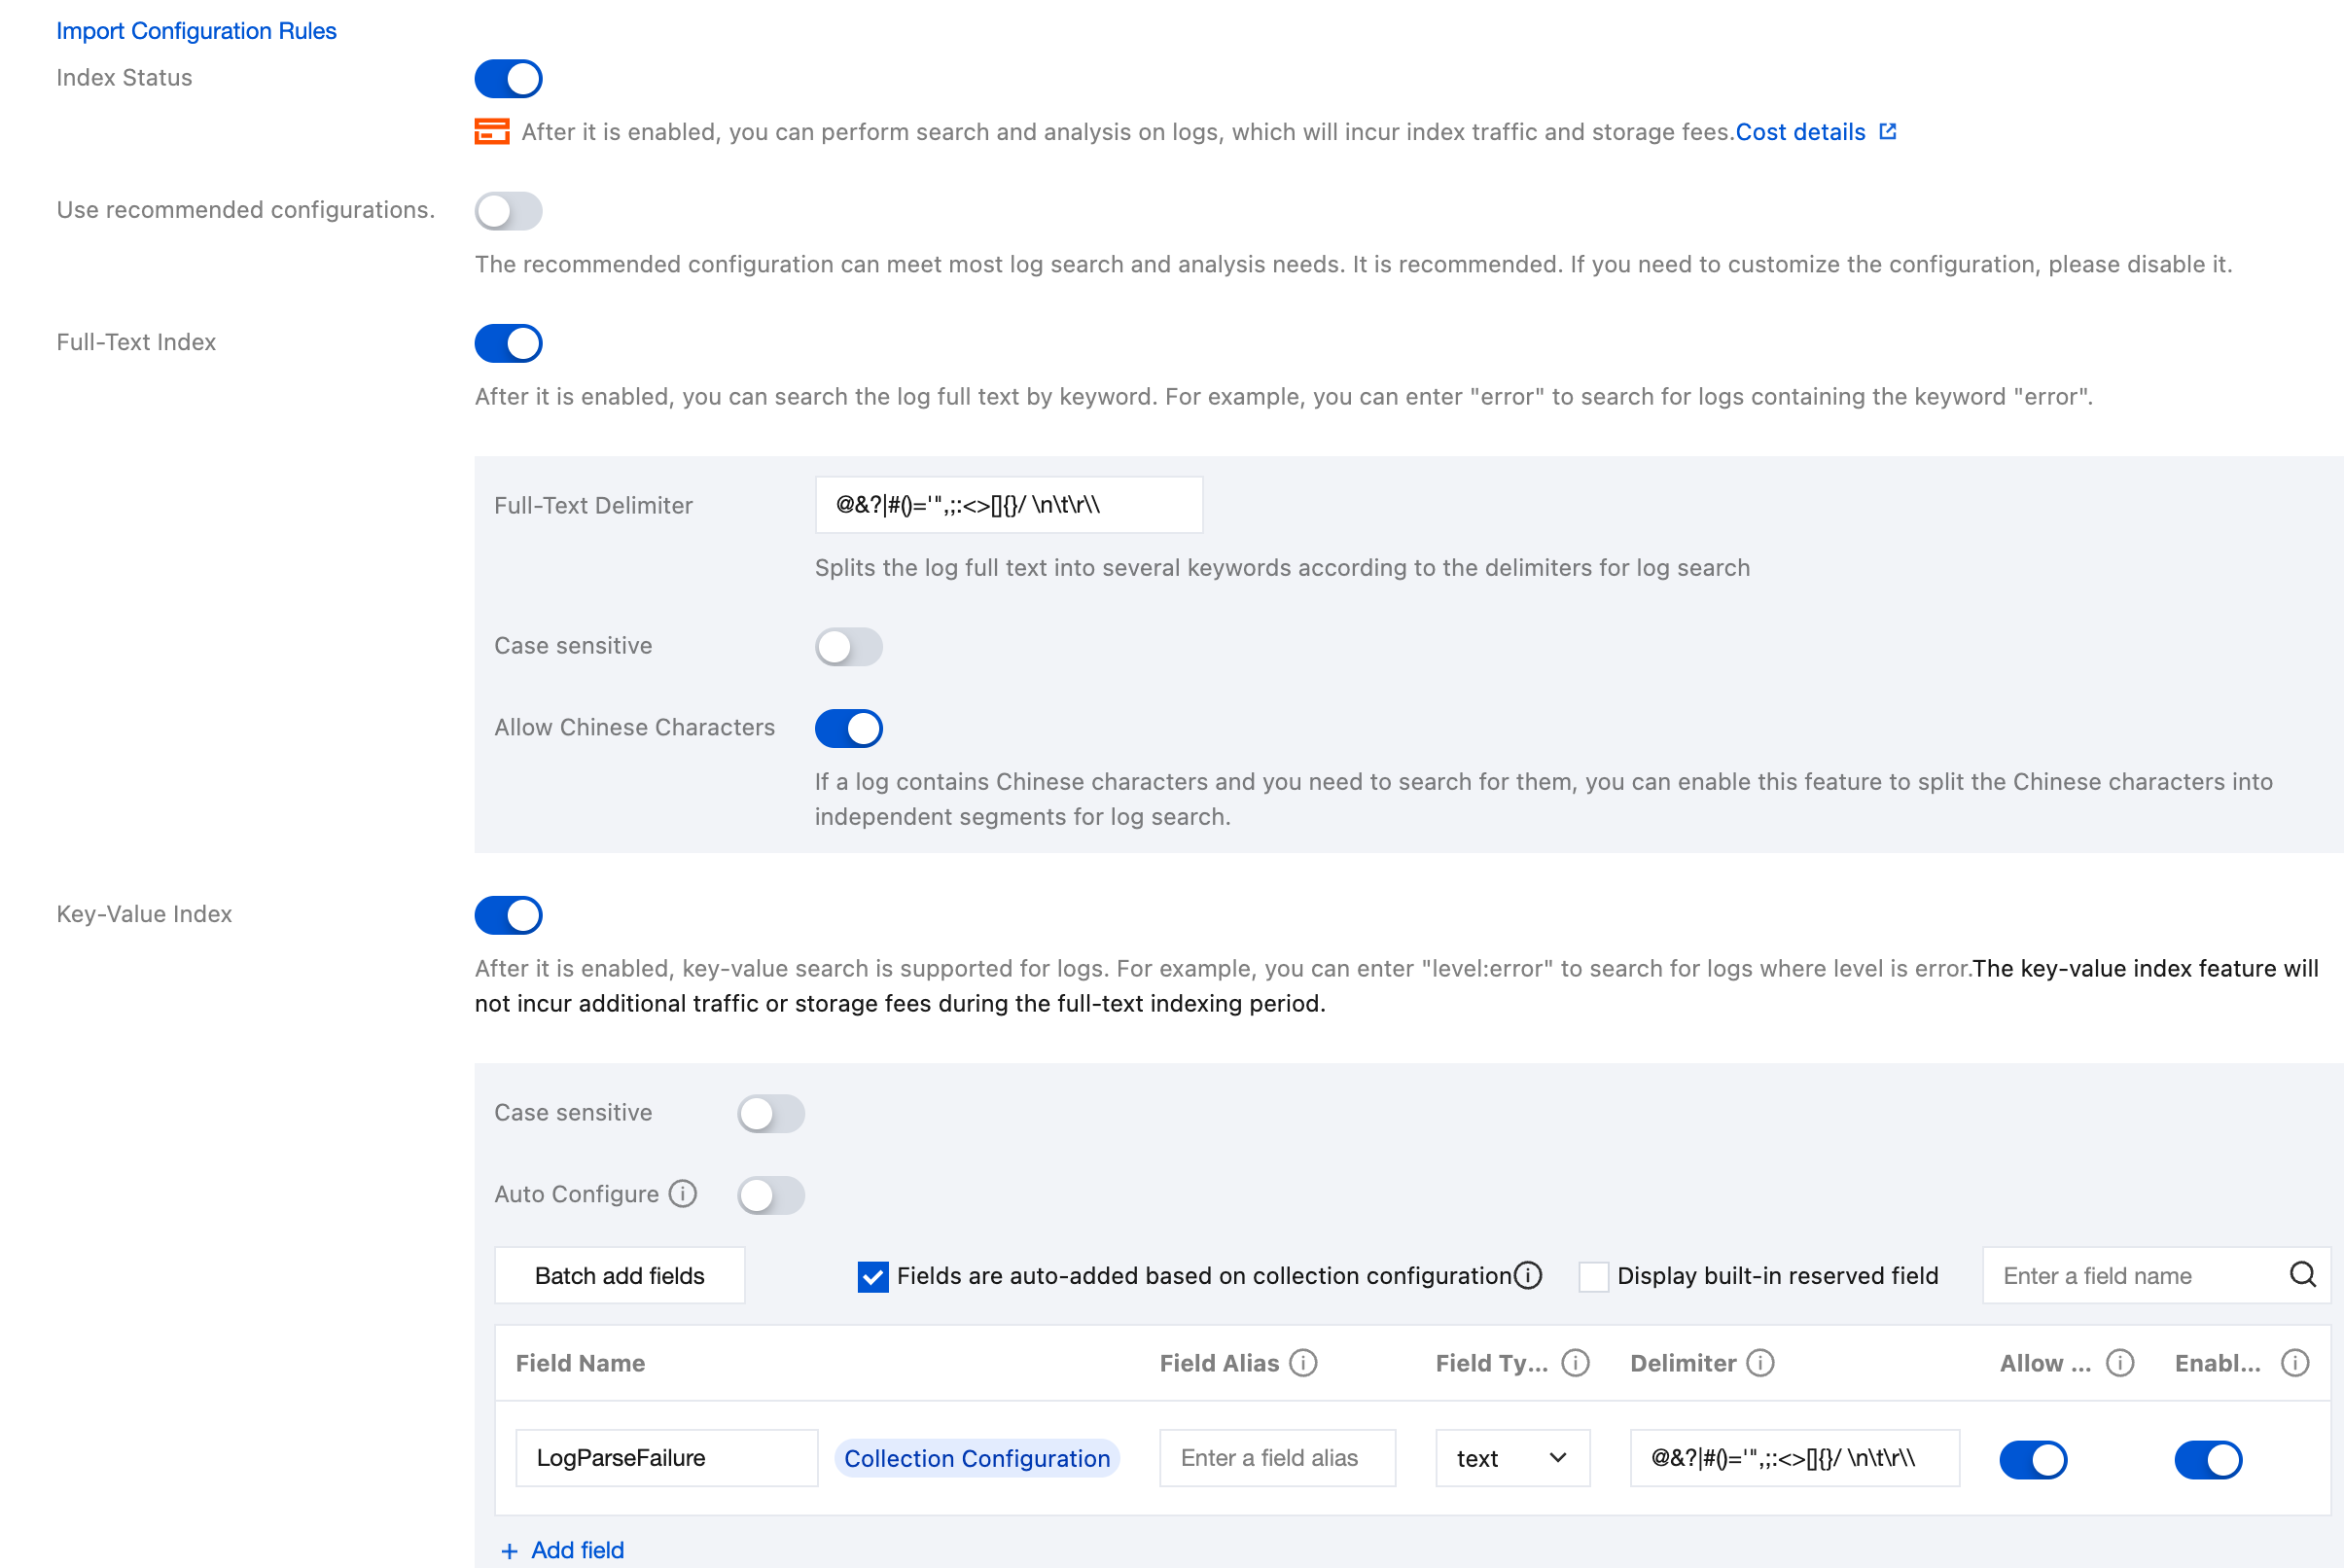
After configuring the collection rules, click Next to enter Index Configuration. For information about indexes, see Index. Configure the following information in the index configurations:

Index Status: Confirm whether the index feature is enabled to use analysis features such as log retrieval.
Full-Text Index: Confirm whether case sensitivity needs to be set. By default, the following full-text segmentation symbols are supported: @&()='",;:<>[]{}/ \\n\\t\\r. Confirm whether the default full-text word delimiters need to be modified.
Allow Chinese Characters: Confirm whether to enable this configuration.
Key-Value Index: You can configure the field type, segmentation symbol, and whether to enable statistical analysis according to the key name as needed. If you need to enable the key-value index feature, enable this configuration.
Note:
Index configuration should be enabled for retrieval; otherwise, retrieval is not available.
If you need to retrieve logs based on log fields, you need to configure key-value indexes.
If you need to perform statistical analysis based on log fields, you need to configure key-value indexes and enable statistics.
Index rules are effective only for newly written logs after being edited; existing data will not be updated.
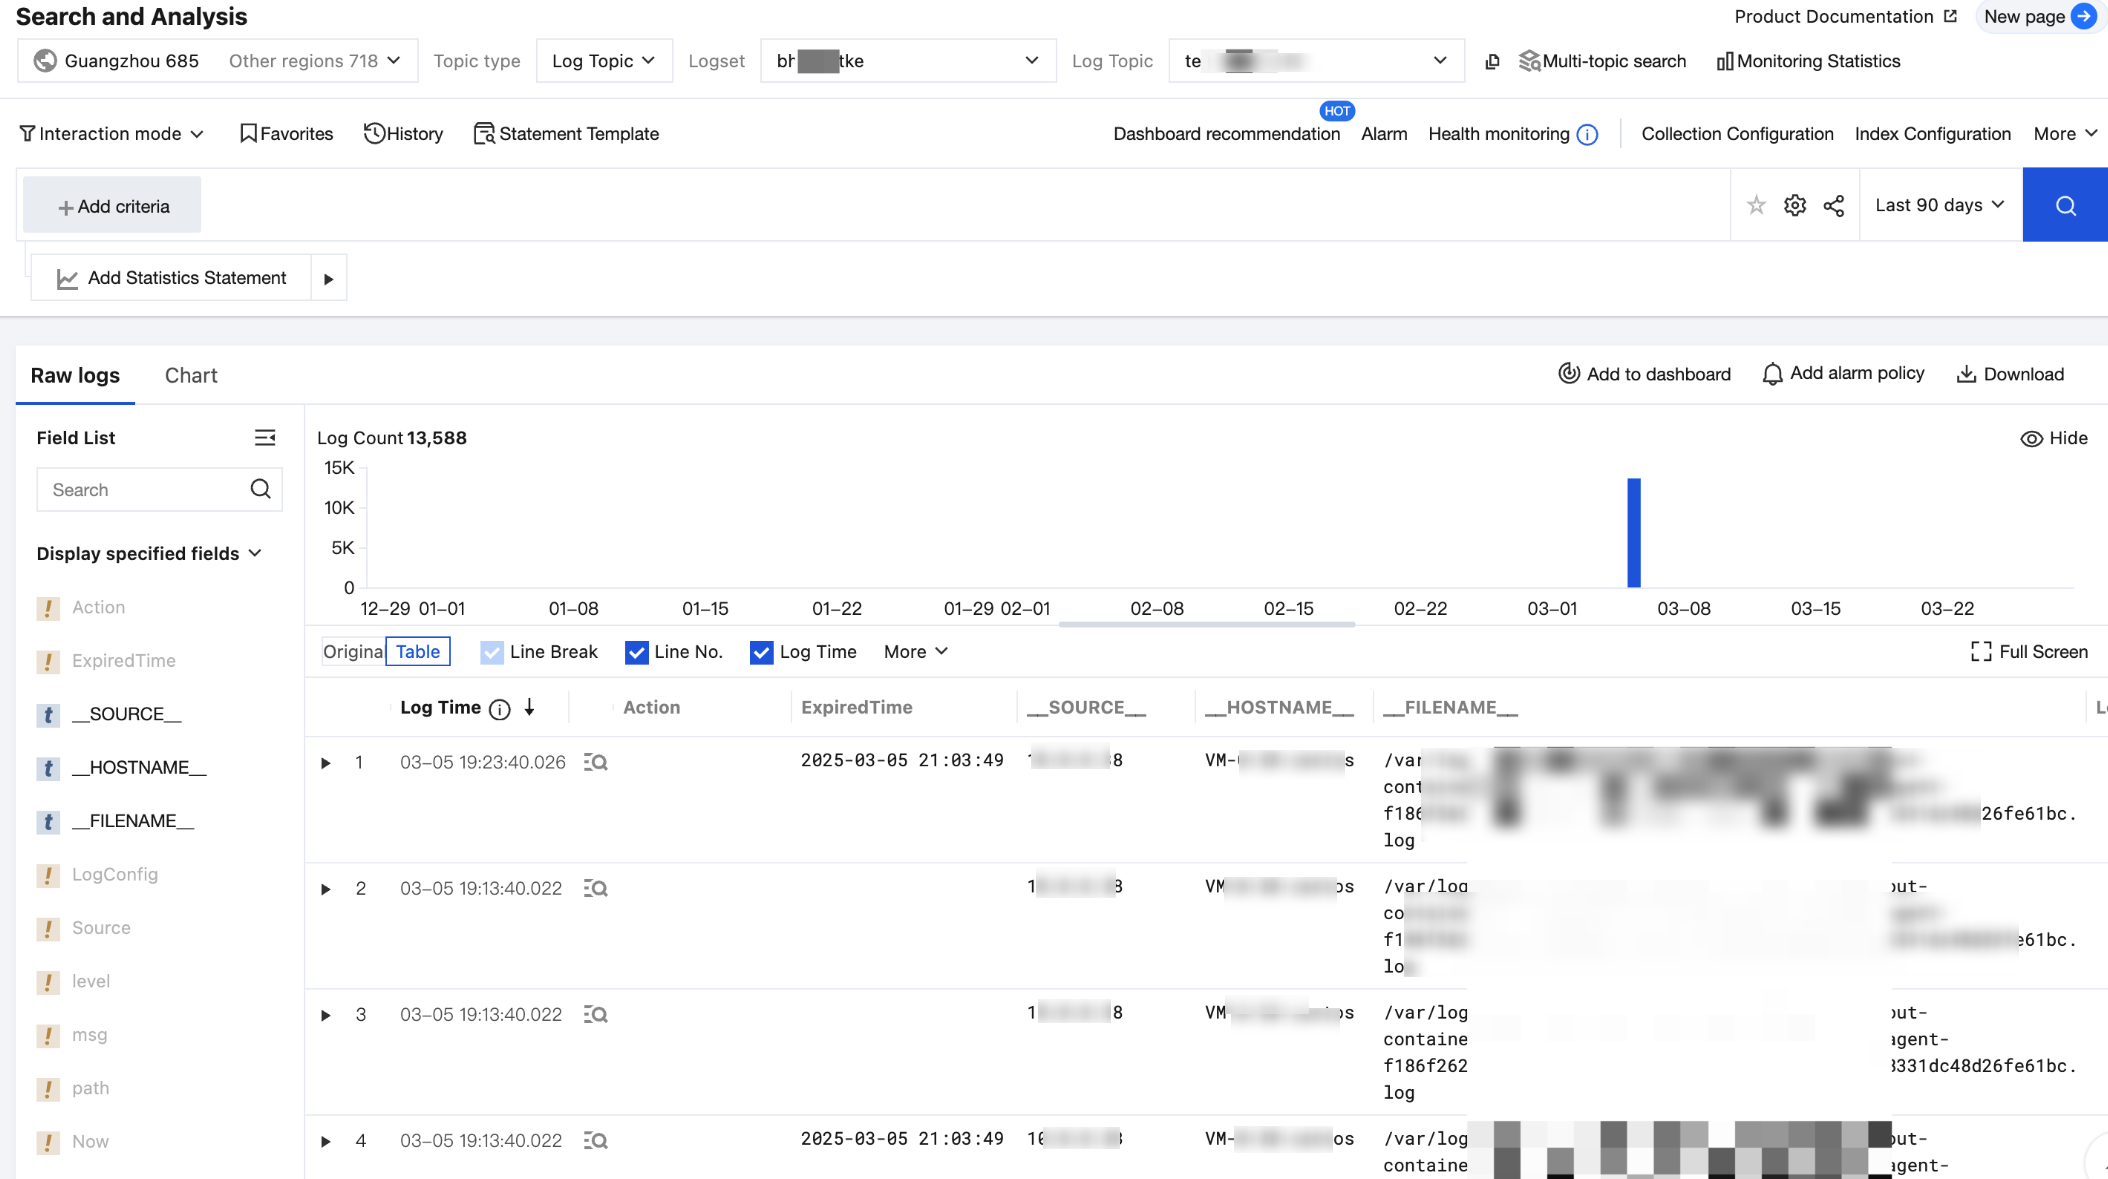
Step 5: Retrieving Business Logs
At this point, all deployments for collecting TKE cluster business logs are completed. You can choose CLS console > Search and Analysis to view the collected logs.
Managing Business Log Collection Configuration
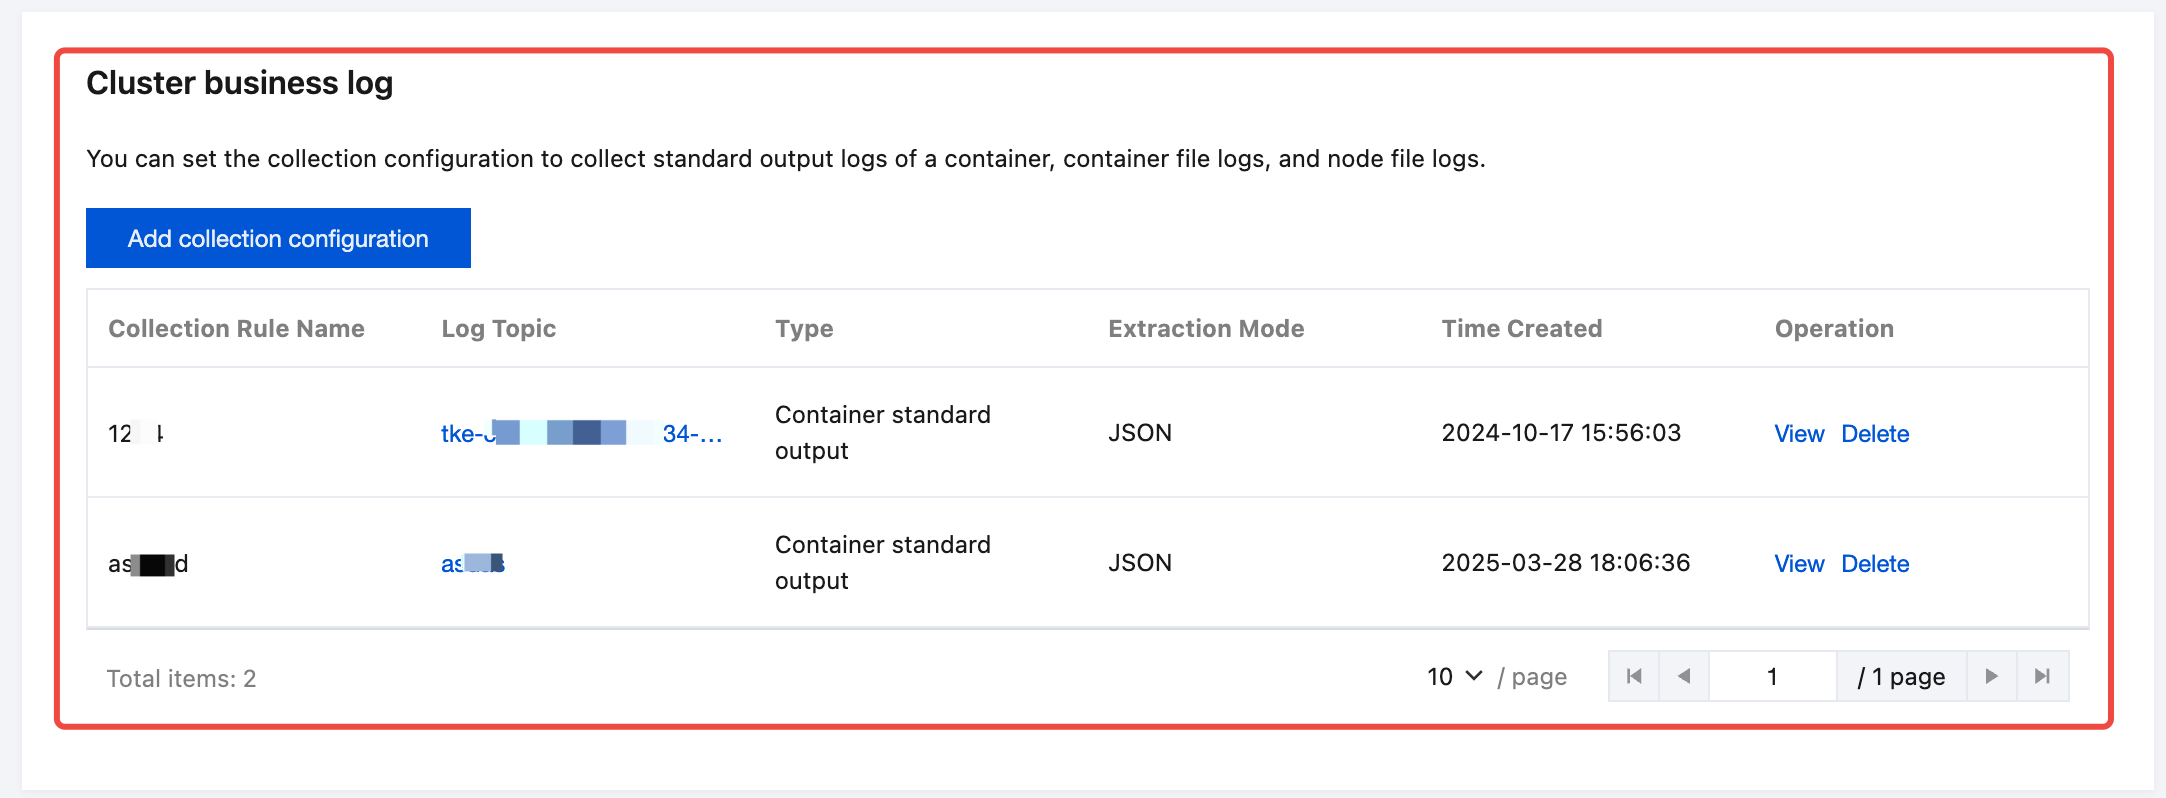
1. In Collection Management > Instance Collection, find the target TKE cluster and click the cluster name to enter the cluster details page.
2. On the cluster details page, you can view and manage your cluster business log collection configurations in Cluster business log.
Enabling Cluster Audit/Event Log Collection
Note:
Cluster audit logs record visits to the kube-apiserver as events, sequentially logging each user, administrator, or system component's activities affecting the cluster.
Cluster event logs record the operation of the cluster and the scheduling of various resources.
Step1: Selecting a Cluster
1. If the status of a collection component is Not installed, click Install to install the log collection component.
Note:
If a log collection component is installed in a cluster, a pod named tke-log-agent pod and a pod named cls-provisioner will be deployed by using DaemonSet in the kube-system namespace of the cluster. Reserve at least 0.1 cores and 16 MiB of available resources for each node.
2. If the status of a collection component is Latest, click the cluster name to enter the Cluster Details page, and find Cluster audit log or Cluster event log on the cluster details page.
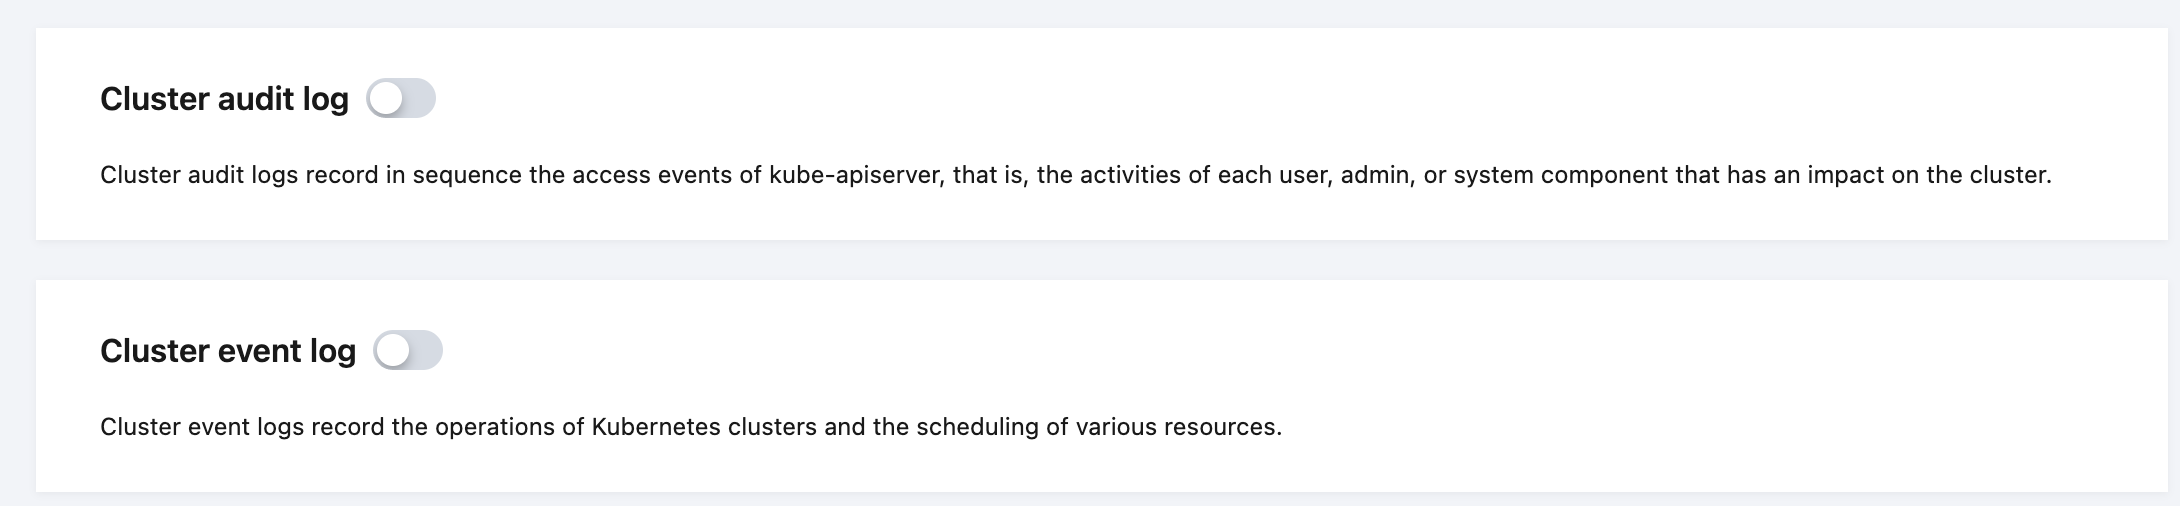
3. Enable Cluster audit log or Cluster event log and enter the corresponding configuration process.
Step 2: Selecting a Log Topic
Enter the audit or event log configuration process. In the Create Log Topic step, you can select an existing log topic or create a log topic for storing logs. For more information about log topics, see Log Topic.
Step 3: Configuring Index
After configuring the log topic, click Next to enter Index Configuration. For information about indexes, see Index. The configuration information in the index configuration is as follows:
Index Status: Confirm whether the index feature is enabled to use analysis features such as log retrieval.
Full-Text Index: Confirm whether case sensitivity needs to be set. By default, the following full-text segmentation symbols are supported: @&()='",;:<>[]{}/ \\n\\t\\r. Confirm whether the default full-text word delimiters need to be modified.
Allow Chinese Characters: Confirm whether to enable this configuration.
Key-Value Index: You can configure the field type, segmentation symbol, and whether to enable statistical analysis according to the key name as needed. If you need to enable the key-value index feature, enable this configuration.
Note
Index configuration should be enabled for retrieval; otherwise, retrieval is not available.
If you need to retrieve logs based on log fields, you need to configure key-value indexes.
If you need to perform statistical analysis based on log fields, you need to configure key-value indexes and enable statistics.
Index rules are effective only for newly written logs after being edited; existing data will not be updated.
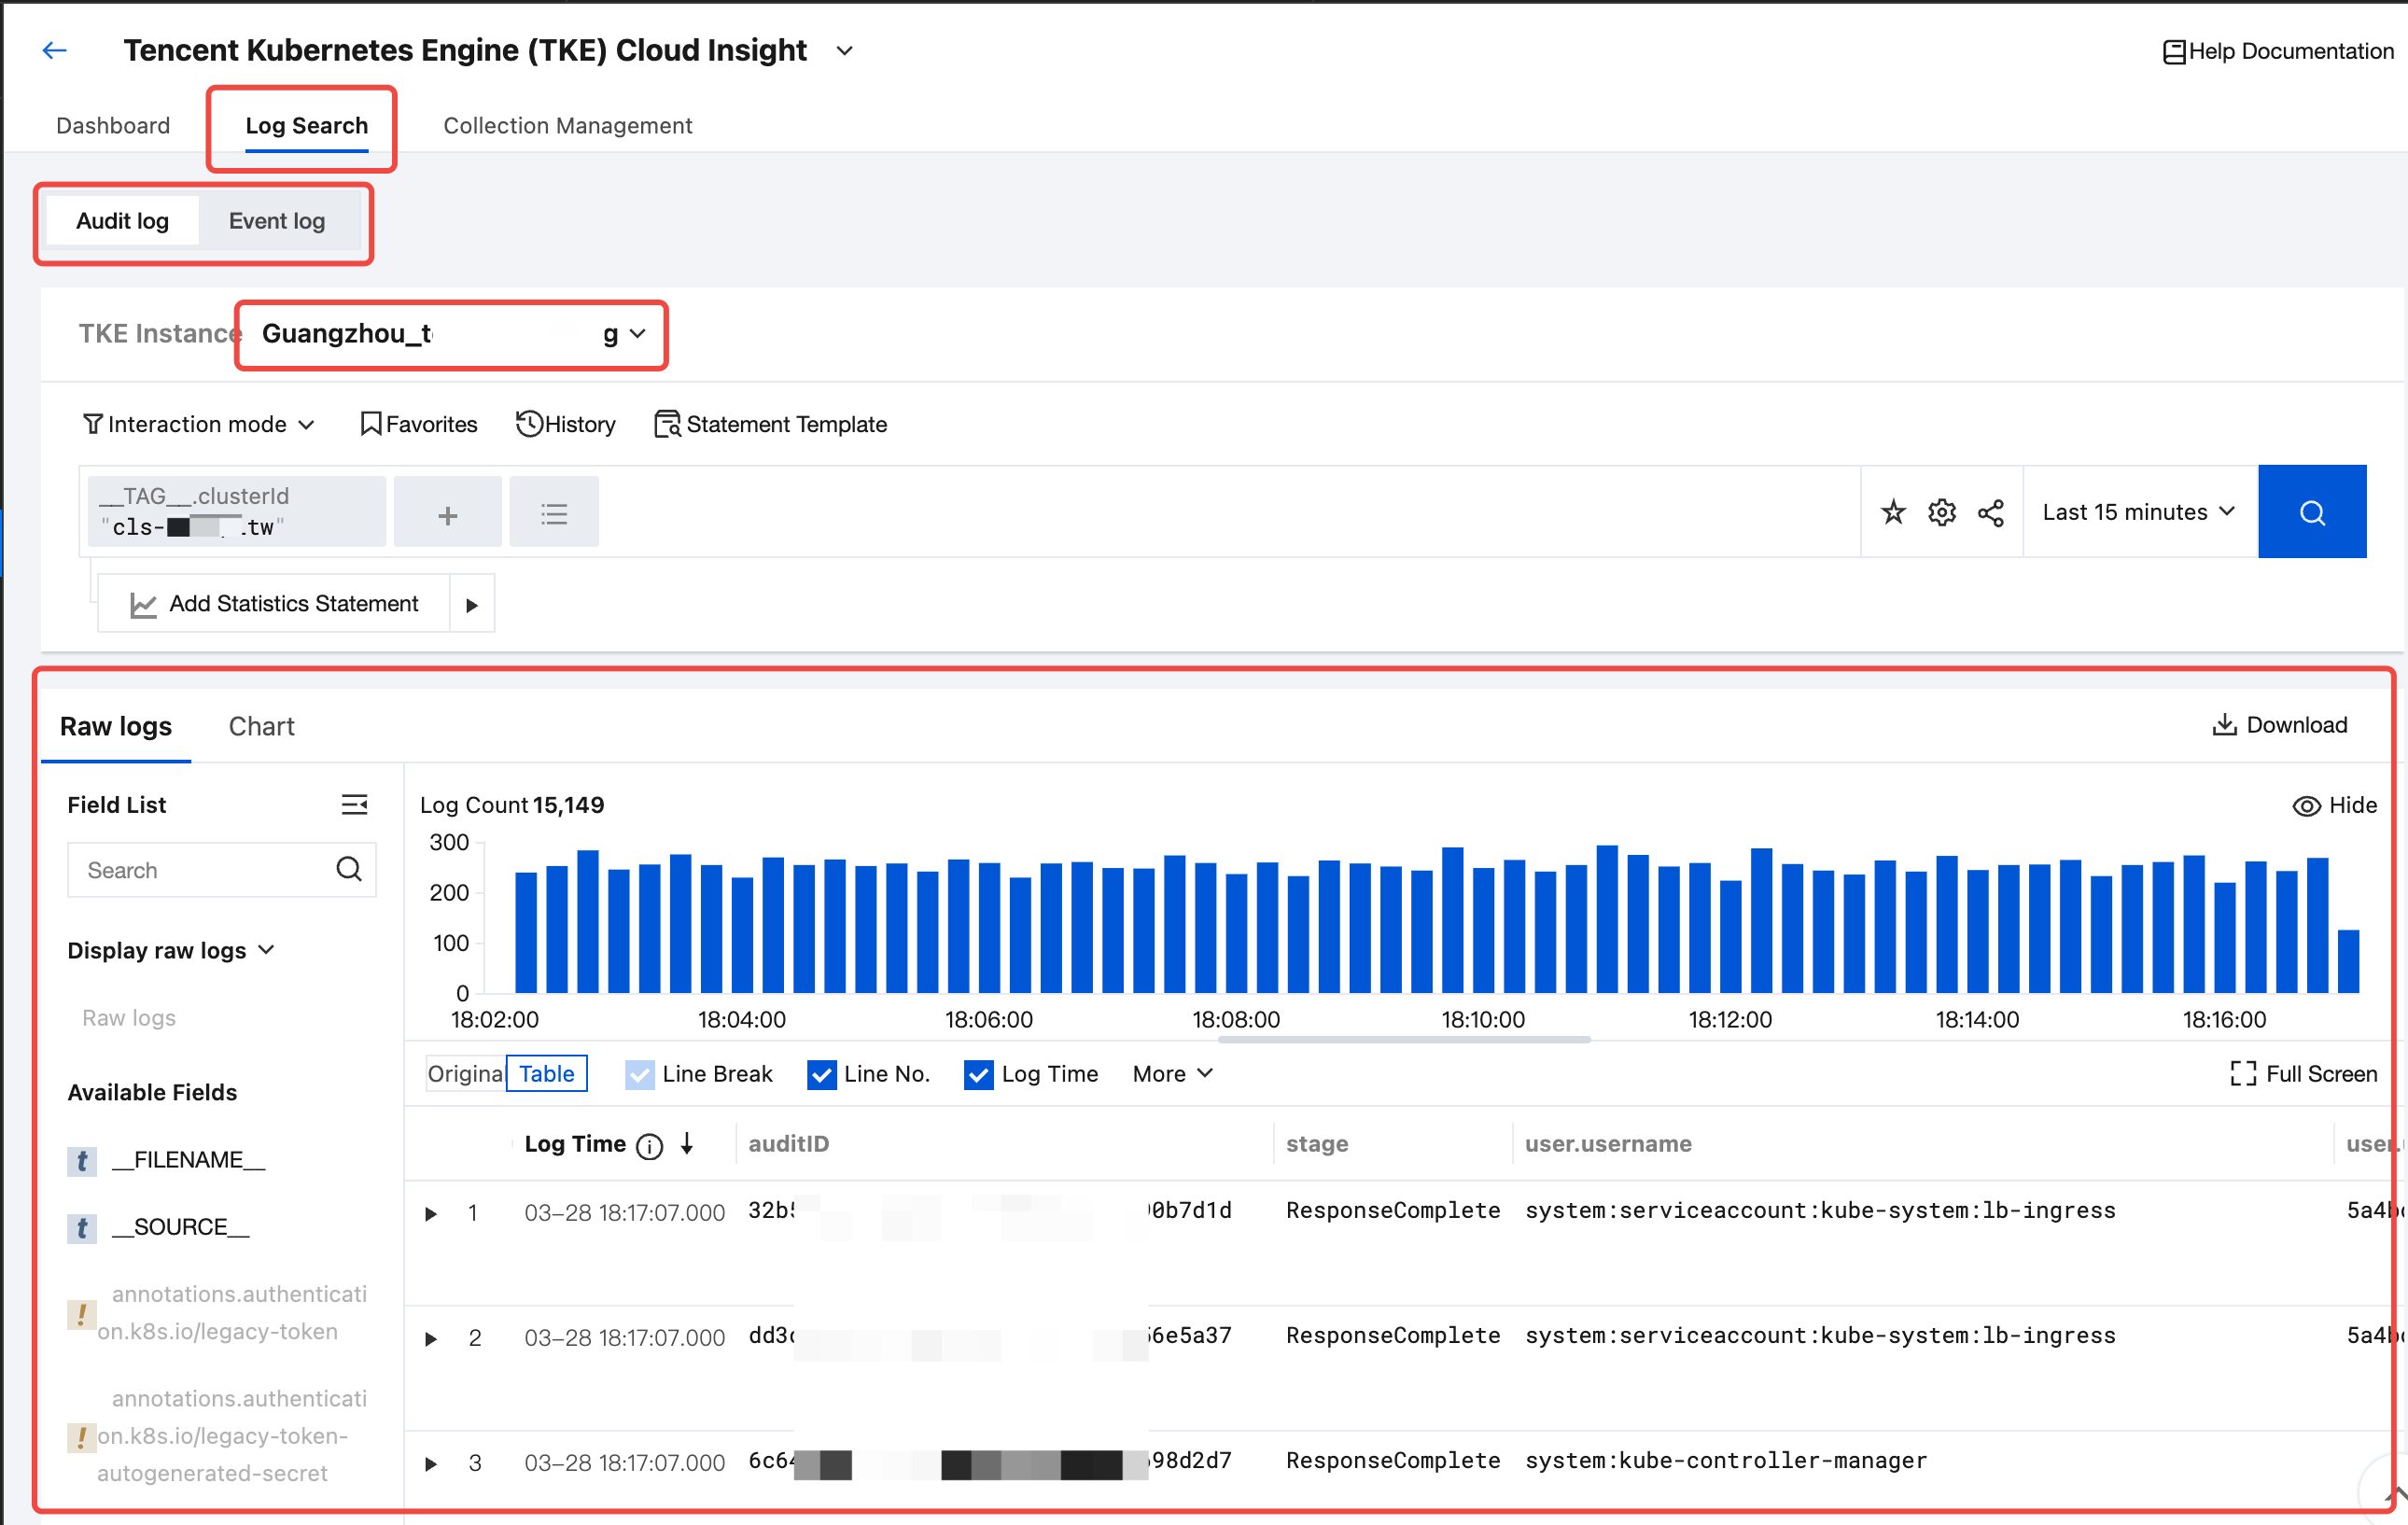
Step 4: Retrieving Audit and Event Logs
At this point, all deployments for collecting audit or event business logs of the TKE Kubernetes cluster are completed. You can click Log Search, select a log type (audit or event) you want to retrieve, and select the target cluster to retrieve audit or event logs related to the selected cluster.
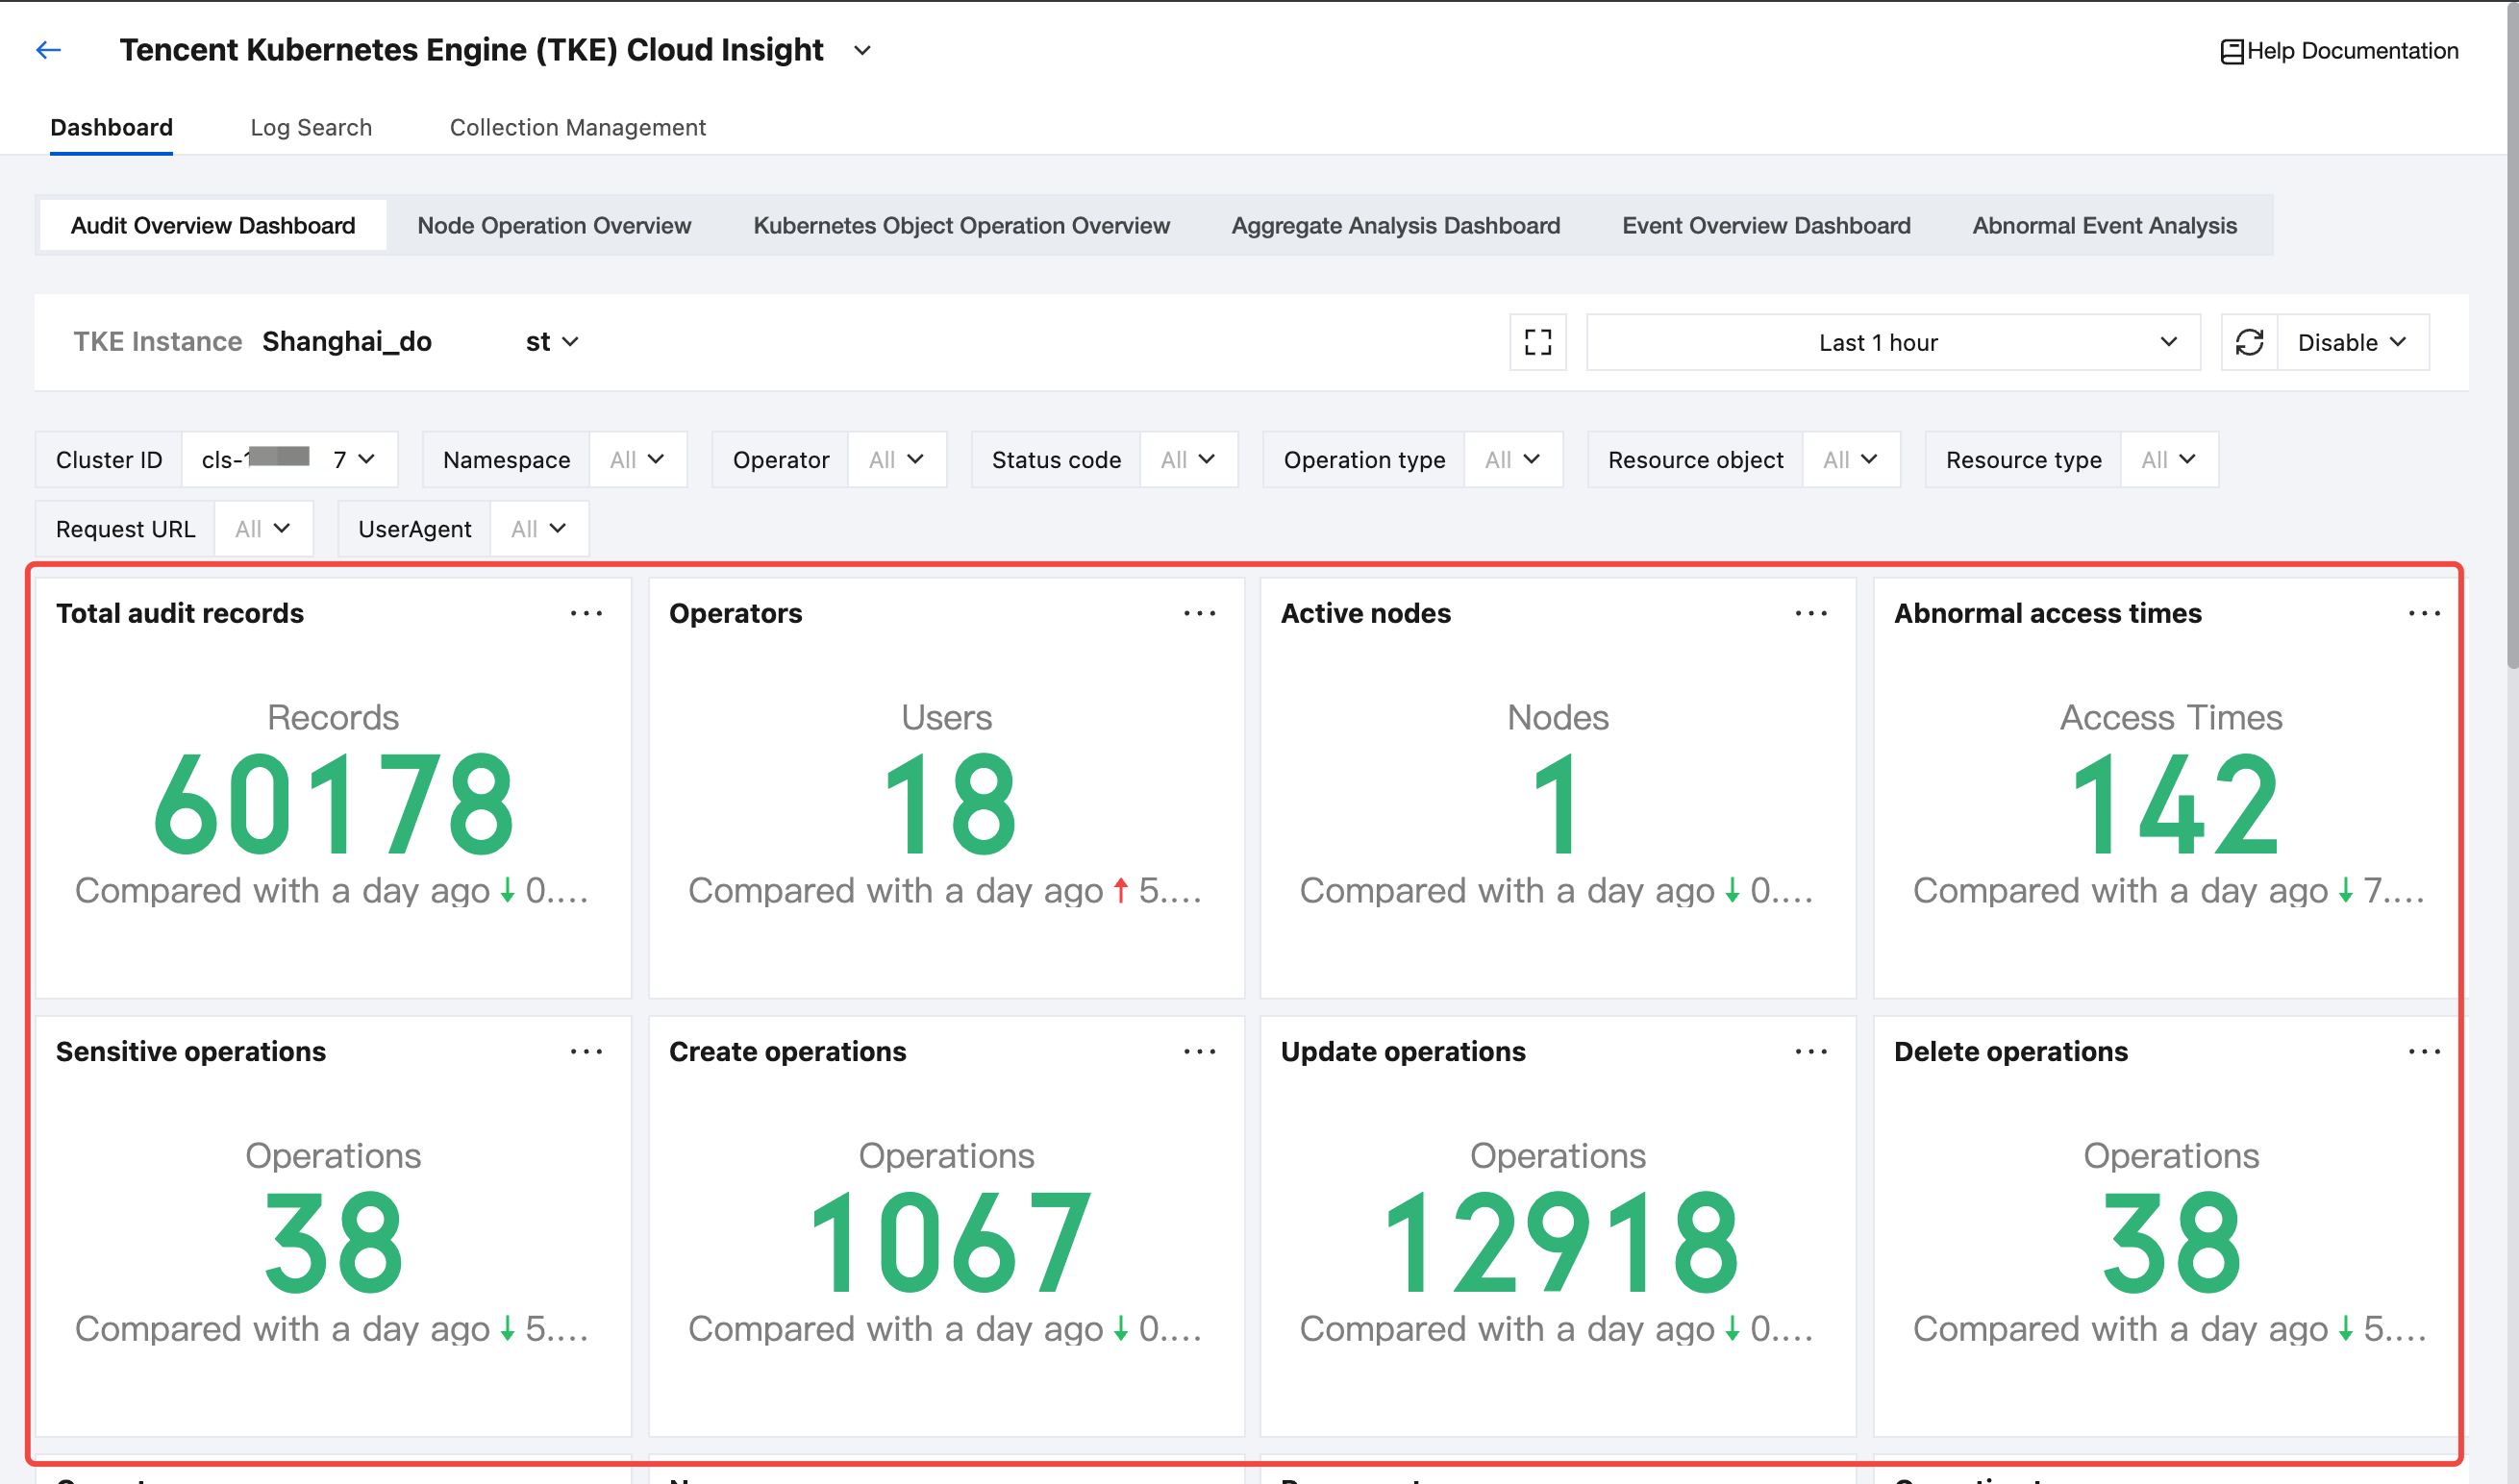
Viewing the TKE Cluster Audit and Event Analysis Dashboard
1. After enabling the audit or event log collection for the TKE cluster, select Dashboard in the top tab bar.
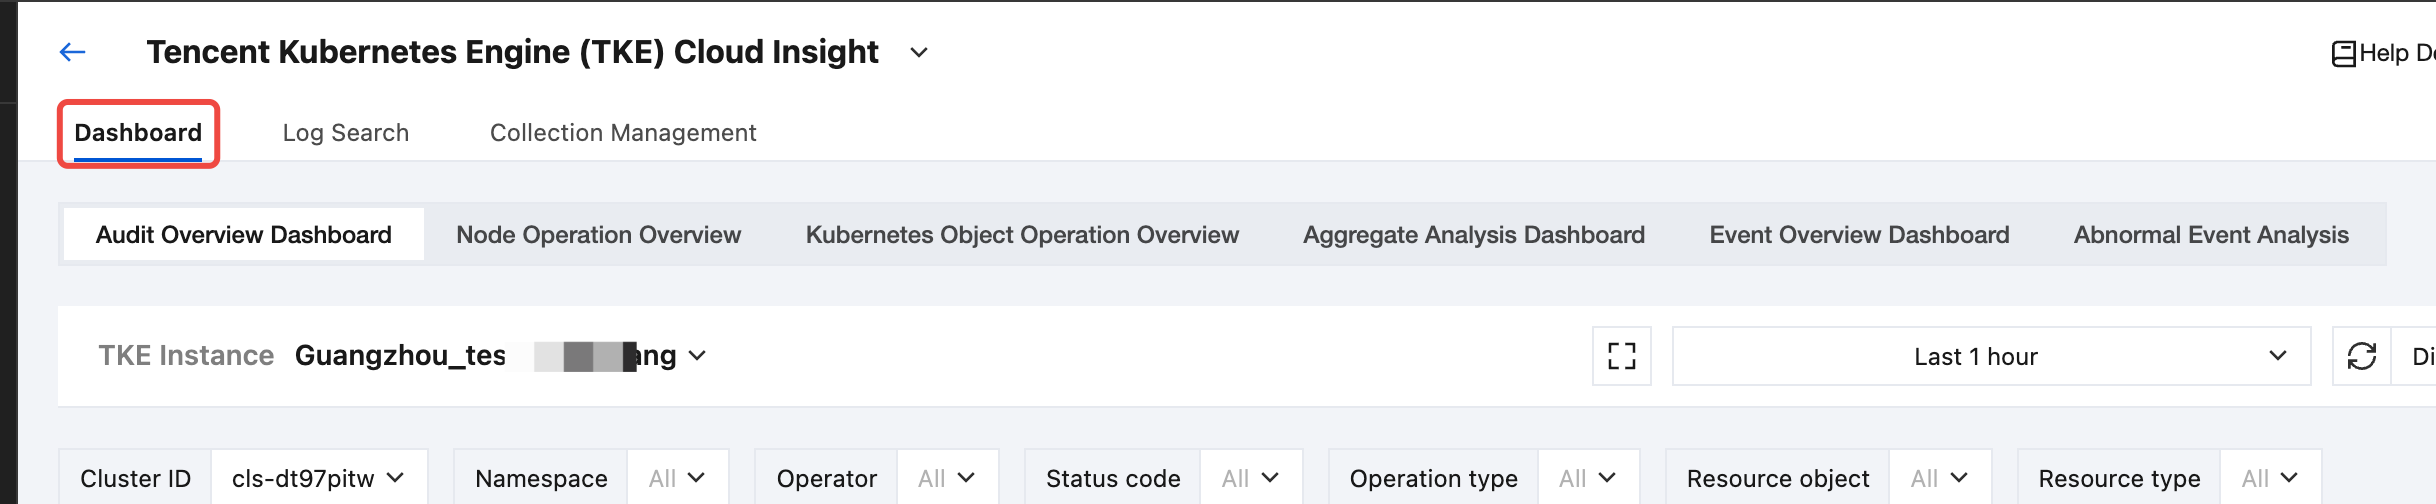
2. In the top secondary Tab, select the target audit or event dashboard.
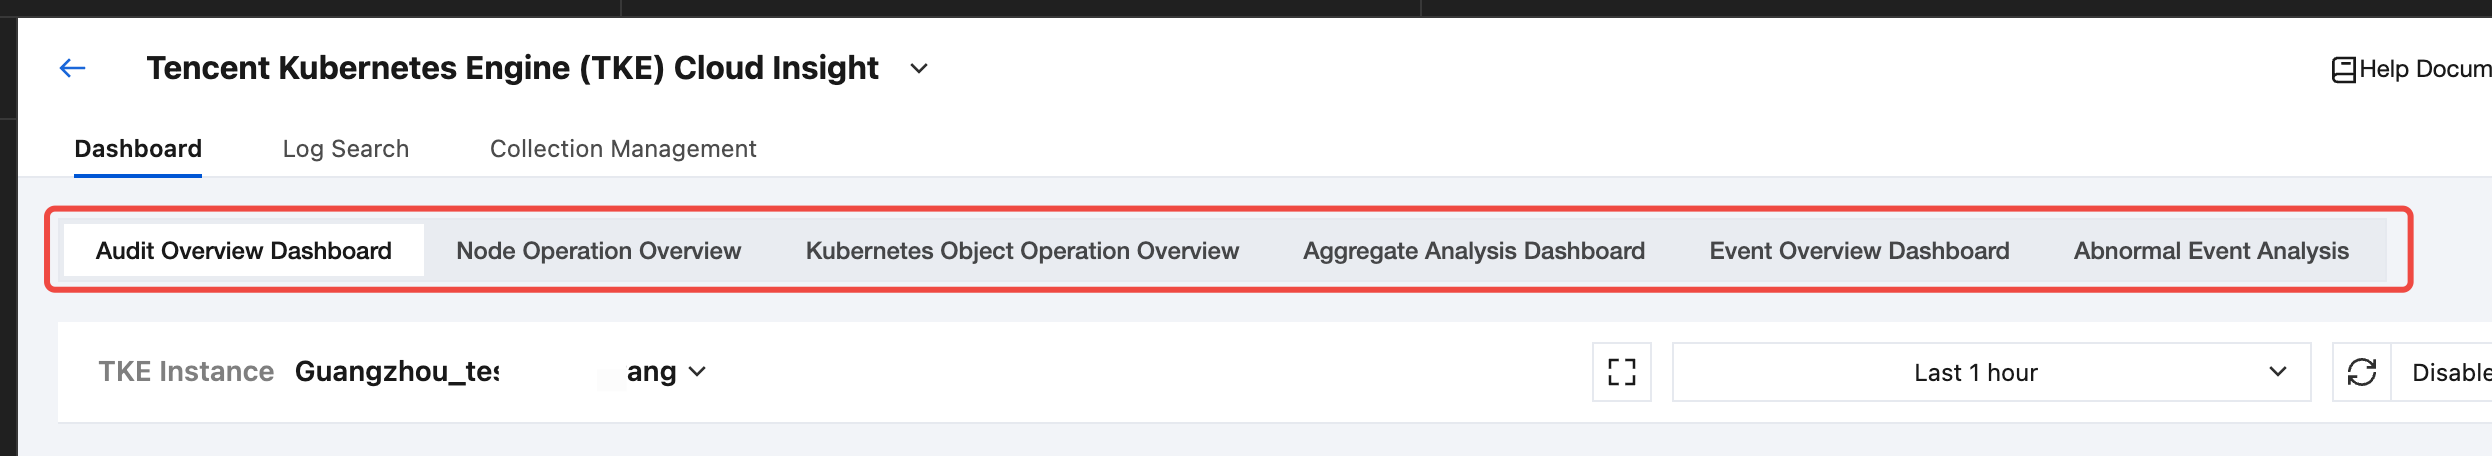
3. In the TKE cluster drop-down list, select the target TKE cluster with audit or event log collection enabled.
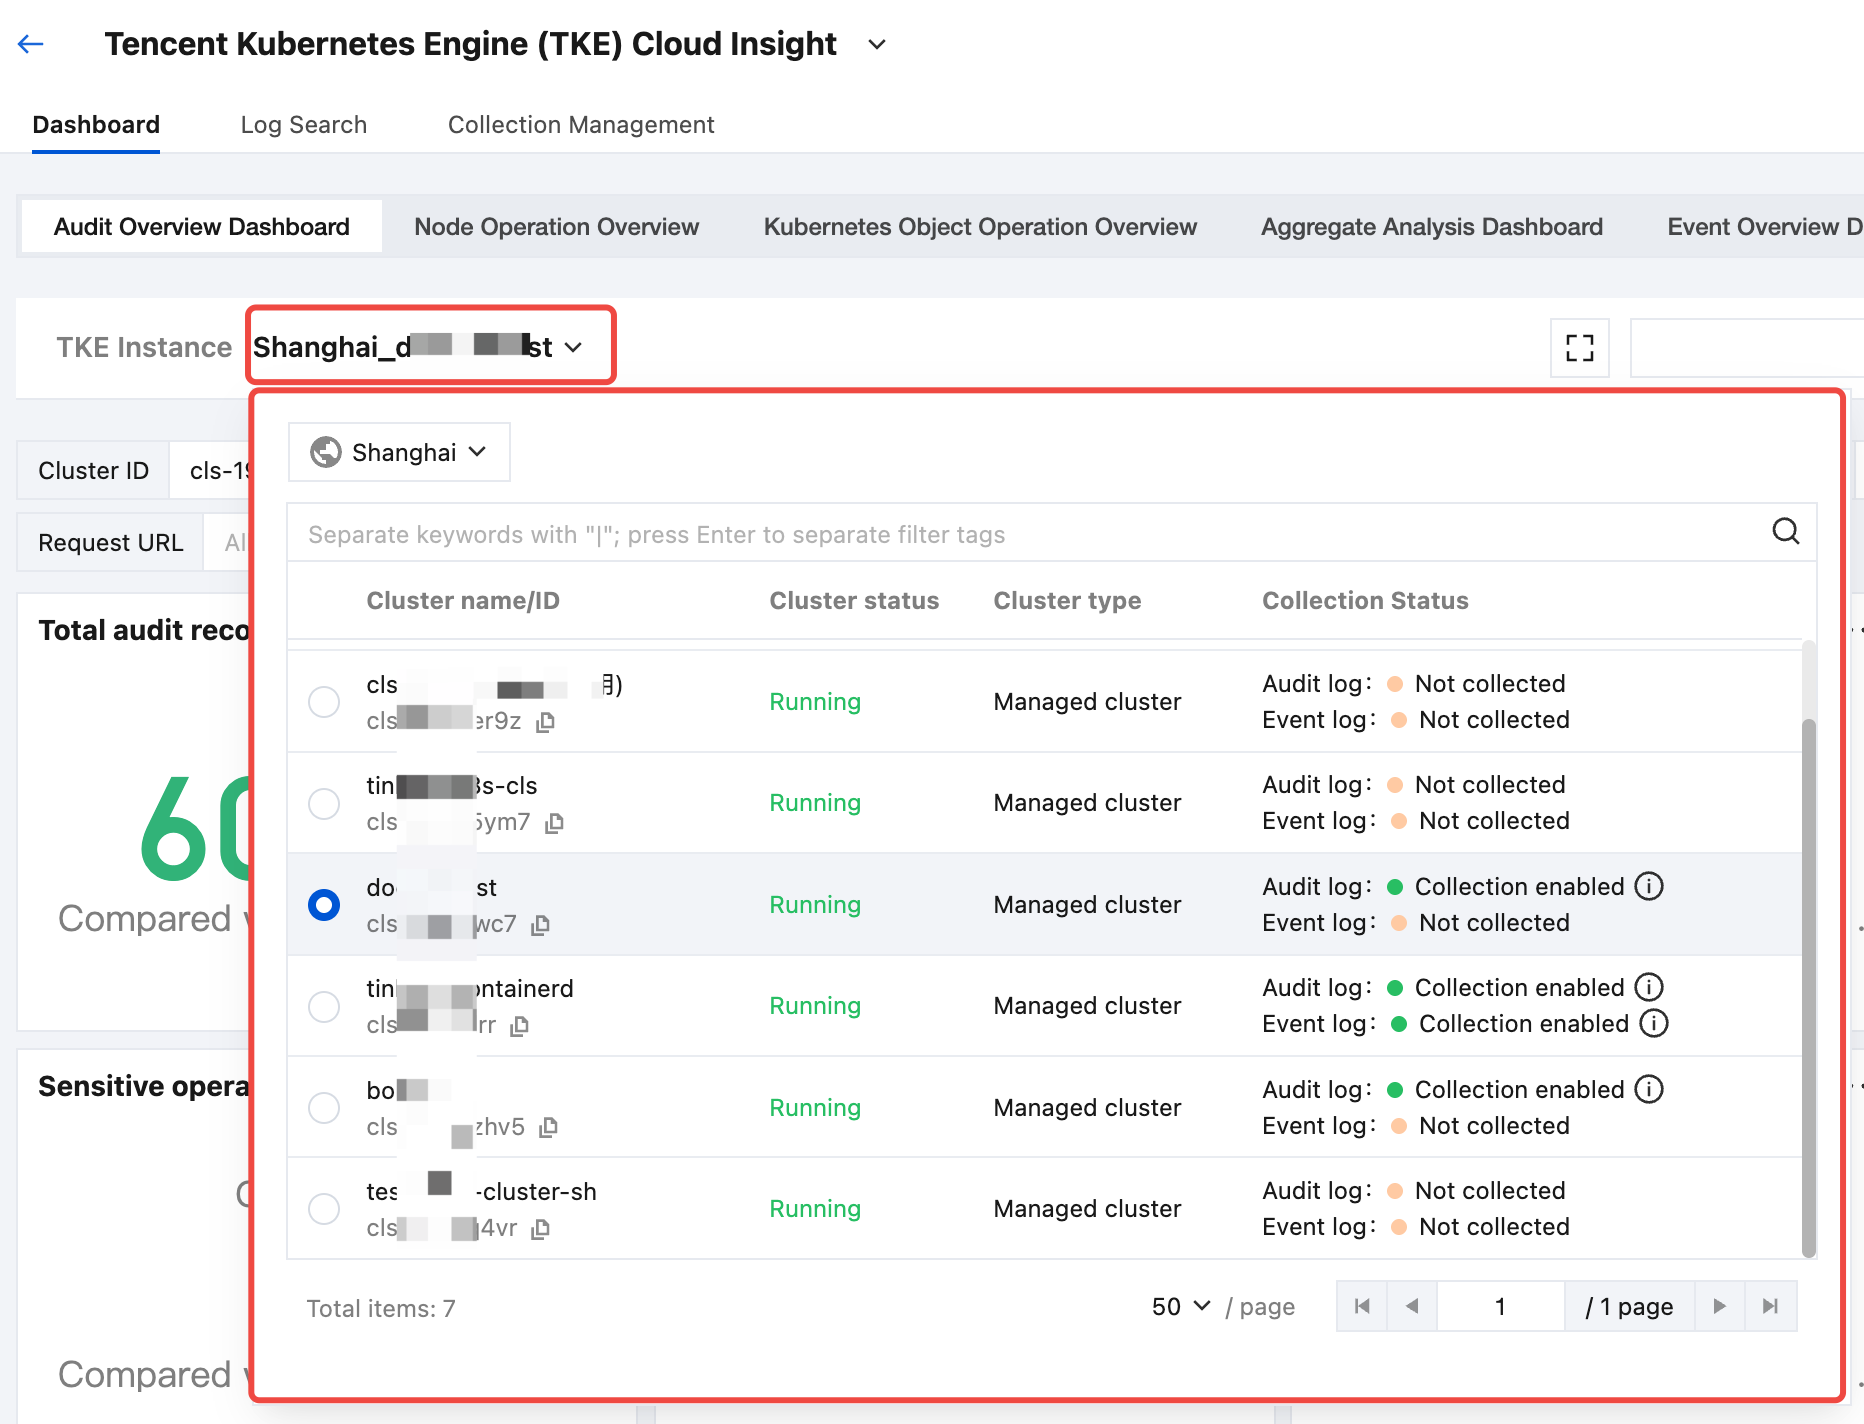
4. After selecting a cluster, you can view the event or audit analysis dashboard related to the selected cluster.
Upgrading Log Collection Component
On the Collection Management page, find the target TKE cluster. If the status of a collection component shows Upgrade available, you can click Update to upgrade the log collection component to the latest version.
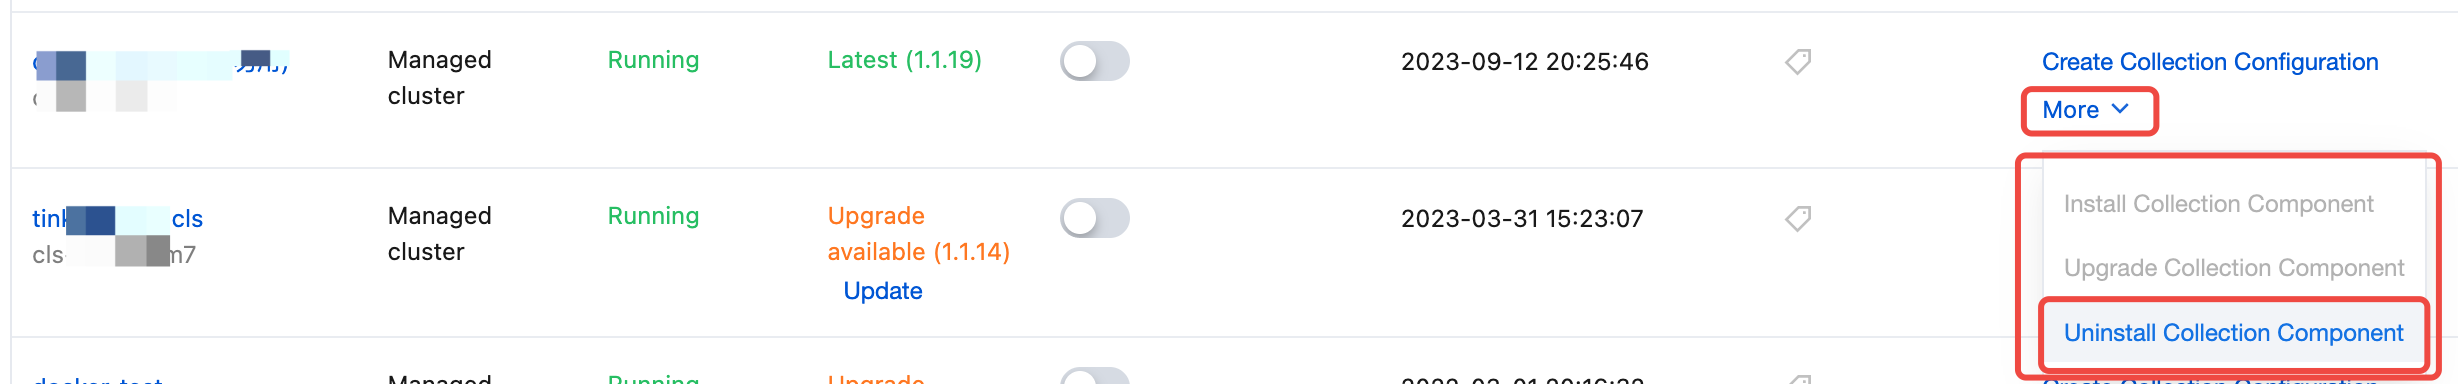
Uninstalling Log Collection Component
On the Collection Management page, find the target TKE cluster, click More in the operation column, and then click Uninstall Collection Component in the drop-down list.
Was this page helpful?
You can also Contact Sales or Submit a Ticket for help.
Yes
No