Metric topics use Prometheus’ PromQL syntax to query metric data. For detailed syntax, see the Prometheus official documentation. This document mainly describes some common syntax and directions to help you quickly understand the basic usage.
There are two types of metric queries:
Range queries: Also known as Prometheus Range queries. This method queries metric data at each time point within a specified time range based on the step. It is commonly used to observe trends in metric changes.
Note:
When the query step is less than the metric collection interval, the query results may contain duplicate data. For example, if the CPU utilization is reported every 15 seconds, and the query interval is set to 1 second, you will see 15 identical duplicate data.
Instant queries: Also known as Prometheus Instant queries, this method returns the latest metric data within the query time range. It is commonly used to retrieve the current value of a metric.
Common syntax
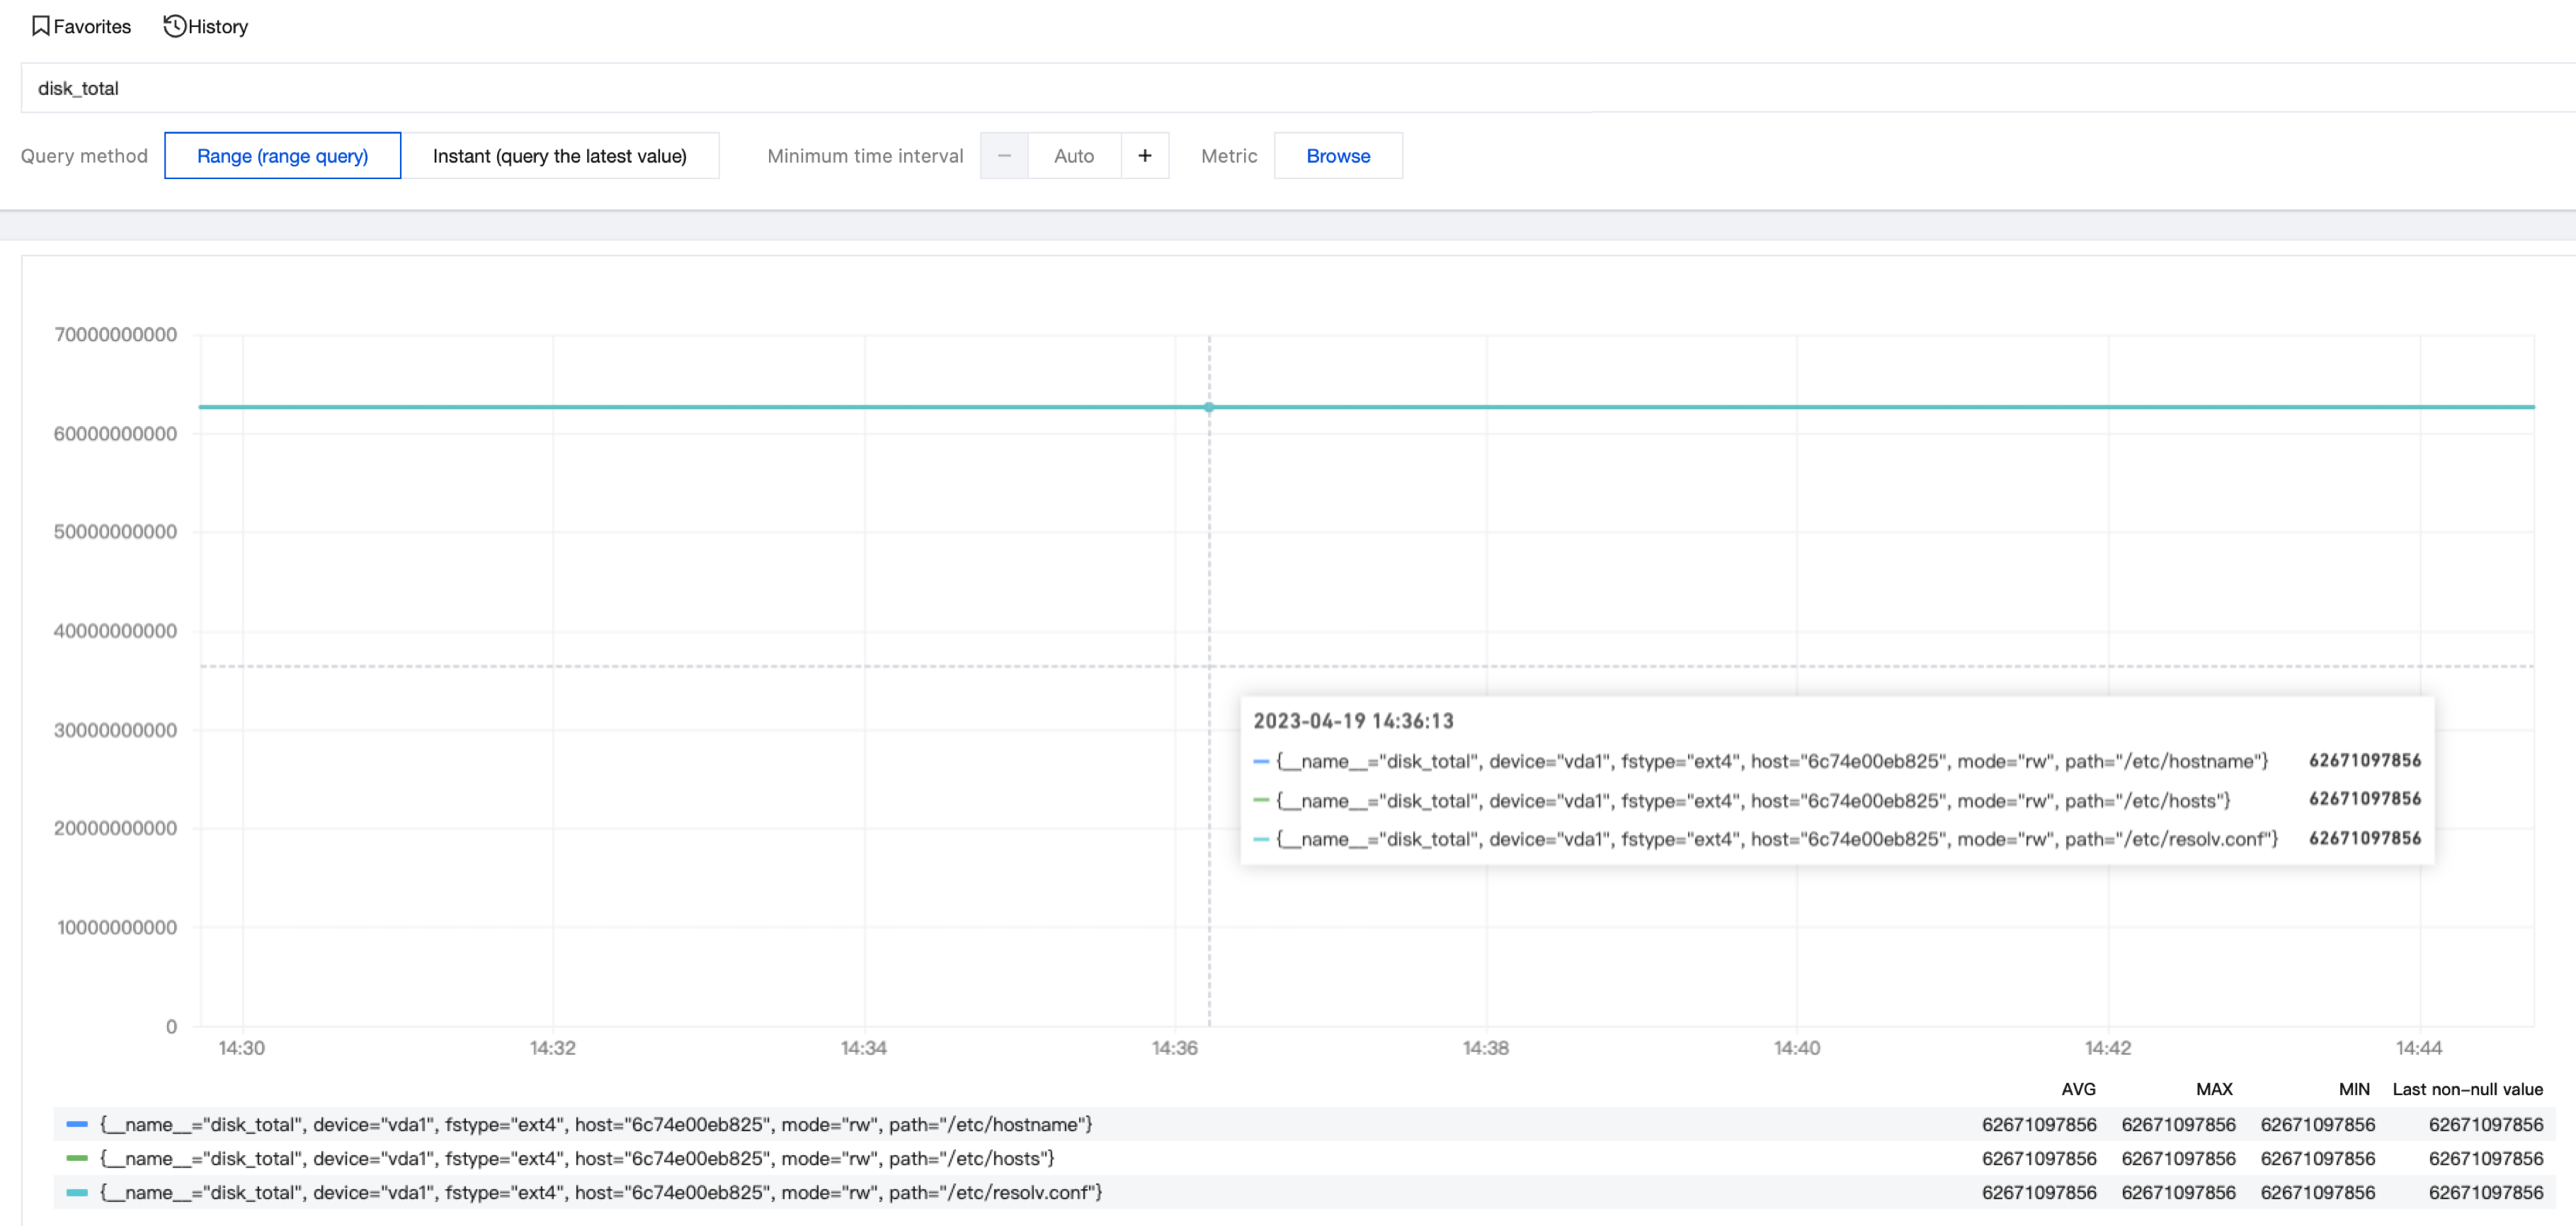
1. Specifies the metric name to query the trend of metric values for each dimension under that metric name. For example, querying the disk capacity (disk_total):
disk_total
Search for the required CAM policy as needed, and click to complete policy association.
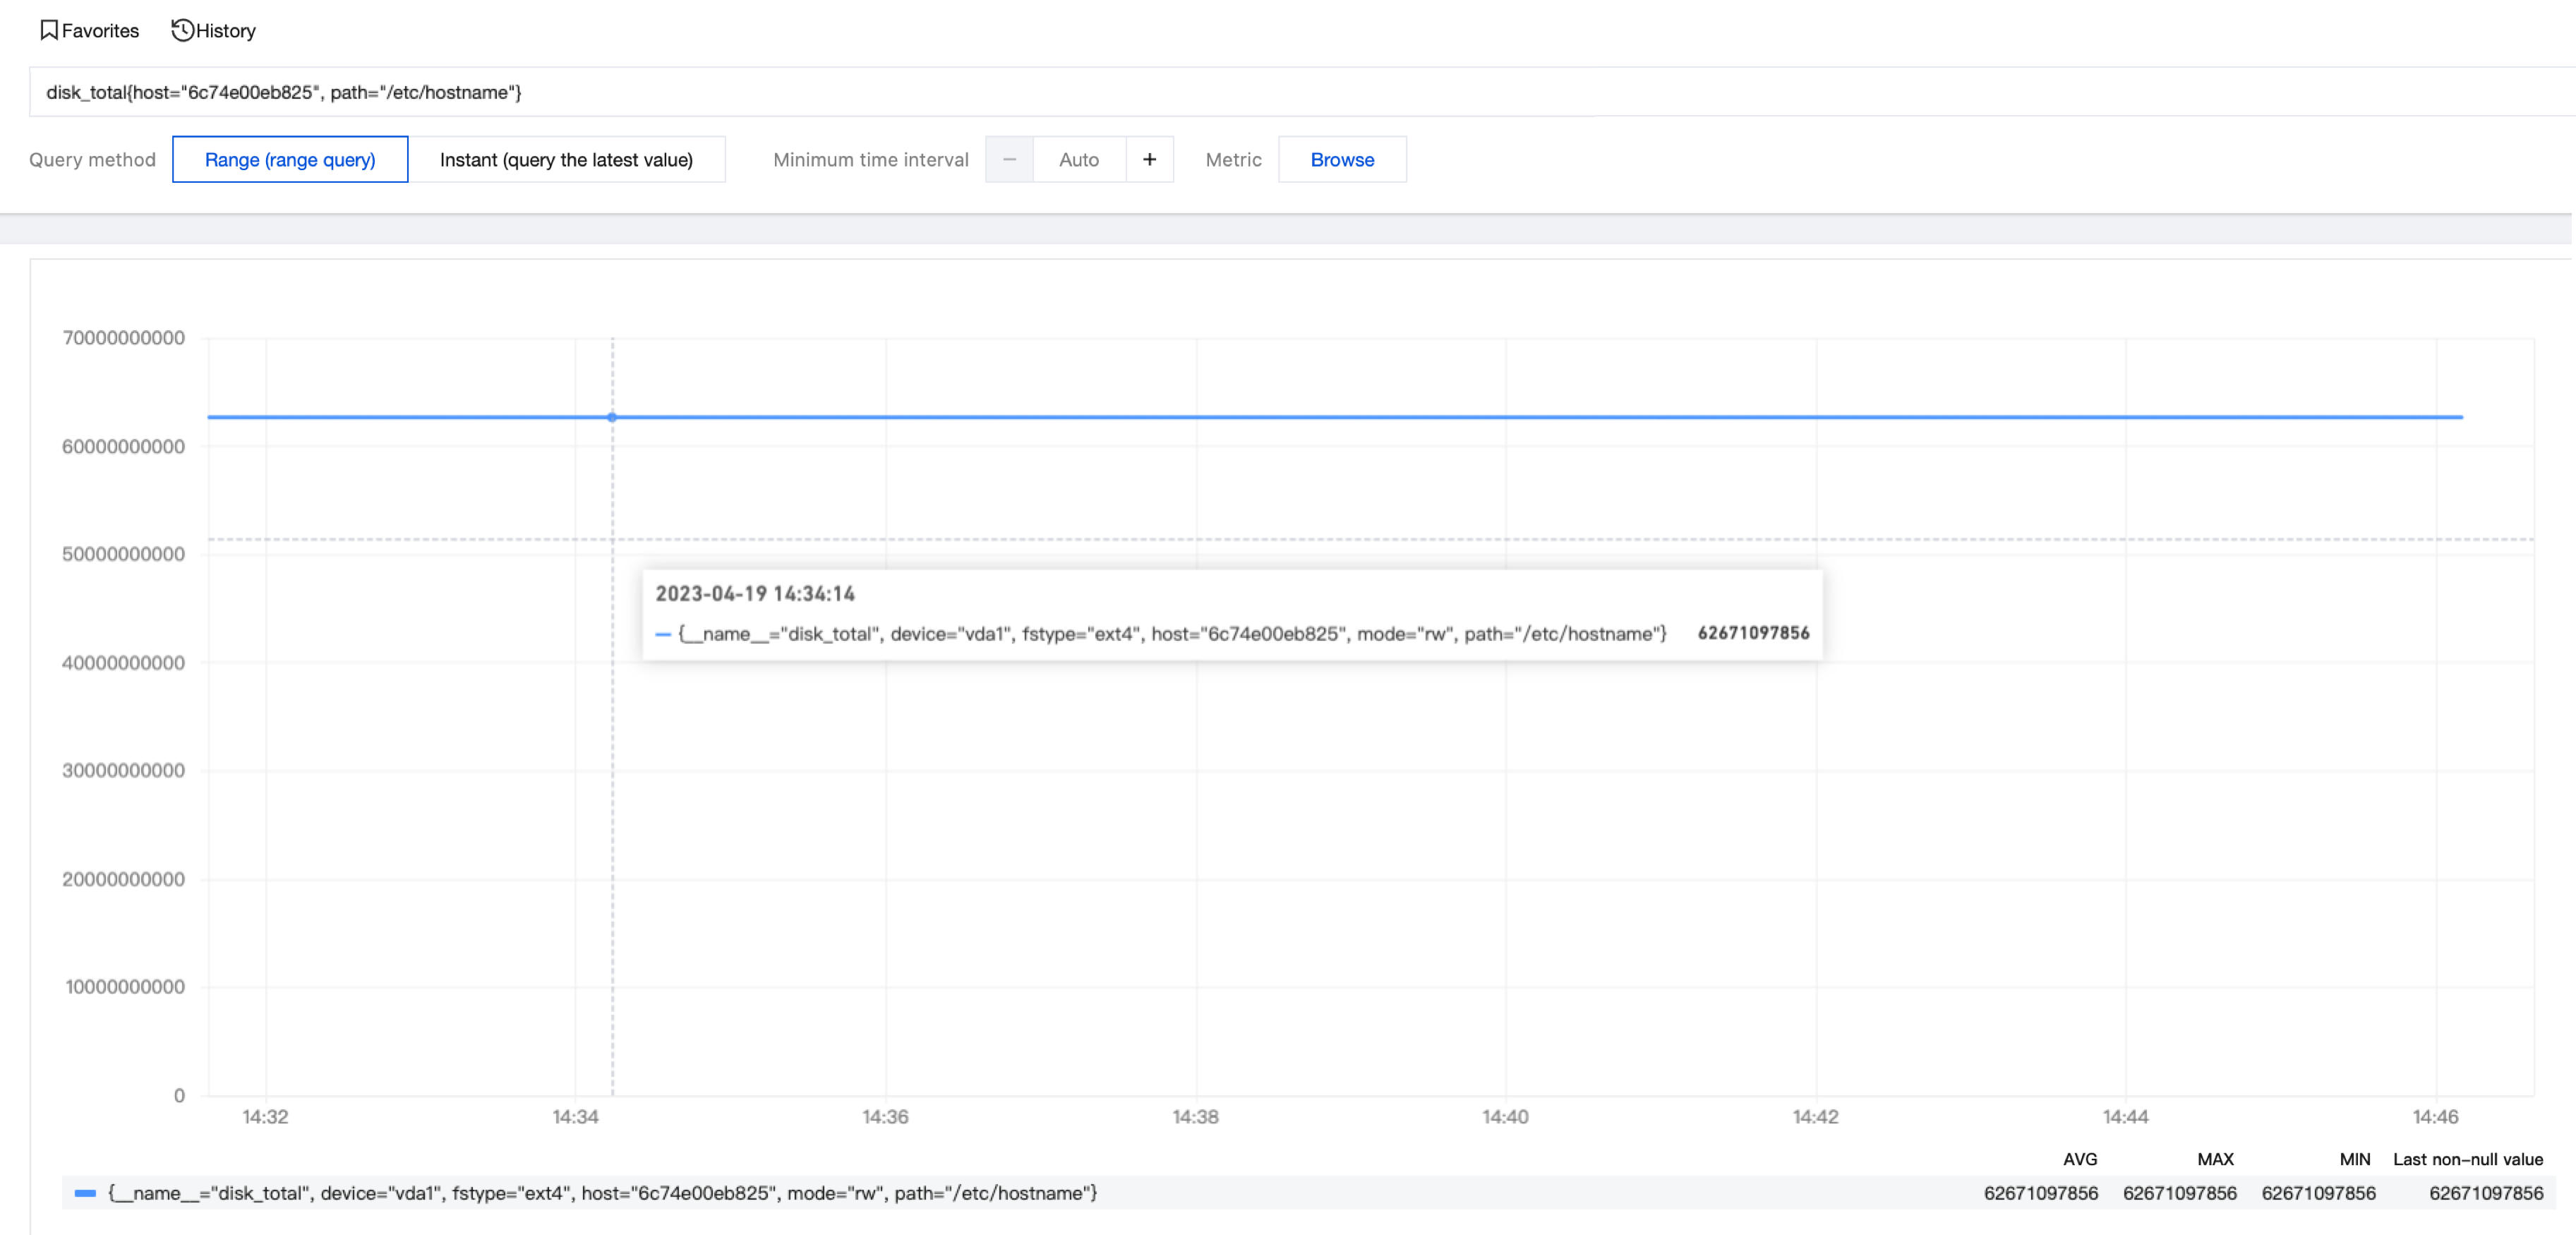
2. Specifies the metric name and dimensions to query the trend of metric values for a specific dimension combination. For example, querying the disk capacity where the hostname is 6c74e00eb825 and the path is /etc/hostname:
2. In the left navigation bar, select Search and Analysis, at the top, select the region where the metric topic is located, choose "Metric topic" as the subject type, and then select the required metric topic.
3. Enter the query statement in the input box, then click the
on the right to query metrics. You can also click Browse to query the names of existing metrics.