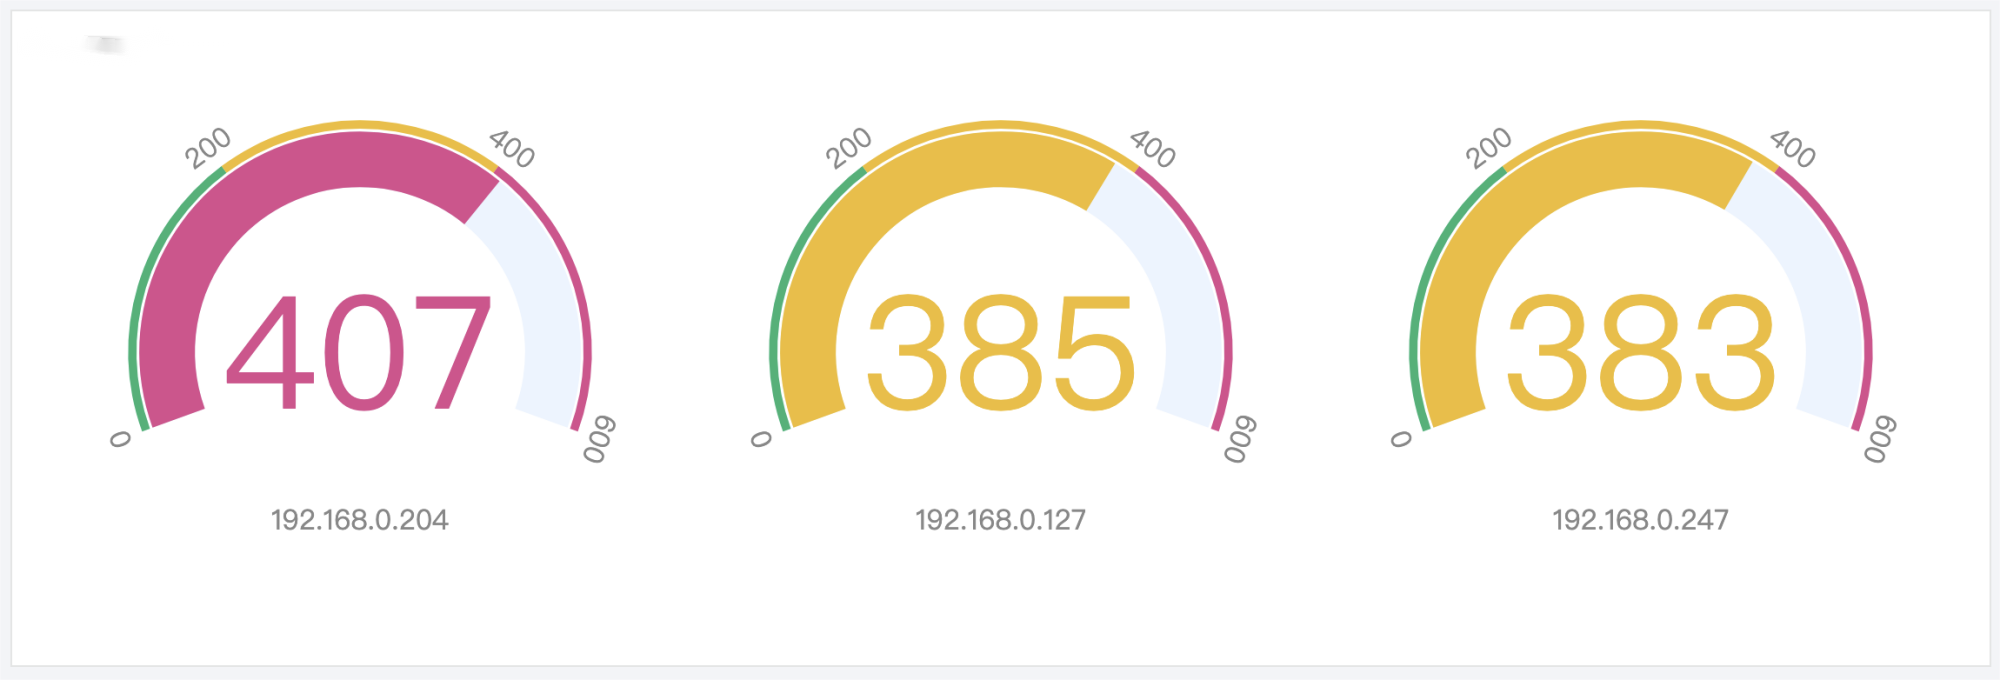
A gauge chart describes a single metric. Unlike an individual value plot, it is generally used with a threshold to measure the metric status. It is suitable for rating scenarios, such as system health monitoring.
Chart Configuration
General configuration
Configuration Item
Description
Basic information
Chart Name: Set the display name of the table, which can be left empty.
Standard configuration
Set the unit of all metric-type fields in the chart. For more information, see Unit Configuration.
Threshold configuration
Configuration Item
Description
Threshold configuration
Threshold point: Set the threshold points. You can add multiple threshold intervals. You can click a threshold color to open the color picker to customize the color.
MAX/MIN: Control the maximum and minimum values on the gauge. Data outside the range will not be displayed on the chart.